




What transformation temperatures actually mean
A steel transformation temperature is not a universal number printed beside a grade. It is a boundary or observed event that depends on composition, thermal history, specimen size, heating or cooling rate, and the mechanism by which one structure changes into another. The quoted temperature may describe equilibrium, the start of a reaction during heating, the start of a reaction during cooling, or the point at which a particular measurement detects a change. Those are related values, but they are not interchangeable.
A phase is a physically distinct structure with a defined crystal arrangement and composition range. In steel, austenite (γ) is face-centred cubic, ferrite (α) is body-centred cubic, and cementite is orthorhombic Fe₃C, as described by the University of Cambridge in Interpretation of the Microstructure of Steels (2008). A constituent is a microstructural grouping that may contain more than one phase. Pearlite, for example, is a constituent made of ferrite and cementite. A transformation product is the structure formed from the parent phase: pearlite, bainite, martensite, proeutectoid ferrite, and proeutectoid cementite are the principal products identified in ASM treatment of austenite transformations.
The distinction matters because a temperature can mark the disappearance of a phase without naming the final constituent. At approximately 0.8 wt% carbon and 723 °C, austenite undergoes the eutectoid reaction γ → α + Fe₃C, according to the University of Cambridge’s 2002 Fe–C material. That equation states the equilibrium products, ferrite and cementite. It does not mean that every steel containing roughly 0.8 wt% carbon forms the same structure at exactly 723 °C during an actual furnace cycle.
Equilibrium boundaries versus practical critical temperatures
| Notation | Meaning | Thermal condition or boundary |
|---|---|---|
| Ae1 | Equilibrium eutectoid temperature | Austenite and ferrite-plus-cementite mixture can coexist |
| Ae3 | Upper equilibrium austenite boundary | Austenite versus austenite-plus-ferrite field |
| Aecm | Upper equilibrium austenite–cementite boundary | Austenite versus austenite-plus-cementite field |
| Ac1 / Ac3 / Accm | Critical temperatures observed during heating | Austenite formation and completion during heating |
| Ar1 / Ar3 | Critical temperatures observed during cooling | Transformation during cooling |
| Ms / Mf | Martensite-start and martensite-finish temperatures | Displacive martensitic transformation |
Equilibrium notation describes what is thermodynamically stable when the system has sufficient time to approach equilibrium. Ae1 is the equilibrium eutectoid temperature: the boundary at which austenite and the ferrite-plus-cementite mixture can coexist under the specified composition and pressure. Ae3 is the upper equilibrium boundary for austenite in hypoeutectoid steel, separating austenite from the austenite-plus-ferrite field. Aecm is the corresponding upper boundary for hypereutectoid steel, separating austenite from the austenite-plus-cementite field. The subscript “e” signals equilibrium.
For slow cooling, heating critical temperatures may be approximately 33 °C higher than cooling values. Strong evidence
Operational temperatures are normally written with different notation. Ac1 and Ac3 refer to transformation temperatures observed while heating; Ar1 and Ar3 refer to those observed while cooling. The “c” and “r” indicate heating and cooling conditions, not new equilibrium phases. During heating, austenite may not begin to form until the material exceeds Ae1 because nucleation and diffusion require time. During cooling, ferrite, pearlite, or cementite may not appear until the steel is below the equilibrium boundary because the reaction requires undercooling. ASM International reports that, for slow cooling, heating critical temperatures may be approximately 33 °C higher than cooling values (2024). That difference is hysteresis, not an error in the phase diagram.
Composition shifts these boundaries as well. Carbon changes the stability of austenite and the temperatures at which ferrite, pearlite, cementite, and martensite can form. Alloying elements shift the boundaries and alter reaction rates; silicon, for example, raises the transformation-temperature range, lowers carbon solubility in austenite, and tends to dissociate iron carbide. The pure-iron reference is already temperature-dependent: Cambridge places face-centred cubic austenite at approximately 910–1400 °C and the melting temperature at approximately 1539 °C (2005). A steel grade cannot therefore inherit one fixed “austenitising temperature” from pure iron.
Heating, cooling, isothermal holding, and continuous cooling

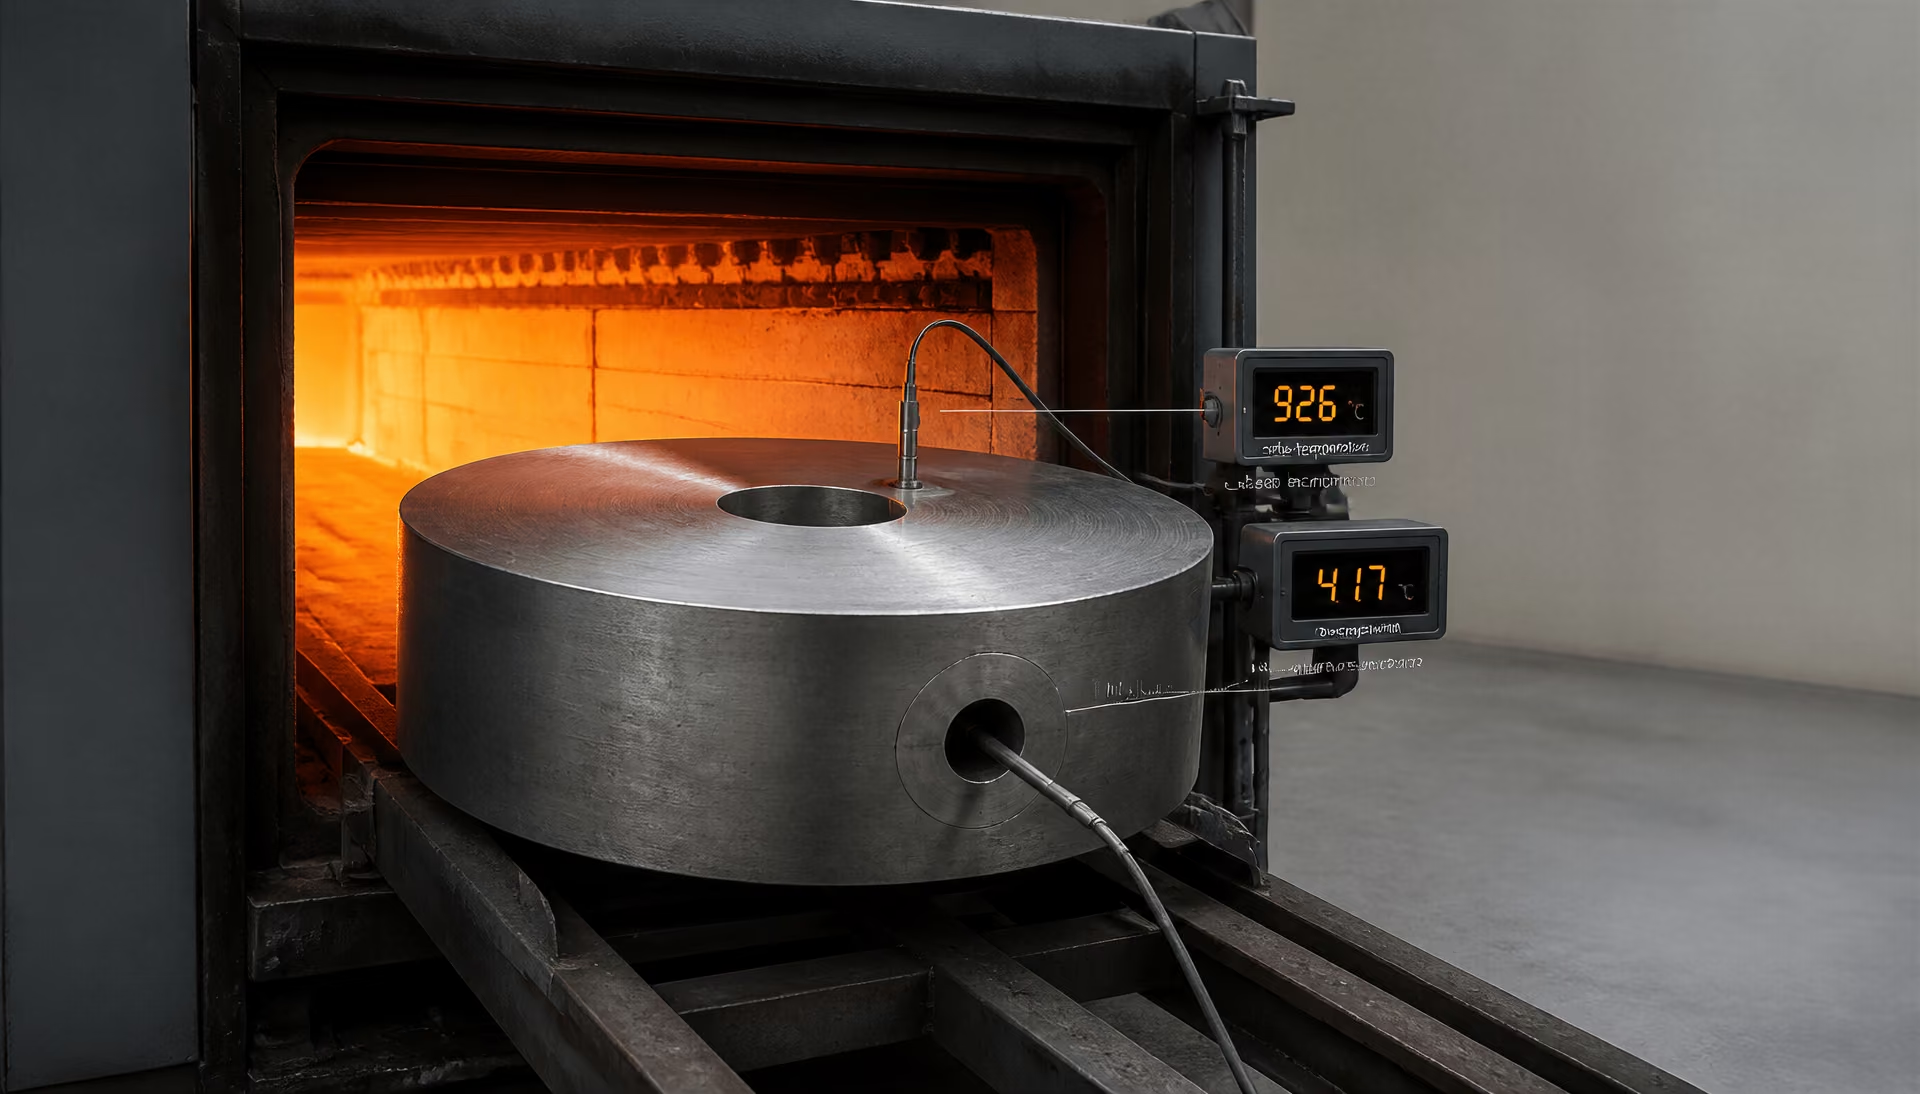
How thermal path changes the question
- Heating Determine when ferrite and cementite dissolve sufficiently for austenite to form.
- Cooling Determine which reaction ranges are crossed and which transformation products can form.
- Isothermal holding Hold austenite at one selected temperature and read transformation start and finish times from a TTT diagram.
- Continuous cooling Follow a changing temperature path on a CCT diagram.
Heating, cooling, and holding produce different questions. On heating, the issue is when ferrite and cementite dissolve sufficiently for austenite to form. Thermal lag means that the furnace temperature, the surface temperature, and the core temperature of a thick component may differ substantially. A pyrometer reading can cross Ac1 while the centre has not. Section size then changes the effective thermal path even when the nominal furnace schedule is identical.
On cooling, the reaction path determines the transformation product. Slow cooling gives diffusion-controlled, reconstructive products such as proeutectoid ferrite and pearlite, allowing carbon and iron atoms to redistribute. Faster cooling suppresses those reactions and may produce bainite or martensite. Cambridge describes bainite growth as diffusionless with respect to the iron lattice and thermodynamically possible below the T₀ temperature, where bainite has lower free energy than austenite of identical composition. Martensite is a displacive, essentially diffusionless transformation: its formation does not require carbon to travel long distances, although carbon content strongly affects its start temperature.
An isothermal transformation holds austenite at one chosen temperature after rapid cooling to that temperature. A TTT diagram—time-temperature-transformation diagram—shows when products start and finish under such holding conditions. Its C-curves represent time-dependent reactions such as pearlite and bainite, while the martensite-start temperature, Ms, marks an athermal transformation governed mainly by the temperature reached rather than by an incubation time. Mf is the martensite-finish temperature, although cooling may stop above Mf and leave retained austenite. Cambridge reports that carbon affects Ms, Mf, and the retained-austenite fraction (2012).
A CCT diagram instead records transformation during continuous cooling. Cooling rate determines which start curves are crossed and how long the steel remains in each reaction range. The NIST Continuous-Cooling Transformation Characteristics of SAE 1141 Steel (1990) shows that a CCT diagram can estimate hardenability and predict room-temperature microstructure, strength, hardness, machinability, and fatigue properties. That is why a CCT value is not a replacement for an Ae value. Equilibrium boundaries describe permitted phase stability; TTT and CCT diagrams describe when real transformation products appear along particular thermal paths.
The iron–carbon framework: phases, crystal structures, and fields
The iron–carbon diagram is an equilibrium map, not a temperature lookup table. Its fields identify which phases are thermodynamically stable for a particular composition and temperature, assuming sufficient time for diffusion. Actual steel often follows a different route: heating and cooling rates shift transformation temperatures, alloying elements alter phase stability, and rapid cooling can suppress diffusion-controlled products. The same nominal grade may therefore contain ferrite, pearlite, bainite, martensite, retained austenite, or mixtures of these, depending on its thermal history.
The diagram also distinguishes a phase from a microstructural constituent and from a transformation product. Ferrite, austenite, and cementite are phases. Pearlite is a two-phase constituent. Bainite and martensite are transformation products whose structures and compositions depend on how austenite decomposes.
Ferrite, austenite, and cementite
Ferrite, conventionally written α in this context, is an iron-rich solid solution with a body-centred cubic (BCC) crystal structure. Carbon has very low solubility in BCC ferrite because the available interstitial sites are small and poorly suited to carbon. At ordinary temperatures, low-carbon steels commonly contain ferrite as their continuous or matrix phase. Its relatively low carbon content and BCC lattice help explain its lower hardness compared with martensite.
Austenite, written γ, has a face-centred cubic (FCC) crystal structure. The FCC lattice provides larger and more favourable interstitial sites, so it dissolves substantially more carbon than ferrite. This carbon-holding capacity is central to steel heat treatment: austenitising attempts to place carbon into γ before cooling determines whether it forms pearlite, bainite, martensite, or another mixture.
In pure iron, the University of Cambridge’s 2005 Stainless Steels: Phase Equilibria material places FCC austenite at approximately 910–1400 °C. That interval is specific to pure iron, not a universal range for steel. Pure iron melts at approximately 1539 °C, while carbon and alloying additions move phase boundaries and transformation temperatures.
Cementite, Fe₃C, is an iron carbide with an orthorhombic crystal structure. It is a compound phase containing approximately 6.67 wt% carbon, far more than ordinary structural steels contain overall. Cementite is hard and brittle, and its amount, shape, spacing, and continuity strongly affect mechanical behaviour. The Cambridge Interpretation of the Microstructure of Steels source (2008) identifies the three structures directly: austenite is FCC, ferrite is BCC, and cementite is orthorhombic Fe₃C.
These labels describe crystal structures, not simply appearance in a microscope. A ferrite grain is one phase even if it contains defects or small solute concentrations. Cementite particles within ferrite remain a separate phase because their composition and crystal structure differ.
The eutectoid composition and reaction[1] Materials Science & Metallurgy. University of Cambridge. University of Cambridge phase-trans materials, 2002.
A useful organising example is the eutectoid point. The University of Cambridge’s 2002 Materials Science & Metallurgy material gives approximately 0.8 wt% carbon and 723 °C for the reaction
Both values are approximate and source-specific. Published diagrams may show slightly different figures because of reference states, experimental data, alloy assumptions, or the convention used for defining a critical temperature. The notation itself is more important than treating 0.8 wt% and 723 °C as exact constants.
At the eutectoid composition, austenite transforms into ferrite and cementite as the temperature falls through the equilibrium eutectoid temperature. Under suitable cooling conditions, these phases arrange themselves into alternating plates or lamellae called pearlite. Pearlite is not a third crystal structure and is not a single phase. Each ferrite lamella is BCC; each cementite lamella is orthorhombic Fe₃C. The colony-level pattern is a transformation product or microstructural constituent produced by cooperative growth of two phases.
Cooling rate changes the spacing and sometimes the product itself. Slow cooling allows carbon to diffuse over longer distances and tends to produce relatively coarse pearlite. Faster cooling can produce finer pearlite, bainite, or, if diffusion is largely prevented, martensite. ASM International lists pearlite, bainite, martensite, proeutectoid ferrite, and proeutectoid cementite among the principal products formed from austenite.[2] Continuous-Cooling Transformation Characteristics of SAE 1141 Steel. National Institute of Standards and Technology. NIST Interagency Report, 1990.
This is why “the transformation temperature of steel” is an incomplete expression. An equilibrium diagram supplies values such as Ae₁, the equilibrium eutectoid temperature, whereas heating and cooling produce Ac and Ar temperatures that can differ. ASM’s 2024 Critical Temperature Ranges notes that, under slow cooling, heating critical temperatures may be approximately 33 °C higher than cooling values. Isothermal transformation diagrams describe a hold at a selected temperature; continuous-cooling-transformation (CCT) diagrams describe uninterrupted cooling. The NIST 1990 study Continuous-Cooling Transformation Characteristics of SAE 1141 Steel shows how a CCT diagram can estimate hardenability and predict room-temperature microstructure, strength, hardness, machinability, and fatigue properties.
Silicon provides a further warning against fixed values. ASM reports that silicon raises the transformation-temperature range, lowers carbon solubility in austenite, and tends to dissociate iron carbide. Composition changes the fields before the furnace cycle even begins.
Proeutectoid ferrite and proeutectoid cementite
Steels with less carbon than the eutectoid composition are hypoeutectoid steels. During cooling from austenite, ferrite forms first, before the remaining austenite reaches the eutectoid composition. This early ferrite is called proeutectoid ferrite. At the eutectoid temperature, the residual austenite then transforms into pearlite. A final hypoeutectoid structure therefore commonly contains proeutectoid ferrite plus pearlite, although cooling rate and alloying can introduce bainite or martensite.
Steels with more carbon than the eutectoid composition are hypereutectoid steels. Cementite forms first from austenite, usually along prior-austenite grain boundaries or other favourable sites. This is proeutectoid cementite. The remaining austenite becomes eutectoid in composition and transforms into pearlite on further cooling. The resulting structure commonly contains proeutectoid cementite plus pearlite.
The word “proeutectoid” means “formed before the eutectoid reaction,” not “formed before austenite exists.” Both products form from austenite during cooling. Their amounts depend on composition and the path through the phase fields, while their morphology depends on nucleation, diffusion, grain size, and cooling rate. If cooling is rapid enough, the eutectoid decomposition can be bypassed. Cambridge’s 2008 steel-microstructure material distinguishes these reconstructive, diffusion-controlled reactions from displacive transformations; martensite can form without the long-range chemical diffusion required to make pearlite. Carbon also affects martensite-start and martensite-finish temperatures and the fraction of retained austenite, as recorded in Cambridge’s 2012 Time-Temperature-Transformation Diagram for Steel.
Austenite formation during heating
Austenite does not appear at one universal temperature. Its formation depends on carbon content, alloying additions, heating rate, holding time, and the ferrite–pearlite or tempered structure present before heating. The phase itself is face-centred cubic γ-iron; ferrite is body-centred cubic α-iron, while cementite is orthorhombic Fe₃C, as described by the University of Cambridge’s Interpretation of the Microstructure of Steels (2008). Heating changes both the crystal structure and the distribution of carbon between these phases.
The symbols Ac1, Ac3, and Accm describe practical critical temperatures measured or observed during heating. The “c” indicates heating, while the “1” marks the start of austenite formation. Ac1 is therefore the temperature at which austenite first forms from ferrite and pearlite, or from pearlite and cementite in a hypereutectoid steel. Ac3 is the temperature at which the last proeutectoid ferrite disappears in a hypoeutectoid steel. Accm is the corresponding upper boundary for a hypereutectoid steel: above it, cementite has entered solution and the structure is fully austenitic, apart from undissolved alloy carbides.
These are not the same as Ae1, Ae3, and Aecm. The Ae notation refers to equilibrium conditions, where phase proportions are allowed to adjust through diffusion at a defined composition and temperature. Ac values describe a real heating path, so they shift with heating rate, specimen size, prior condition, and measurement method. ASM International states that, under slow cooling, heating critical temperatures may be approximately 33 °C higher than cooling values (Critical Temperature Ranges, 2024). A published Ac1 or Ac3 value must therefore be tied to a steel composition and a test condition.
Crossing Ac1, Ac3, and Accm
In a hypoeutectoid steel, such as a typical low-carbon structural grade, the starting structure commonly contains ferrite plus pearlite. Near the eutectoid composition, the pearlite colonies begin to transform at Ac1. At approximately 0.8 wt% carbon and 723 °C, the equilibrium eutectoid reaction is γ → α + Fe₃C, according to the University of Cambridge’s Materials Science & Metallurgy material (2002). Heating reverses that reaction: ferrite and cementite within pearlite are consumed to form austenite.
The transformation does not occur as a perfectly sharp front. Austenite nucleates at ferrite–cementite interfaces, pearlite colony boundaries, and other high-energy sites. It then grows into the surrounding ferrite. Because carbon diffuses much more rapidly through austenite than substitutional alloying elements do, carbon concentration becomes uneven during the early stage. The final ferrite dissolves only as the temperature rises toward Ac3. Below Ac3, the mixture is austenite plus proeutectoid ferrite; above Ac3, the matrix is austenite.
A hypereutectoid steel follows a different path. Pearlite transforms after Ac1, but proeutectoid cementite remains around prior-austenite grain boundaries or within the structure. Austenite is not fully established until the temperature passes Accm and the cementite has dissolved sufficiently. Heating just above Ac1 can therefore leave austenite with a substantial cementite fraction. Calling that condition “fully austenitized” is incorrect.
For pure iron, Cambridge phase-equilibria data place face-centred cubic austenite between approximately 910 and 1400 °C, with melting near 1539 °C. Steel does not follow those pure-iron limits: carbon and alloying elements move the boundaries, and industrial heating often occurs far from equilibrium. The practical question is not simply whether a furnace reached a printed temperature. It is whether the required phases had time to transform throughout the section.
Carbon dissolution and carbide redistribution
Carbon must leave cementite and diffuse through the growing austenite. A fine pearlitic structure usually transforms faster than coarse pearlite because it provides more ferrite–cementite interface area and shorter diffusion distances. Prior cold work, grain size, segregation, and a previous tempering treatment also change nucleation sites and dissolution rates.
After Ac1, the newly formed austenite may contain less carbon than the equilibrium value at that temperature, while regions near dissolving cementite contain more. Holding permits carbon redistribution. Insufficient time can leave undissolved cementite, carbon-poor austenite, or local composition gradients. Excessive temperature or holding can enlarge prior-austenite grains even when dissolution is already complete.
Alloy carbides make the process slower. Chromium-, molybdenum-, vanadium-, niobium-, and titanium-bearing carbides can remain stable well above the temperature needed to dissolve ordinary Fe₃C. Their persistence may be intentional, but it means that a nominal “austenitizing temperature” does not guarantee that every carbon-containing particle has entered solution. Carbon and substitutional atoms also segregate during casting and prior processing, so local transformation temperatures can differ within one component.
The effect of silicon and alloying additions
Silicon is a clear example of why composition must accompany any transformation temperature. ASM International reports that silicon raises the transformation-temperature range, decreases carbon solubility in austenite, and tends to dissociate iron carbide. In silicon-alloyed steels, cementite stability and carbon partitioning therefore differ from those in plain-carbon steel. The result may be a higher practical heating boundary, altered carbide dissolution, and a greater tendency for carbon to remain distributed between austenite and other constituents during the thermal cycle.
Manganese generally lowers critical transformation temperatures and increases hardenability, while nickel stabilizes austenite and chromium, molybdenum, vanadium, niobium, and titanium can form stable carbides or nitrides. The combined effect cannot be inferred from a single element in isolation. Heating rate matters too: rapid heating can produce higher observed Ac values because diffusion and nucleation lag behind the furnace temperature.
The resulting austenite controls later transformation. On cooling, it may form pearlite, bainite, proeutectoid ferrite, proeutectoid cementite, or martensite, depending on composition and the cooling path. The NIST Continuous-Cooling Transformation Characteristics of SAE 1141 Steel report (1990) shows why a CCT diagram is used to estimate hardenability and predict room-temperature microstructure, strength, hardness, machinability, and fatigue properties. Austenite formation is the starting condition, not a guarantee of any one final structure.
Cooling products: pearlite, bainite, martensite, and proeutectoid phases
| Cooling condition or product | Dominant mechanism | Typical result described in the article |
|---|---|---|
| Slow cooling | Diffusion-controlled, reconstructive transformation | Proeutectoid ferrite or cementite and pearlite |
| Intermediate cooling | Displacive iron-lattice change with carbon redistribution | Bainite |
| Rapid cooling | Coordinated displacive transformation with limited long-range diffusion | Martensite |
| Cooling stops above Mf | Martensitic transformation remains incomplete | Retained austenite |
| Mixed cooling path | More than one transformation range is crossed | Mixed ferrite, pearlite, bainite, martensite, or retained austenite |
Austenite does not have one inevitable cooling product. The result depends on carbon and alloy content, prior austenite grain size, heating condition, cooling rate, and the time spent at each temperature. ASM International identifies pearlite, bainite, martensite, proeutectoid ferrite, and proeutectoid cementite as principal products of austenite transformation. These names do not all describe the same kind of thing: ferrite and cementite are phases, pearlite and bainite are transformation products containing more than one phase, and martensite is a supersaturated phase formed by a different mechanism.
The familiar eutectoid reaction illustrates the distinction. The University of Cambridge, Materials Science & Metallurgy (2002), places the reaction at approximately 0.8 wt% carbon and 723 °C:
Here, γ is face-centred cubic austenite, α is body-centred cubic ferrite, and Fe₃C is orthorhombic cementite, as described in Cambridge’s Interpretation of the Microstructure of Steels (2008). The temperature is an equilibrium reference, not a universal switching point. Actual transformation may start below or above it, depending on thermal path and composition.
Pearlite as a reconstructive diffusion-controlled product
Pearlite forms when austenite decomposes cooperatively into alternating ferrite and cementite. Carbon must redistribute: ferrite can dissolve only a small amount of carbon, whereas cementite accommodates much more. The iron lattice also reconstructs from the face-centred cubic arrangement of austenite into the body-centred cubic ferrite structure. This is therefore a reconstructive, diffusion-controlled transformation rather than a simple shape change of the existing lattice.
The cooperative character matters. Ferrite formation rejects carbon into nearby austenite, raising the local carbon concentration and helping cementite form beside it. Cementite formation, in turn, supplies conditions that permit adjacent ferrite to grow. The resulting colonies contain lamellae whose spacing depends strongly on transformation temperature. Higher transformation temperatures generally produce coarser pearlite; lower temperatures produce finer pearlite because the available diffusion distance is shorter. Cooling rate changes not only the start temperature but also the spacing, fraction, and morphology of the product.
For hypoeutectoid steels, proeutectoid ferrite forms before the remaining austenite reaches the eutectoid composition. It grows preferentially along prior-austenite grain boundaries and removes carbon from the untransformed austenite, leaving that austenite progressively richer in carbon. In hypereutectoid steels, proeutectoid cementite forms instead, commonly along austenite grain boundaries, while the remaining austenite becomes less carbon-rich relative to the original alloy before transforming to pearlite. The final structure may therefore contain ferrite plus pearlite, or cementite plus pearlite, rather than pearlite alone.
The terms Ae1, Ae3, and Aecm describe equilibrium boundaries: Ae1 is the eutectoid boundary, Ae3 separates austenite from austenite plus proeutectoid ferrite in suitable compositions, and Aecm marks the corresponding cementite boundary. Heating and cooling critical temperatures need not match. ASM International’s Critical Temperature Ranges (2024) states that, for slow cooling, heating critical temperatures may be approximately 33 °C higher than cooling values. Kinetics and thermal hysteresis are not errors in the phase diagram; they are part of the transformation.
Bainite and the T₀ condition
Bainite occupies the middle ground often obscured by simplified diagrams. Its growth is diffusionless with respect to the iron lattice: iron atoms move in a coordinated displacive manner rather than diffusing individually over long distances. Carbon does not become irrelevant, however. The supersaturated ferrite formed during the initial lattice change must redistribute carbon, commonly into austenite or into carbide, depending on steel composition and transformation conditions. Bainite is consequently neither pearlite with a finer spacing nor martensite formed at a higher temperature.
T₀ temperature The temperature at which austenite and bainitic ferrite of identical composition have equal free energy; below it, the specified bainitic transformation is thermodynamically permitted.
The University of Cambridge, The Bainite Reaction (2024), describes bainite growth as diffusionless with respect to the iron lattice and thermodynamically possible below the T₀ temperature. T₀ is the temperature at which austenite and bainitic ferrite of identical chemical composition have equal free energy. Below T₀, bainitic ferrite of that unchanged composition has lower free energy than austenite, so the displacive step is thermodynamically permitted. Above T₀, the same-composition transformation lacks that driving force.
This condition does not mean that every alloy transforms to bainite as soon as it crosses T₀. Nucleation barriers, carbon partitioning, carbide precipitation, alloying additions, defects, and available time all affect the reaction. The final bainitic structure can include ferrite and carbides, and its appearance depends on whether carbide formation occurs between ferrite plates or is suppressed by composition and processing. Silicon, for example, raises the transformation-temperature range, lowers carbon solubility in austenite, and tends to dissociate iron carbide; such effects change the path and product rather than merely shifting one fixed temperature.
A time-temperature-transformation diagram displays these kinetic limits through C-curves. A continuous-cooling-transformation diagram gives a different answer because the specimen is moving through temperature while transformation proceeds. NIST’s Continuous-Cooling Transformation Characteristics of SAE 1141 Steel (1990) notes that a CCT diagram can estimate hardenability and predict room-temperature microstructure, strength, hardness, machinability, and fatigue properties. That predictive use is why a cooling rate cannot be replaced by a single “bainite temperature.”
Martensite as a displacive athermal transformation

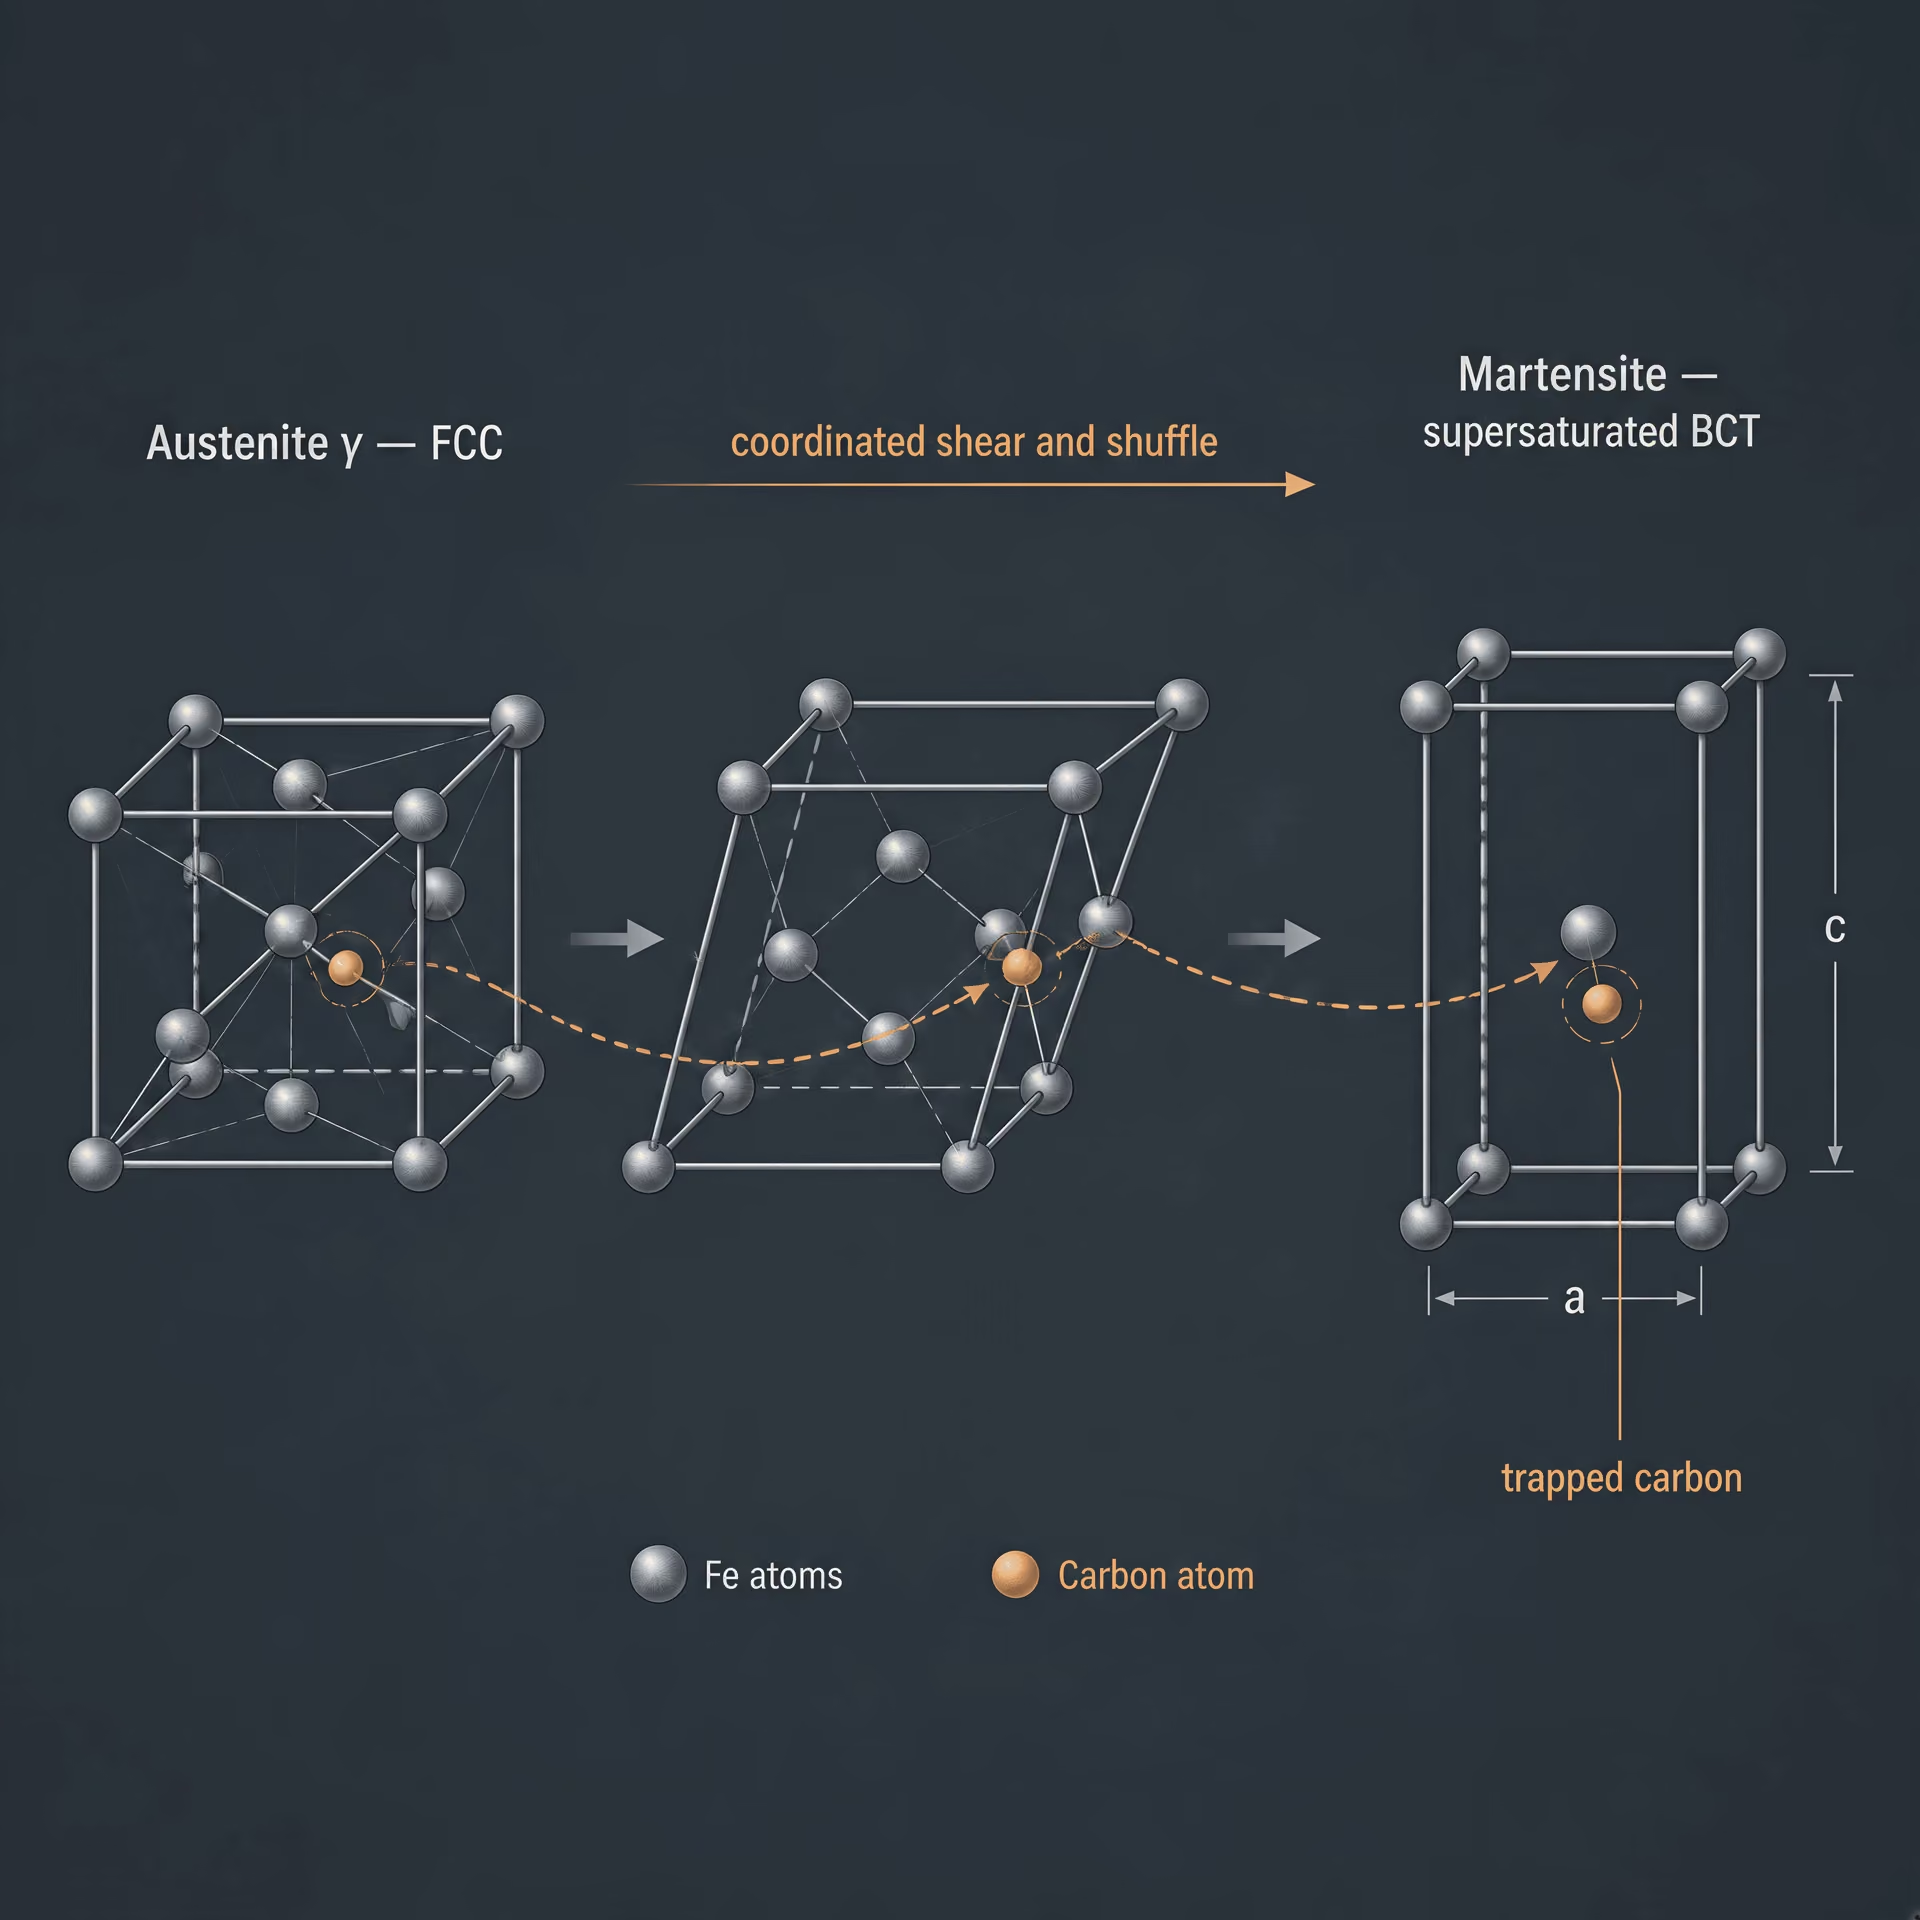
Martensite forms by a coordinated shear and shuffle of the austenite lattice. It is displacive: the iron atoms move over small distances without the long-range chemical diffusion required for pearlite. Carbon is trapped in the transformed lattice, producing supersaturation and distortion. In carbon steel, the resulting martensite is commonly described as a body-centred tetragonal structure, although its tetragonality varies with carbon content and tempering.
Martensite begins at the martensite-start temperature, Ms, when the cooling path supplies sufficient driving force for nucleation. The transformation is called athermal because the amount formed depends mainly on the temperature reached, not on holding time at a fixed temperature. Ms is therefore a transformation temperature, not a guarantee that all austenite has transformed. Further cooling generally creates more martensite, but some austenite may remain at room temperature.[3] Time-Temperature-Transformation Diagram for Steel. University of Cambridge. University of Cambridge phase-trans materials, 2012.
Mf, the martensite-finish temperature, has the same limitation. It marks an extrapolated or measured completion range for the martensitic reaction under specified conditions, not an absolute promise that retained austenite is absent. The Cambridge Time-Temperature-Transformation Diagram for Steel (2012) specifically shows that carbon affects Ms, Mf, and retained-austenite fractions. Alloying elements and prior transformations also shift the result.
Rapid cooling can suppress reconstructive products and permit martensite, but “rapid” is grade-dependent. A steel’s CCT diagram may show pearlite or bainite before Ms at one cooling rate and martensite at another. Thus phase selection follows the whole thermal history: equilibrium temperatures identify possible states, TTT diagrams describe isothermal kinetics, and CCT diagrams describe actual continuous cooling. Temperature alone never tells the full microstructural story.
TTT diagrams: what isothermal transformation data can and cannot show
A time-temperature-transformation (TTT) diagram records what happens when austenite is taken to a selected temperature and held there. It is not a universal table of fixed transformation temperatures. The curves apply to a stated steel composition, austenitizing treatment, prior grain size, and experimental definition of transformation start and finish.
To construct the diagram, a specimen is first heated far enough into the austenite field to produce the required γ structure. It is then quenched rapidly to a chosen holding temperature. The quench must avoid transformation during the temperature drop. At the holding temperature, the specimen is kept isothermally while its changing structure is detected by dilatometry, metallography, magnetic response, or another measurement. The time at which transformation becomes detectable is plotted as a start point; the time at which the selected fraction is judged complete is plotted as a finish point. Repeating the procedure at many temperatures produces the familiar curves.
The result separates transformation products, phases, and temperatures. Austenite is a phase: face-centred cubic γ iron containing carbon and alloying elements. Pearlite and bainite are transformation products, normally consisting of ferrite plus carbide in different arrangements. Martensite is also a transformation product, formed from austenite by a displacive lattice change. In the eutectoid reaction, near 0.8 wt% carbon and 723 °C, austenite changes according to γ → α + Fe₃C, as described by the University of Cambridge (2002). Cambridge identifies ferrite as body-centred cubic and cementite as orthorhombic Fe₃C.
Reading the C-curves
Temperature is on the vertical axis and usually logarithmic time on the horizontal axis. A steel is austenitized, rapidly cooled to a point on the chart, and then held horizontally. If that horizontal line first intersects a transformation-start curve at 650 °C, the elapsed time to that intersection is the incubation period before detectable transformation. Continued holding carries the structure toward the corresponding finish curve. The region between the two curves represents a mixture of untransformed austenite and transformation product, not a single phase with a precisely defined temperature.
The curves commonly bend toward short times at an intermediate temperature, forming a “nose.” Transformation is fastest near this nose because the driving force is substantial while atomic movement remains sufficiently rapid. At higher temperatures, the small driving force slows nucleation; at lower temperatures, reduced diffusion slows the growth process. The nose therefore indicates a time-temperature condition, not a single critical temperature.
A horizontal hold above the relevant range may produce coarse pearlite; a lower hold may produce finer pearlite or bainite, depending on composition and the diagram. The exact boundaries vary with carbon, manganese, chromium, molybdenum, silicon, prior austenite grain size, and austenitizing practice. Silicon, for example, raises the transformation-temperature range, lowers carbon solubility in austenite, and tends to dissociate iron carbide. Even heating and cooling critical temperatures need not coincide: ASM International (2024) reports that, under slow cooling, heating critical temperatures may be approximately 33 °C higher than cooling values.
A TTT curve cannot be transferred directly to a component that cools continuously. A furnace, oil bath, weld, or thick section follows a sloped temperature-time path rather than a horizontal hold. During that path, the material may pass through temperatures where transformation starts, but the available time changes continuously. A continuous-cooling-transformation (CCT) diagram is the appropriate tool for that problem. The NIST (1990) study of SAE 1141 steel uses CCT data to estimate hardenability and to predict room-temperature microstructure, strength, hardness, machinability, and fatigue properties. A TTT diagram can still provide guidance, but applying it to continuous cooling requires qualification, often through calculated cooling curves or experimentally determined CCT data.
Reconstructive and displacive transformation regions
The separate C-curves on many steel diagrams reflect different mechanisms rather than merely different names for the same event. Reconstructive transformations require atoms to cross interfaces and rearrange through processes involving diffusion. Pearlite is the standard example: ferrite and cementite form as carbon partitions while the iron lattice changes from austenitic to ferritic regions. Proeutectoid ferrite or proeutectoid cementite also belongs to this diffusion-controlled family when it forms before the eutectoid reaction.
Bainite occupies a different region. Cambridge’s The Bainite Reaction (2024) states that bainite growth is diffusionless with respect to the iron lattice and is thermodynamically possible below the T₀ temperature, where bainite of the same composition has lower free energy than austenite. The transformation therefore combines a displacive change in the iron lattice with carbon redistribution or precipitation processes that determine the final bainitic structure. It should not be treated as simply “fine pearlite.”
Martensite forms when austenite is cooled sufficiently rapidly to suppress reconstructive transformations. Its lattice changes by coordinated displacement, with essentially no long-range diffusion during formation. The martensite region is consequently represented by temperatures rather than ordinary time-dependent C-curves.
Ms, Mf, and retained austenite
Ms, the martensite-start temperature, is reached when cooling austenite allows martensite to begin forming. The transformation is athermal over the relevant range: the amount formed depends mainly on the temperature reached, not on holding time at a fixed temperature. Mf, the martensite-finish temperature, is the nominal temperature at which the defined martensitic transformation is complete.
Mf may lie below room temperature. In that case, cooling to room temperature leaves some austenite untransformed. This is retained austenite, not a separate equilibrium phase selected by a simple temperature lookup. It is a consequence of composition and the cooling path, and its amount can change during subsequent tempering, service, or deformation.
Carbon has a strong effect on all three quantities. The University of Cambridge TTT material (2012) shows that carbon affects Ms, Mf, and the retained-austenite fraction: increasing carbon generally depresses Ms and Mf and increases the fraction of austenite remaining after a given cooling treatment. Alloying elements and prior processing also alter the result. Thus a line marked Ms on one diagram belongs to that steel and its test conditions; it cannot be copied uncritically onto another grade or component.
CCT diagrams and the reality of industrial cooling paths
Continuous cooling through transformation ranges
A time-temperature-transformation (TTT) diagram describes what happens when austenite is held at a selected temperature. That condition is useful for studying isothermal reactions, but it is not the usual thermal history of a steel component. Forgings leave the die and lose heat continuously. Rolled products cool through a changing temperature field. Normalized and annealed steels pass through transformation ranges during furnace or air cooling, while quenched parts often cross those ranges rapidly before reaching the martensite-start temperature, Ms.

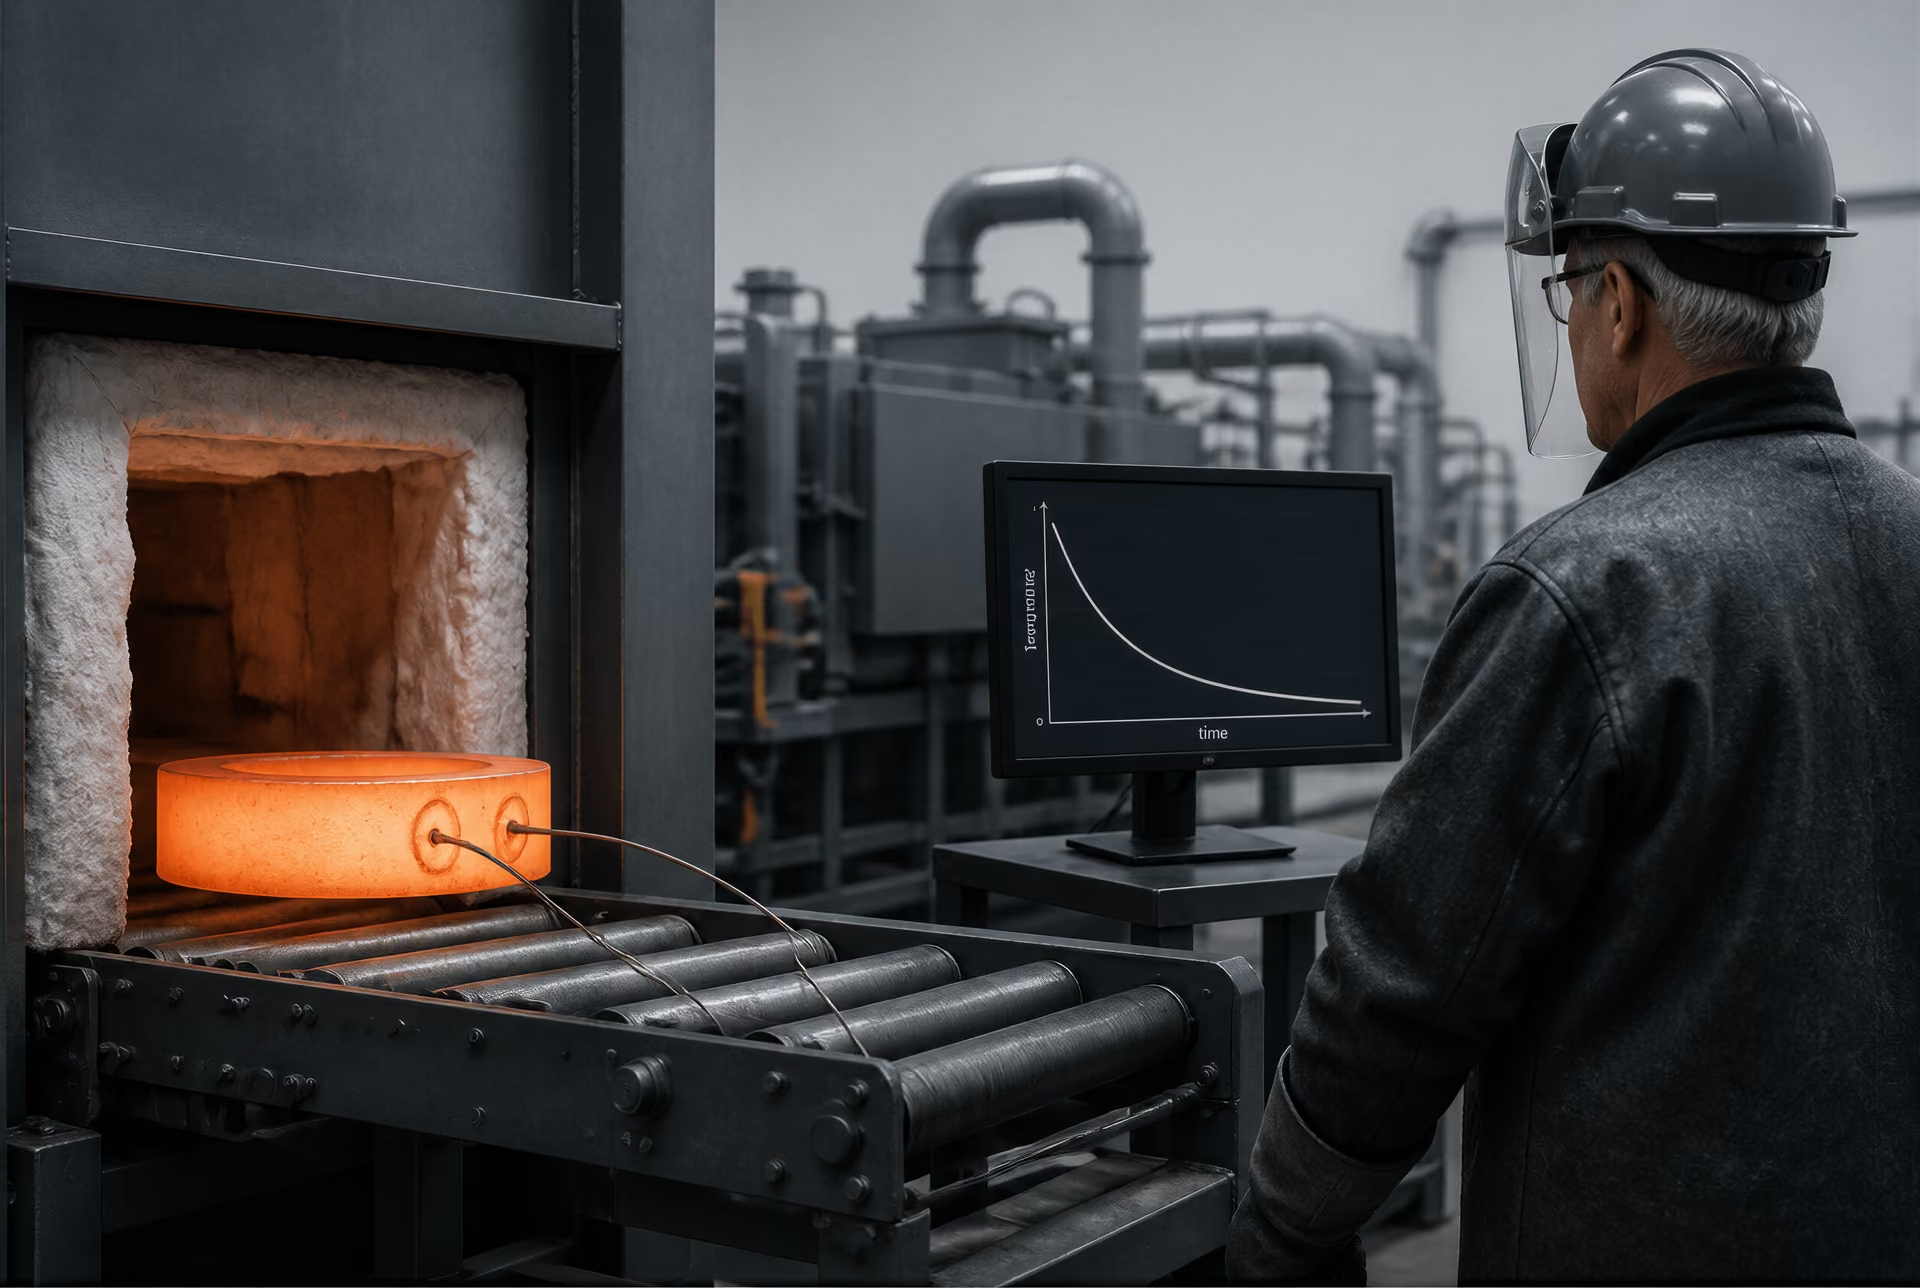
A continuous-cooling-transformation (CCT) diagram is therefore often the more practical map. Its transformation-start and transformation-finish boundaries are plotted against continuously falling temperature. A cooling curve drawn over the diagram shows when, and for how long, austenite occupies the temperature range in which a particular product can form. The curve may enter a ferrite-start region, continue into pearlite formation, pass through bainite, and finally cross Ms so that the remaining austenite changes to martensite. The final structure can consequently be a mixture rather than a single named phase or transformation product.
The distinction matters because ferrite, pearlite, bainite, and martensite do not form by the same mechanism. Proeutectoid ferrite or cementite can form before the eutectoid reaction in hypoeutectoid or hypereutectoid steels. Near the eutectoid composition, approximately 0.8 wt% carbon and 723 °C, austenite undergoes γ → α + Fe₃C, according to the University of Cambridge’s Materials Science & Metallurgy material (2002). Here α is ferrite and Fe₃C is cementite. Cambridge’s Interpretation of the Microstructure of Steels (2008) identifies austenite as face-centred cubic, ferrite as body-centred cubic, and cementite as orthorhombic Fe₃C.
At lower temperatures, bainite may form by a transformation that is diffusionless with respect to the iron lattice, although carbon redistribution remains important to the reaction and its products. Cambridge’s The Bainite Reaction (2024) states that bainite growth is thermodynamically possible below the T₀ temperature, where bainite has lower free energy than austenite of identical composition. If cooling is sufficiently rapid, diffusion-controlled products can be bypassed. The austenite lattice then changes displacively to martensite, beginning at Ms; martensite formation is athermal, so the amount formed depends mainly on how far the temperature falls below Ms rather than on holding time at one temperature.
A CCT curve is not a universal property of “steel” either. Austenitizing temperature, hold time, prior ferrite-pearlite or bainitic structure, grain size, alloy content, and cooling medium all affect the result. Silicon, for example, raises the transformation-temperature range, lowers carbon solubility in austenite, and tends to dissociate iron carbide. Even critical temperatures measured on heating and cooling need not coincide: ASM International’s Critical Temperature Ranges (2024) reports that, under slow cooling, heating critical temperatures may be approximately 33 °C higher than cooling values.
The SAE 1141 example
The National Institute of Standards and Technology report Continuous-Cooling Transformation Characteristics of SAE 1141 Steel (1990) provides a useful applied example. SAE 1141 is a resulfurized medium-carbon steel, commonly designated with the SAE/AISI 1141 grade designation. Its sulfur addition improves free-machining behaviour, but the grade still responds to the full interaction among carbon content, austenite condition, cooling rate, and section geometry.
In the NIST work, CCT data are used to connect austenite cooling paths with the room-temperature structure rather than assigning one transformation temperature to the grade. A relatively slow path can intersect ferrite and pearlite regions before reaching lower temperatures. A faster path can suppress some or all of those reactions, enter a bainite region, or avoid diffusional transformation until it crosses Ms and forms martensite. If the cooling curve intersects more than one start region, the resulting steel may contain proeutectoid ferrite plus pearlite, pearlite plus bainite, bainite plus martensite, or several products together. Austenite that remains untransformed when cooling stops can persist as retained austenite.
That last fraction is not a minor detail. Cambridge’s Time-Temperature-Transformation Diagram for Steel (2012) specifically identifies carbon as affecting Ms, martensite-finish, Mf, and the retained-austenite fraction. If the steel is cooled only to a temperature above Mf, some austenite may remain. It can later transform during service, machining, or subsequent heat treatment, changing dimensions and stresses.
NIST’s SAE 1141 study makes the practical point directly: a steel CCT diagram can be used to estimate hardenability and predict room-temperature microstructure, strength, hardness, machinability, and fatigue properties. Those predictions are estimates, not substitutes for checking the actual thermal cycle and section. A surface cooling curve may pass well to the left of the transformation boundaries while the centre cools more slowly and forms ferrite and pearlite. The same part can therefore have a hard martensitic case and a softer mixed core.
Hardenability, section size, and property prediction
Hardenability is frequently confused with hardness. They are different measurements. Hardness describes resistance to indentation or deformation in a particular condition. Hardenability describes the ability of a steel to form martensite, and the depth to which it can do so, under a specified austenitizing treatment and cooling condition. A steel with high hardenability is not assigned one universal hardness value. Its hardness still depends on carbon content, martensite fraction, tempering, and the local cooling rate.
Section size changes that cooling rate. A thin bar may cool quickly enough throughout its cross-section to bypass ferrite and pearlite. In a thick forging, heat stored at the centre slows the cooling curve, allowing the curve to enter transformation-start regions that the surface avoids. The centre may then contain bainite or pearlite where the surface contains martensite. This thermal gradient also creates differences in volume change and transformation stress, which can contribute to distortion, quench cracking, and residual stress.
CCT interpretation must therefore begin with the actual process: austenitizing temperature and time, furnace or die contact, transfer delay, cooling medium, agitation, part orientation, and local section thickness. The predicted products then provide a route to properties. Ferrite and coarse pearlite generally reduce strength and hardness while improving machinability relative to untempered martensite; bainite occupies an intermediate and highly condition-dependent position; martensite raises hardness and strength but can reduce toughness unless tempered. Mixtures and gradients also affect fatigue, because local hardness, residual stress, inclusions, and retained austenite alter crack initiation and growth. A temperature lookup cannot capture those effects. A cooling path can.
Why transformation temperatures shift between steels and processes
A transformation temperature is not a universal lookup value for “steel.” It identifies a condition under which a particular phase change becomes possible or detectable for a specified composition and thermal path. The result also depends on whether the diagram describes equilibrium, an isothermal hold, or continuous cooling. Pearlite, bainite, martensite, proeutectoid ferrite, and proeutectoid cementite are different transformation products, not interchangeable names for a single temperature.
Carbon content and alloy chemistry
Carbon changes both the equilibrium boundaries and the products formed during cooling. In the iron–carbon system, the eutectoid reaction occurs at approximately 0.8 wt% carbon and 723 °C:
The University of Cambridge’s Materials Science & Metallurgy (2002) gives this reaction for austenite transforming into ferrite and cementite. Austenite is face-centred cubic, ferrite is body-centred cubic, and cementite is orthorhombic Fe₃C, as described in Cambridge’s Interpretation of the Microstructure of Steels (2008). Changing carbon content moves the eutectoid composition and temperature and changes which phase appears before the eutectoid reaction. Hypoeutectoid steels can form proeutectoid ferrite; hypereutectoid steels can form proeutectoid cementite.
Carbon also changes the temperature at which martensite begins, Ms, and the temperature at which martensitic transformation is substantially completed, Mf. The Cambridge Time-Temperature-Transformation Diagram for Steel (2012) specifically identifies carbon as affecting Ms, Mf, and the fraction of retained austenite. Increasing carbon generally depresses Ms and Mf. If Mf falls below room temperature, some austenite can remain untransformed. This retained austenite is not evidence that the steel missed a single fixed “hardening temperature”; it reflects the composition and the cooling endpoint.
The mechanism matters. Pearlite and proeutectoid products require carbon redistribution and are diffusion-controlled. Martensite forms by a rapid displacive change, allowing the iron lattice to transform without the long-range carbon diffusion required for cementite formation. Bainite occupies an intermediate description: Cambridge’s The Bainite Reaction (2024) states that its growth is diffusionless with respect to the iron lattice and thermodynamically possible below the T₀ temperature, where bainite of the same composition has lower free energy than austenite.
Alloying additions can shift these relationships, but their effects should not be treated as identical. Silicon provides a documented example. ASM International states that silicon raises the transformation-temperature range, lowers carbon solubility in austenite, and tends to dissociate iron carbide. Consequently, silicon-bearing steels cannot be interpreted from an unmodified plain-carbon iron–carbon diagram. That does not justify assigning one correction to every alloying element: each element changes phase stability, diffusion, carbide chemistry, or a combination of these.
Heating and cooling hysteresis
The temperature recorded during heating need not equal the temperature recorded during cooling. On heating, ferrite and cementite must dissolve and austenite must nucleate and grow; this requires thermal activation and time. On cooling, austenite decomposes through a different nucleation and growth process. The transformation therefore displays hysteresis, even when the furnace changes temperature slowly.
ASM International’s Critical Temperature Ranges (2024) states that, under slow-cooling conditions, heating critical temperatures may be approximately 33 °C higher than cooling values. This is a quantified source claim, not a universal allowance for every furnace cycle or alloy. Faster heating can increase the apparent overshoot because diffusion and nucleation lag behind the measured temperature. A rapid quench can suppress pearlite and bainite long enough for martensite to form, while an isothermal hold can produce a transformation at a temperature that would not correspond to the start point on a continuous-cooling diagram.
This distinction separates equilibrium temperatures such as Ae1, Ae3, and Aecm from practical Ac and Ar temperatures measured during heating and cooling. A TTT diagram describes transformation during an isothermal hold after austenitizing. A CCT diagram follows a continuously changing temperature. The NIST Continuous-Cooling Transformation Characteristics of SAE 1141 Steel (1990) uses CCT data to estimate hardenability and predict room-temperature microstructure, strength, hardness, machinability, and fatigue properties. A CCT curve is therefore a process map, not a replacement for phase-equilibrium data.
Prior austenite grain size, time, and thermal gradients
Austenitizing time changes more than the thermometer reading suggests. Holding long enough can dissolve carbides, homogenize carbon, and allow austenite grains to grow. Insufficient time may leave undissolved carbide or carbon-rich and carbon-lean regions, so different parts of the same component begin cooling with different transformation tendencies. Excessive time commonly produces coarser prior austenite grains, reducing the total grain-boundary area available for nucleation and often delaying diffusional transformations.
Prior austenite grain size consequently alters kinetics rather than creating a new equilibrium composition. Fine grains provide more nucleation sites and can promote earlier ferrite or pearlite formation during cooling. Coarse grains can increase hardenability by delaying those boundary-nucleated products, allowing a greater fraction of austenite to reach bainitic or martensitic conditions. The precise shift depends on carbon, alloy chemistry, grain-boundary condition, and cooling rate.
Real components rarely follow the furnace schedule uniformly. A thick section loses heat from its surface while its core remains hot, producing different cooling rates through the section. Furnace temperature uniformity, load arrangement, contact with fixtures, and surface oxidation further affect the actual thermal history. The surface may cross a pearlite or bainite region while the core is still above it; later, the core may transform under a slower cooling rate than the surface. Thus one nominal heat treatment can produce ferrite, pearlite, bainite, martensite, and retained austenite in different locations. Temperature matters, but the path taken through temperature determines which transformation product appears.
Reading standards, grade designations, and transformation terminology
SAE 1141 and the limits of grade-specific diagrams
A transformation diagram is a record for a composition and a defined thermal path, not a universal temperature table. A CCT diagram identified as SAE 1141 applies to the chemistry, austenitizing treatment, specimen size, and test method used to produce that diagram. It should not be relabeled “the carbon-steel diagram,” still less applied without qualification to low-alloy steel, stainless steel, or tool steel.
The distinction matters because alloying elements alter phase stability, diffusion rates, carbide formation, and transformation kinetics. Carbon changes the austenite-to-martensite range and the fraction of retained austenite; the University of Cambridge’s 2012 Time-Temperature-Transformation Diagram for Steel specifically identifies effects on Ms, Mf, and retained-austenite fractions. Silicon, according to ASM International’s 2024 Critical Temperature Ranges, raises the transformation-temperature range, reduces carbon solubility in austenite, and tends to dissociate iron carbide. Nickel, chromium, molybdenum, and manganese can shift transformation curves and delay diffusional products. A stainless grade may also contain ferrite, austenite, or intermetallic phase fields absent from a plain-carbon diagram, while tool steels may form alloy carbides that change both equilibrium and observed transformation products.
Even the familiar iron-only reference is composition-specific. Cambridge’s 2005 Stainless Steels: Phase Equilibria places face-centred cubic austenite in pure iron at approximately 910–1400 °C and gives a melting temperature of approximately 1539 °C. Those values do not define the critical temperatures of SAE 1141. The NIST 1990 Continuous-Cooling Transformation Characteristics of SAE 1141 Steel shows the proper use of a grade-specific CCT diagram: estimating hardenability and predicting room-temperature microstructure, strength, hardness, machinability, and fatigue properties under stated cooling conditions.
A cited temperature therefore needs its evidence attached. Report the grade designation and standard, composition basis—nominal, heat analysis, or measured composition—plus the prior microstructure, austenitizing temperature and hold time, heating or cooling rate, specimen geometry, diagram type, and measurement method. Dilatometry, differential thermal analysis, electrical-resistance measurement, and metallographic interruption can produce different apparent start and finish temperatures.
Ae, Ac, Ar, Ms, Mf, and Aecm notation
The Ae prefix denotes an equilibrium transformation temperature. Thus Ae1 is the eutectoid boundary under equilibrium conditions, and Ae3 is the upper boundary associated with ferrite formation from austenite in hypoeutectoid steel. Aecm identifies the equilibrium austenite–cementite boundary on the carbon-rich side. The subscript “cm” refers to cementite, Fe₃C.
The approximately eutectoid composition is 0.8 wt% carbon. At about 723 °C, the University of Cambridge’s 2002 Materials Science & Metallurgy material gives the reaction γ → α + Fe₃C. Here γ is austenite and α is ferrite. That equation describes phases at equilibrium; it does not state that every steel cooled through 723 °C will form pearlite.
The Ac prefix refers to a critical temperature measured during heating, while Ar refers to one measured during cooling. Ac1 and Ar1 can differ because nucleation, dissolution, diffusion, and thermal lag depend on rate and prior structure. ASM International reports that, under slow cooling, heating critical temperatures may be approximately 33 °C higher than cooling values. Ms is the martensite-start temperature during cooling, and Mf is the martensite-finish temperature. Martensite is a displacive, largely diffusionless product; insufficient cooling below Mf can leave retained austenite. TTT diagrams commonly mark Ms, whereas CCT diagrams show how continuous cooling intersects pearlite, bainite, and martensite regions.
Phases, constituents, and microstructural reporting
A phase is a physically and chemically distinct part of a material with a defined structure and composition range. Cambridge’s 2008 Interpretation of the Microstructure of Steels identifies austenite as face-centred cubic, ferrite as body-centred cubic, and cementite as orthorhombic Fe₃C. A phase field on an equilibrium diagram predicts which phases are stable at a composition and temperature. It is not a photograph and does not specify particle size, spacing, morphology, or transformation rate.
A constituent is an observed microstructural product or aggregate. Pearlite is commonly a ferrite–cementite aggregate; bainite contains ferritic regions and carbide arrangements produced by a distinct transformation mechanism; martensite is supersaturated transformed ferrite with a characteristic morphology and carbon state. ASM International treats pearlite, bainite, martensite, proeutectoid ferrite, and proeutectoid cementite as principal austenite-transformation products, under both isothermal and continuous-cooling conditions. Cambridge’s 2024 The Bainite Reaction states that bainite growth is diffusionless with respect to the iron lattice and is thermodynamically possible below T₀, where bainite has lower free energy than austenite of identical composition.
Reports should therefore separate calculated phase fields from measured constituents. State whether the source is an equilibrium Fe–C or Fe–Fe₃C diagram, a TTT diagram, or a CCT diagram, then identify how transformation was detected and how the final structure was examined. A polished-and-etched image, X-ray diffraction result, dilatometric curve, and hardness profile answer different questions. Temperature without that context is an incomplete designation.
From diagram to microstructure: a disciplined interpretation workflow
A transformation diagram is not a temperature lookup table. It is a map for a specified composition, specimen condition, heating or cooling schedule, and experimental method. The disciplined question is therefore not “What phase forms at 700 °C?” but “What material is present, what path did it follow, and what transformation mechanisms had time to operate?”
Start with composition and the intended thermal path
Minimum information for interpreting a transformation diagram
- Composition Record the steel designation and carbon and alloying-element contents.
- Prior condition Record the prior microstructure and grain size if known.
- Geometry Record section thickness and specimen size.
- Austenitizing Record austenitizing temperature and holding time.
- Thermal path Record heating rate, cooling rate, cooling medium, and transfer delay.
- Validation Compare the predicted sequence with microscopy and measured properties.
Begin by recording the steel designation and its chemistry. “Carbon steel” is too broad for a reliable prediction. A plain-carbon eutectoid steel behaves differently from SAE 1141, and both differ from alloy grades containing chromium, molybdenum, nickel, manganese, or silicon. Record the carbon and alloying-element contents, the prior condition, grain size if known, section thickness, austenitizing temperature, holding time, and the heating and cooling rates.
The designation should be checked against the actual heat analysis where decisions depend on the result. Small chemistry changes can shift transformation temperatures and alter the fractions of transformation products. Silicon, for example, raises the transformation-temperature range, lowers carbon solubility in austenite, and tends to dissociate iron carbide. Even the direction of the thermal excursion matters: ASM International reports that, under slow cooling, heating critical temperatures may be approximately 33 °C higher than cooling values.
Next classify the thermal process. An equilibrium calculation assumes extremely slow changes and sufficient time for phases to approach their equilibrium compositions. An isothermal treatment rapidly brings the steel to a selected temperature and holds it there; this is the condition represented by a TTT diagram. A continuous-cooling treatment follows a changing temperature and is represented by a CCT diagram. Furnace cooling, air cooling, oil quenching, and water quenching are continuous paths, not isothermal holds, even if their final temperatures are similar.
The familiar Fe–C diagram supplies useful boundaries, but it does not predict every industrial microstructure. In pure iron, face-centred cubic austenite is stable from approximately 910 to 1400 °C, and pure iron melts at approximately 1539 °C, according to the University of Cambridge’s Stainless Steels: Phase Equilibria (2005). Those figures do not apply unchanged to alloyed steel. At approximately 0.8 wt% carbon and 723 °C, the eutectoid reaction is γ → α + Fe₃C, but a real steel may contain proeutectoid ferrite or cementite before the eutectoid constituent forms.
Trace the path through TTT or CCT data
Select the diagram that matches the process. On a TTT diagram, locate the austenitizing condition, move rapidly to the holding temperature, and then read the start and finish of transformation during the hold. On a CCT diagram, draw or select the actual cooling curve and identify each region it crosses. Do not transfer a TTT start time directly to a CCT treatment; the steel is moving through a range of temperatures while transformation proceeds.
Write the sequence explicitly. A hypoeutectoid steel may first form proeutectoid ferrite from austenite, followed by pearlite. A hypereutectoid steel may form proeutectoid cementite before pearlite. A cooling curve that avoids the pearlite region may enter the bainite range and then cross Ms, the martensite-start temperature. The final structure can consequently contain ferrite, pearlite, bainite, martensite, and retained austenite in different proportions.
These names also describe different kinds of things. Ferrite, austenite, and cementite are phases: the University of Cambridge’s Interpretation of the Microstructure of Steels (2008) identifies them as body-centred cubic ferrite, face-centred cubic austenite, and orthorhombic Fe₃C, respectively. Pearlite and bainite are transformation products with characteristic arrangements of phases, while martensite is a displacive transformation product. A transformation temperature marks a boundary or event, not a guaranteed final constituent.
Mechanism matters. Reconstructive transformations require atomic diffusion and can produce ferrite, pearlite, or cementite when the path supplies time for carbon redistribution. Martensite forms without the long-range chemical diffusion required by those reactions. Bainite has a different combination of lattice change and carbon redistribution; the University of Cambridge’s The Bainite Reaction (2024) states that bainite growth is diffusionless with respect to the iron lattice and is thermodynamically possible below the T₀ temperature.
Martensite is not automatically the last product. If Ms lies below room temperature, or if cooling stops before the austenite is exhausted, retained austenite can remain. The Cambridge TTT material (2012) specifically identifies carbon as affecting Ms, martensite-finish temperature Mf, and retained-austenite fractions. Thus, “quenched steel” may mean a mixed structure rather than 100% martensite.
Validate predictions by microscopy and property testing
Treat the diagram result as a prediction. Confirm it by preparing a representative specimen, polishing and etching it with a method suited to the steel, and examining the structure by optical microscopy, scanning electron microscopy, or another appropriate technique. Metallography can reveal ferrite morphology, pearlite spacing, bainitic sheaves, martensite regions, carbide networks, decarburization, and segregation, although some constituents require careful interpretation because etching contrast is not a direct phase label.
Measure hardness at defined locations and report the scale, load, and sampling plan. Add tensile, impact, fatigue, dimensional, or retained-austenite measurements when the application requires them. Hardness alone cannot distinguish every mixture or establish toughness.
A steel CCT diagram can be used to estimate hardenability and predict room-temperature microstructure, strength, hardness, machinability, and fatigue properties. Limited evidence
The NIST report Continuous-Cooling Transformation Characteristics of SAE 1141 Steel (1990) demonstrates the practical purpose of CCT data: such a diagram can estimate hardenability and predict room-temperature microstructure, strength, hardness, machinability, and fatigue properties. “Predict” remains the operative word. A diagram dataset belongs to a particular composition, grain condition, specimen size, and test procedure. When the consequence of error is significant, trace the thermal path, record the predicted sequence, and compare it with microscopy and measured properties before accepting the transformation model.
References
- [1] Materials Science & Metallurgy. University of Cambridge phase-trans materials, 2002. https://www.phase-trans.msm.cam.ac.uk/2002/MP10-6.pdf
- [2] Continuous-Cooling Transformation Characteristics of SAE 1141 Steel. NIST Interagency Report, 1990. https://nvlpubs.nist.gov/nistpubs/Legacy/IR/nistir3964.pdf
- [3] Time-Temperature-Transformation Diagram for Steel. University of Cambridge phase-trans materials, 2012. https://www.phase-trans.msm.cam.ac.uk/2012/Manna/Part2.pdf