



What Steel Fracture Toughness Measures
Fracture toughness is resistance to crack extension in a specified loading and constraint state. That definition is deliberately narrower than “strength.” A toughness value describes how a cracked body responds when a crack-tip driving force reaches a critical level or when the crack begins to grow. It does not describe every possible failure mode of a steel product.
| Parameter | What it describes | Typical application |
|---|---|---|
| KIC | Critical elastic stress intensity under qualified plane-strain conditions | Linear-elastic fracture assessment |
| JIC | Elastic-plastic crack-driving force at initiation | Fracture with substantial crack-tip plasticity |
| Critical CTOD δ | Crack-tip opening displacement at a specified fracture event | Transition-sensitive steels and welds |
| R-curve | Resistance as stable crack extension proceeds | Ductile tearing and crack-growth stability |
A reported value therefore belongs to a test method, specimen geometry, crack orientation, temperature, loading rate, and validity range. K<sub>IC</sub>, J<sub>IC</sub>, critical CTOD δ, and an R-curve are related fracture parameters, but they are not interchangeable numbers. Converting one to another requires suitable material behavior, geometry, and elastic-plastic assumptions.
Crack resistance is not tensile strength
An uncracked tensile specimen measures resistance to deformation and rupture across a relatively uniform section. Its yield strength indicates the stress at which significant plastic deformation begins; ultimate tensile strength records the maximum nominal tensile stress; elongation indicates deformation capacity after yielding; and hardness provides an indirect measure of resistance to indentation and, in some cases, approximate strength. None of these measurements directly answers whether an existing crack will extend.
Higher yield strength does not automatically indicate higher fracture toughness. Strong evidence
This distinction matters even when comparing steels with familiar designations such as ASTM A36 and ASTM A572 Grade 50. A higher yield strength does not automatically mean higher fracture toughness. Strengthening mechanisms can raise yield strength while reducing the amount of plastic deformation that a constrained crack tip can tolerate, particularly at low temperature. Plate thickness can have a similar effect by increasing crack-tip constraint. The Federal Highway Administration’s 2016 steel-bridge manual describes the practical consequence: a higher-strength or thicker steel may require greater toughness because stress and constraint at the crack tip increase fracture risk.
Tensile ductility is not a substitute either. A steel can show respectable elongation in a smooth bar while a notch, weld defect, lamellar feature, or low-temperature transition condition produces brittle fracture. Hardness testing is further removed from the crack problem; it may help identify heat-treatment variation, but it does not establish K<sub>IC</sub>, J<sub>IC</sub>, or critical CTOD.
Fatigue life answers a different question. Under repeated loading, the cyclic crack-driving parameter is commonly the stress-intensity range ΔK, not a single monotonic fracture-toughness value. NASA-HDBK-5010, Volume 2 (2023), gives the Mode I relation for a centrally cracked plate as:
K = βσ√(πa)
where β accounts for geometry, σ is the applied stress, and a is the crack dimension used by the model. For cyclic loading, ΔK changes with the stress range and crack size. A steel may resist rapid fracture at a particular K while still accumulating slow fatigue crack growth over thousands or millions of cycles.

The crack tip as the controlling region
Core crack-tip terms
- Stress-intensity factor K
- An elastic parameter describing the amplitude of the near-tip stress field.
- J-integral
- An elastic-plastic crack-driving parameter representing energy available for crack extension.
- CTOD δ
- Crack-tip opening displacement associated with deformation near the crack tip.
- R-curve
- A record of fracture resistance as stable crack extension proceeds.
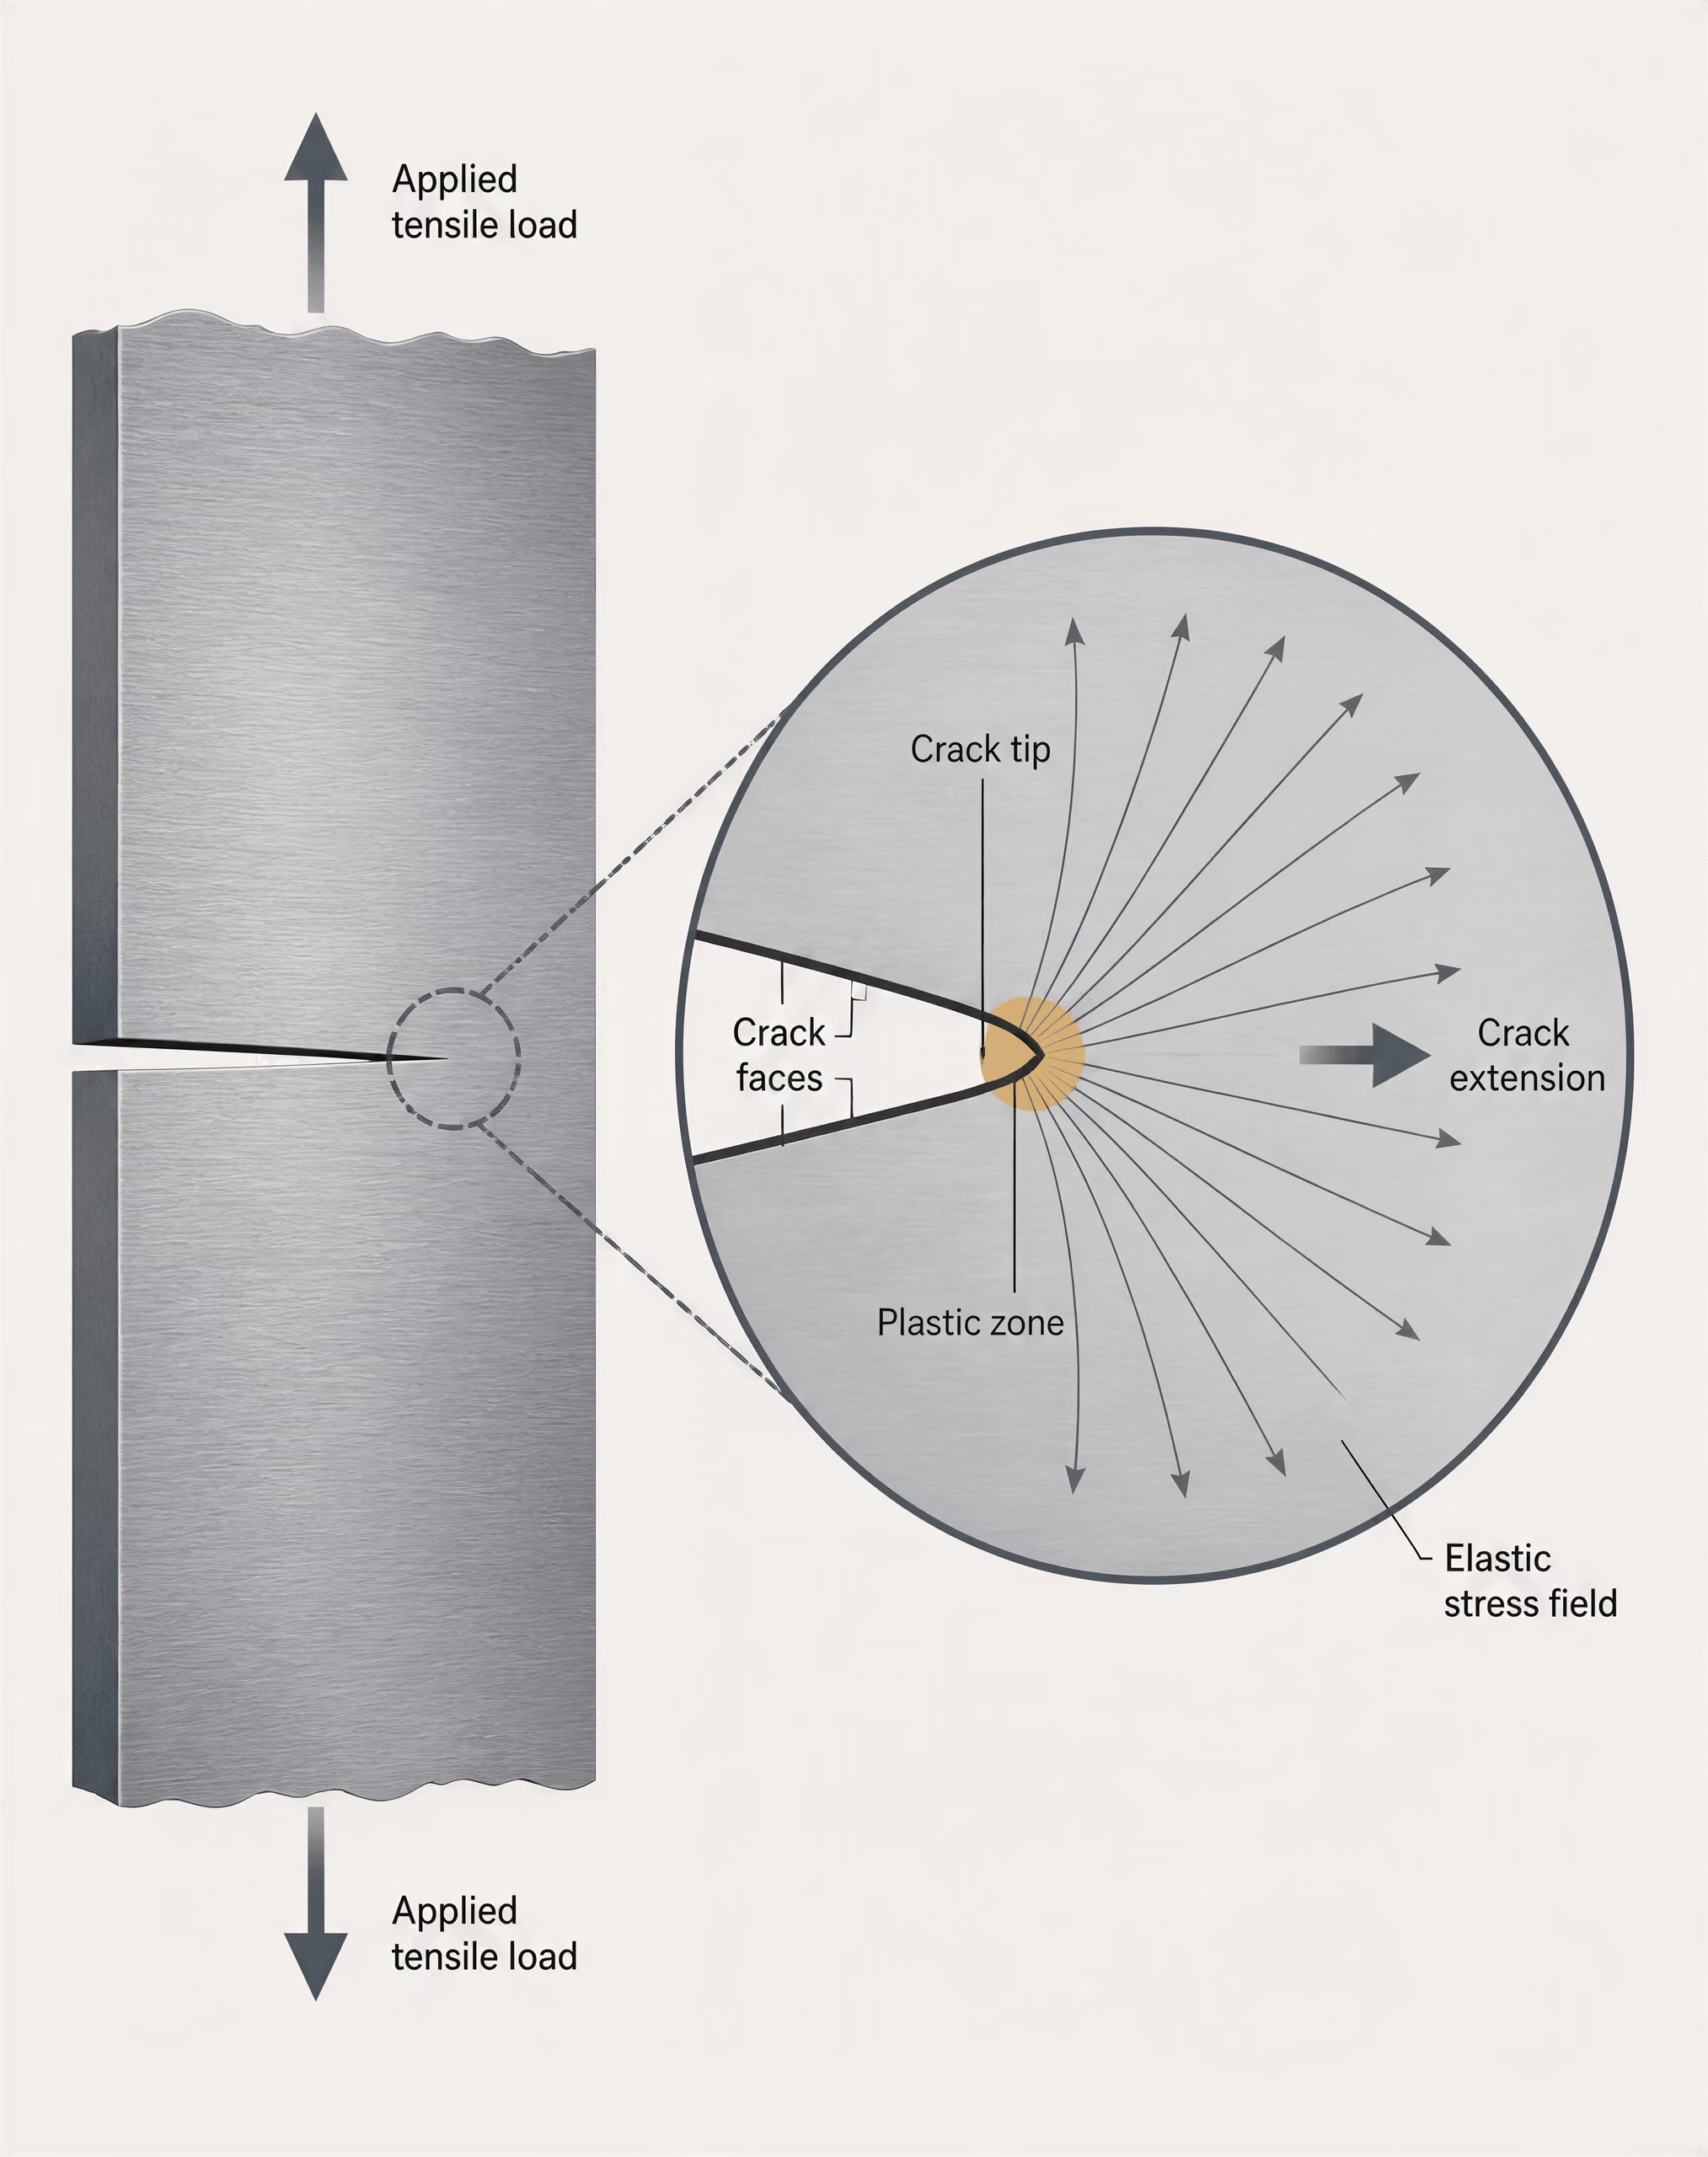
The nominal stress far from a crack can be modest, yet the local stress and strain field at the crack tip can be severe. A sharp crack concentrates the applied load into a small region. A. A. Griffith described crack extension through an energy balance: growth occurs when the reduction in elastic strain energy can pay the energy cost of creating new fracture surfaces. G. R. Irwin later expressed the elastic crack-tip field through the stress-intensity factor, making it possible to relate load, crack length, component geometry, and local crack-tip severity.
For a sufficiently small plastic zone, linear-elastic fracture mechanics treats K as the governing parameter. ASTM E399-24 uses this route to determine K<sub>IC</sub> from fatigue-precracked metallic specimens under predominantly linear-elastic, plane-strain conditions. The specimen must be large enough that crack-tip plasticity remains small relative to its dimensions; otherwise, the measured value may be a conditional result rather than a valid plane-strain toughness.
That limitation explains why a tensile coupon cannot represent a cracked bridge flange, pressure vessel, or welded joint. The real component has a crack size, crack shape, stress gradient, thickness, residual stress state, and constraint level. Its crack may also lie in base metal, weld metal, or a heat-affected zone. ISO 15653:2018 addresses weld fracture toughness using K, CTOD δ, and the experimental equivalent of the J-integral, with fatigue cracks positioned in relevant weld regions.
When crack-tip plasticity is not small or uniform, elastic-plastic methods are required. J measures the energetic driving force in such conditions, while CTOD measures crack-tip opening associated with a specified fracture event. NIST reported in 2008 that elastic-plastic testing accounts for nonuniform crack-tip plasticity and complex stress-strain distributions when predicting unstable crack propagation in steel.
Initiation, stable growth, and unstable fracture
The central engineering question is not simply “What is this steel’s toughness?” It is: given a known crack under a known load, will the crack remain stable, extend stably, or trigger rapid fracture?
Crack initiation is the first extension from the pre-existing crack. After initiation, the material may sustain stable crack growth as plastic deformation and mechanisms such as ductile void formation absorb energy. Resistance can rise with crack extension; this behavior is represented by a J-R curve, CTOD resistance curve, or other R-curve. If the applied crack-driving force overtakes that resistance, unstable fracture can follow.
ASTM E1820 measures Mode I fracture behavior using K, J, and CTOD, either as point values or resistance curves. ISO 12135:2021 likewise specifies quasistatic methods using K, crack-tip opening displacement δ, J, and R-curves for fatigue-precracked homogeneous metallic specimens. ASTM E1290 focuses on critical CTOD values at specified crack-extension events and is particularly relevant to the ductile-to-brittle transition as temperature decreases.
Those results must remain tied to their method. A K<sub>IC</sub> value from ASTM E399-24 should not be inserted into a J-based structural assessment without justification, and a critical CTOD from a weld test under ISO 15653:2018 should not be treated as a universal grade property. Specimen constraint, loading mode, temperature, crack location, loading rate, and the chosen definition of “initiation” all affect the result. The number is meaningful only with that surrounding test information.
The Fracture-Mechanics Framework: Griffith, Irwin, and K
Griffith's energy balance
A steel component does not fracture simply because its nominal stress exceeds a grade’s listed yield or tensile strength. A crack changes the problem: the applied load releases elastic strain energy as the crack extends, while new fracture surfaces consume energy. A. A. Griffith expressed this competition as an energy criterion. Crack extension becomes possible when the energy release rate reaches the material’s critical value :
For an ideal brittle solid, Griffith related primarily to the surface energy required to create two new crack faces. Real steels are not ideal brittle solids. Plastic deformation, microvoid formation, cleavage, crack bridging, residual stress, and other processes absorb additional energy near the crack tip. The measured resistance therefore reflects both the material and the conditions under which the crack is tested.
This energy view is the foundation of fracture mechanics because it links load, crack dimensions, and resistance to crack extension. It also explains why strength alone cannot describe a cracked structure. A high-strength steel may carry a high nominal stress, yet a sufficiently large flaw under severe constraint can produce fracture before general yielding. Conversely, a lower-strength steel with greater crack-growth resistance may tolerate the same flaw more safely.
The relevant resistance is not a universal grade constant. Temperature, loading rate, thickness, stress state, crack orientation, weld location, and the event selected as failure can all change the measured value. Stable tearing and unstable cleavage are different outcomes, even when they occur in specimens made from the same heat of steel.
Irwin's crack-tip stress field
G. R. Irwin converted Griffith’s energy concept into a practical description of the elastic field surrounding a crack tip. In linear-elastic fracture mechanics, the stresses near the tip rise approximately with the inverse square root of the distance from the tip:
Here, describes the angular distribution of stress, while sets its amplitude. The mathematical singularity does not continue to infinite stress in a real steel: a plastic zone, however small, forms at the tip. LEFM remains useful when that zone is small compared with the specimen dimensions, crack size, and remaining ligament, so that the surrounding field is predominantly elastic.
| Mode | Crack-tip motion | Typical description |
|---|---|---|
| Mode I | Opening | Tensile loading normal to the crack plane |
| Mode II | In-plane sliding | Shear displacement within the crack plane |
| Mode III | Antiplane tearing | Shear displacement out of the crack plane |
Mode I is the principal case in steel fracture assessment. It opens the crack faces by applying tensile loading normal to the crack plane. Mode II produces in-plane sliding, and Mode III produces antiplane tearing; real structures can experience mixed-mode loading, but many design and test procedures begin with Mode I because it commonly governs tensile fracture.
Irwin also connected the crack-tip field to energy release. For a linear-elastic material,
where under plane stress and under plane strain. This relation shows why a critical stress-intensity value can represent fracture resistance only when the elastic assumptions and constraint conditions are appropriate. ASTM E399-24 determines under predominantly linear-elastic, plane-strain conditions using fatigue-precracked metallic specimens. Its size and validity requirements are intended to keep crack-tip plasticity small enough for to be a meaningful plane-strain fracture-toughness value.
When plasticity is not small, alone may not describe the crack-tip condition. ISO 12135:2021 includes , crack-tip opening displacement , , and resistance curves for quasistatic testing of homogeneous metallic specimens. ASTM E1820 likewise uses , , and CTOD, either as point values or as curves showing resistance during stable crack extension. These quantities are related through fracture mechanics, but , , CTOD, and an R-curve are not interchangeable labels.
Stress intensity, geometry, and crack size
NASA-HDBK-5010, Volume 2, gives the Mode I stress-intensity factor for a centrally cracked plate as
where is the applied nominal stress, is the crack dimension used by the stated geometry convention, and is a geometry correction factor. For a central through-crack, commonly denotes the half-crack length; other configurations define the crack dimension differently. The equation makes the interaction direct: doubling stress doubles , while quadrupling crack size doubles it.
is not a material constant and does not describe steel grade, hardness, or toughness. It accounts for finite width, edge effects, crack shape, specimen configuration, and loading arrangement. A compact-tension specimen, a single-edge-bend specimen, and a wide plate containing a central crack can have the same steel, stress, and nominal crack length yet produce different stress-intensity factors because their geometry corrections differ. The AFGROW damage-tolerance handbook describes this same principle: elastic crack-tip response depends on loading, geometry, and crack dimensions.
For cyclic loading, NASA identifies , the range in stress intensity during a load cycle, as the controlling parameter in fatigue crack growth under the applicable LEFM model. Fracture may therefore occur after a crack has grown under repeated loads even though the initial stress was below the final static-fracture level.
The condition is meaningful only when the specimen and loading satisfy the relevant standard’s requirements. The FHWA steel-bridge manual describes combinations of crack size and stress below as stable within that model, not as universally safe. Thick sections and high-strength steels can develop greater crack-tip constraint, reducing the ability of plasticity to blunt the crack. Weld metal, fusion boundaries, and heat-affected zones require separate attention; ISO 15653:2018 covers weld fracture toughness using , CTOD , and the experimental equivalent of the -integral. The reported value must therefore be read with its method, specimen geometry, crack location, temperature, loading rate, and validity limits.
When KIC and LEFM Are Valid for Steel
ASTM E399-24 and plane-strain toughness
ASTM E399-24 provides a specific route to measuring plane-strain fracture toughness, , in metallic materials. It uses fatigue-precracked specimens loaded predominantly in Mode I under conditions where the response remains mainly linear elastic. The result is not simply “the toughness of the steel.” It is a qualified material parameter only when the specimen, crack, temperature, loading rate, and validity requirements support the plane-strain model.
The distinction matters because describes the stress intensity at unstable crack extension under severe crack-tip constraint. It does not measure yield strength, hardness, ductility, or fatigue resistance. A steel can have high tensile strength and still show poor low-temperature crack resistance. Conversely, a steel with moderate strength may tolerate a larger crack if its microstructure and test condition produce greater fracture resistance.
The foundation is A. A. Griffith’s energy criterion: a crack extends when the elastic energy released by a small increment of crack growth is sufficient to create the new fracture surfaces. G. R. Irwin expressed the near-tip elastic stress field through the stress-intensity factor, . For a centrally cracked plate, NASA-HDBK-5010, Volume 2, writes the Mode I relation as
where accounts for geometry, is the applied stress, and is the crack dimension used by the selected convention. The equation shows why a toughness value cannot be separated from crack size, stress, and geometry. AFGROW likewise treats crack-tip response in the elastic regime as a function of loading, geometry, and crack dimensions.
A valid result is therefore a limiting fracture parameter, not a universal grade constant. The result applies to a defined Mode I, plane-strain condition. It should not be substituted directly for , CTOD, or an R-curve value. ASTM E1820 can assess Mode I toughness through , , and CTOD, including point values and resistance curves, while ISO 12135:2021 covers quasistatic methods using , crack-tip opening displacement , , and resistance curves. Those methods address situations in which elastic-plastic crack-tip behavior is significant.

Small-scale yielding and plastic-zone limits
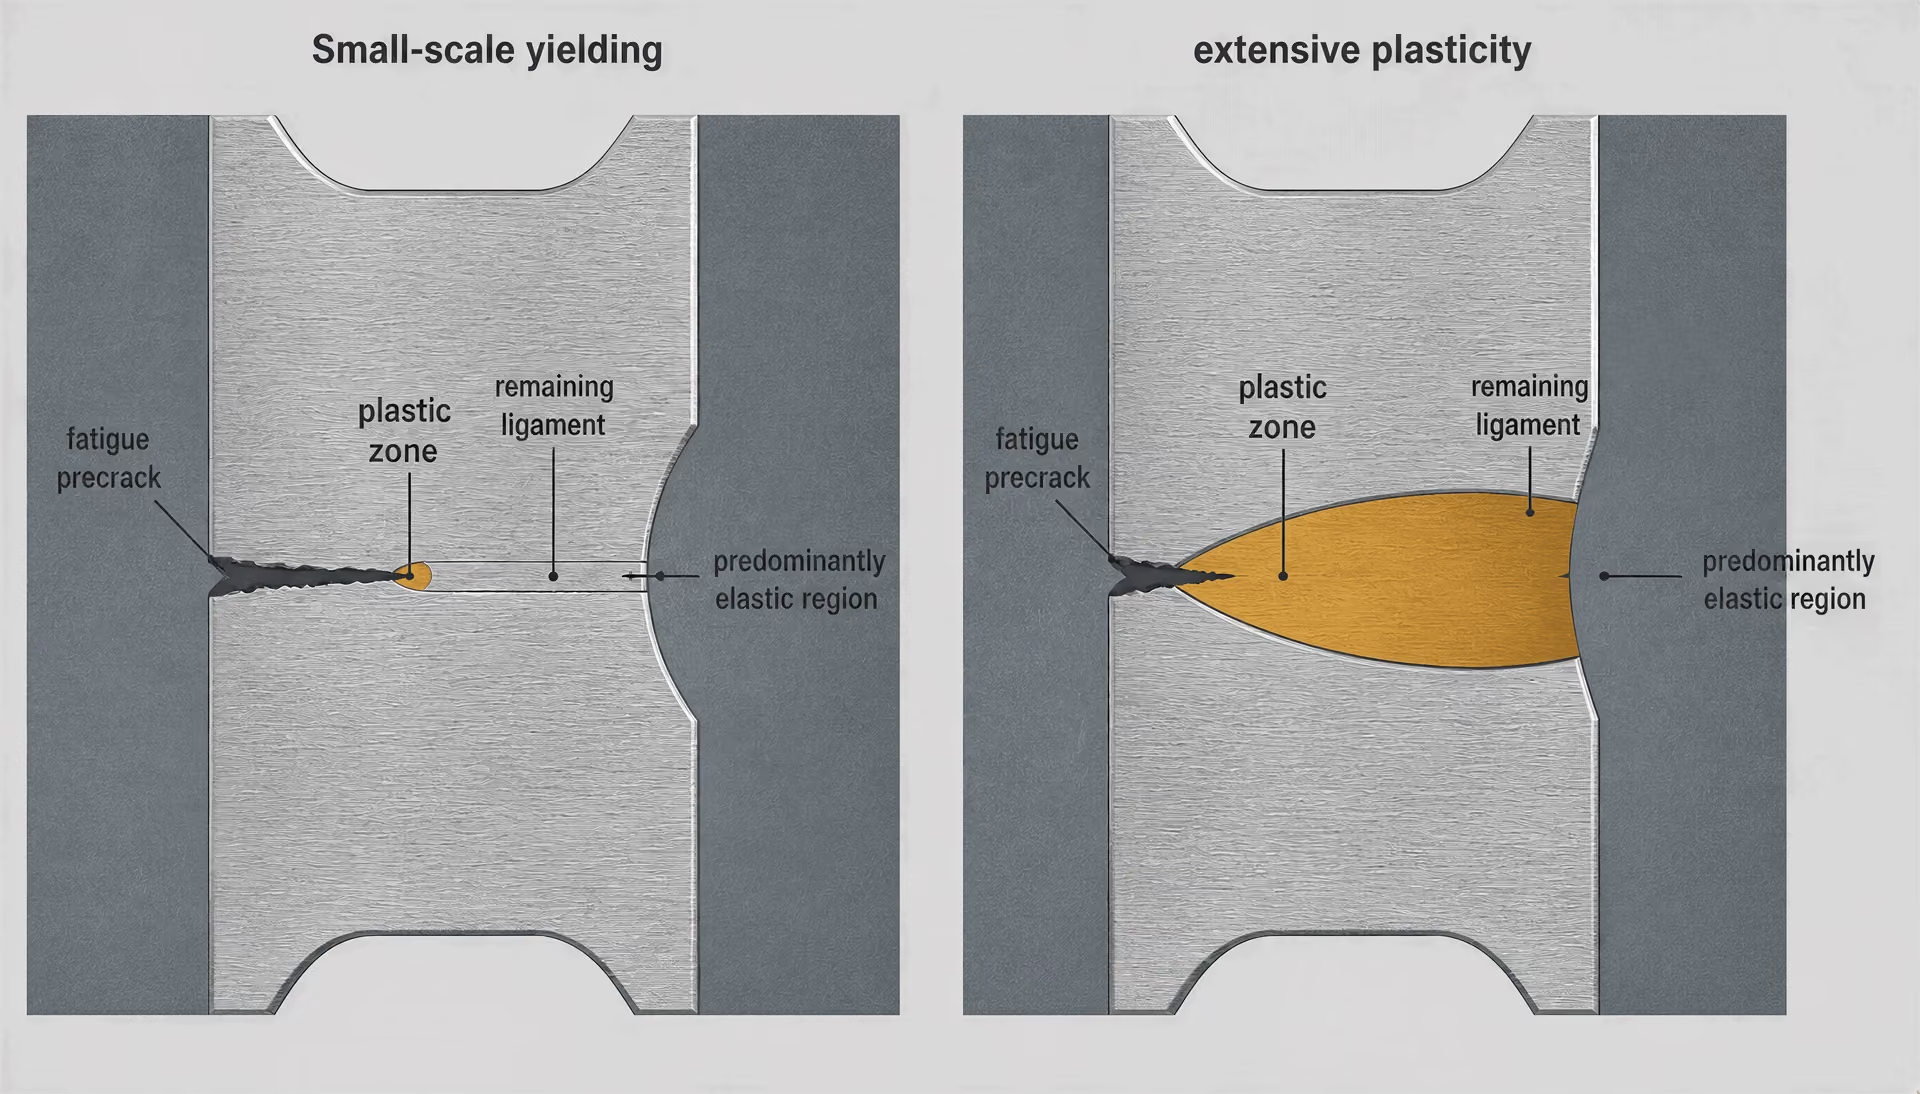
LEFM assumes that most of the specimen remains elastic and that any plasticity is confined to a small region immediately ahead of the crack. This region, commonly called the crack-tip plastic zone, must be small compared with the specimen thickness, ligament, crack length, and other dimensions that control the test. If it becomes too large, the measured load no longer represents a predominantly elastic crack-tip field. The result may still describe the tested geometry, but it is not a qualified plane-strain .
The physical reason is straightforward. Plastic deformation blunts the crack tip, redistributes stress, and relaxes the singular elastic field predicted by Irwin’s solution. Under small-scale yielding, that altered region is sufficiently limited that still characterizes the surrounding field. Once the plastic zone occupies a substantial part of the ligament or thickness, a single elastic parameter cannot describe the crack-tip state accurately.
Higher applied stress increases the plastic zone. So does lower yield strength. A thin specimen also permits more through-thickness deformation and plastic relaxation than a thick one. These effects can produce an apparently higher fracture load, even though the result reflects reduced constraint rather than a higher intrinsic resistance to crack extension. Calling such a result without meeting the standard’s validity requirements overstates what the test proves.
When elastic-plastic behavior controls the event, , CTOD, or a resistance curve is usually more informative. ASTM E1290 focuses on critical CTOD values at specified crack-extension events and is particularly useful for steels showing ductile-to-brittle transition as temperature falls. ISO 15653:2018 applies related fracture-toughness methods to welds, including fatigue cracks located in weld metal and heat-affected zones. That location can matter as much as the nominal plate designation.
Constraint, thickness, and specimen validity
Constraint The degree to which surrounding material restrains plastic deformation at a crack tip; greater constraint generally promotes triaxial stress and can reduce apparent fracture tolerance.
Constraint describes how strongly the surrounding material prevents plastic flow at the crack tip. Plane strain, commonly promoted by greater thickness and a sufficiently large remaining ligament, imposes more restraint than plane stress. Greater restraint suppresses plastic relaxation and can reduce the apparent fracture tolerance measured during the test. The same steel may therefore produce different toughness values in thin and thick sections, or in specimens with different crack orientations and ligament dimensions.
Thickness is not a decorative test detail. It changes the stress state through the section and affects whether the crack tip experiences the triaxial constraint needed for a plane-strain interpretation. Specimen geometry also matters: compact-tension and single-edge-bend specimens can generate different combinations of crack length, ligament, bending, and constraint. A result from one geometry should not be transferred to a structural detail without checking the corresponding crack-tip conditions.
The FHWA steel-bridge guidance frames the design implication in direct terms: combinations of crack size and stress below are stable within the applicable fracture-mechanics model, whereas higher-strength and thicker steels may require greater toughness because stress and crack-tip constraint increase fracture risk. It does not establish one grade-specific numerical limit that applies to every bridge detail. Engineers must evaluate the actual flaw size, stress range, geometry, thickness, steel strength, temperature, and inspection assumptions.
A reported value should therefore be labeled by its status. A qualified satisfies the relevant plane-strain and specimen-validity requirements. A conditional value, often identified as , is a measured fracture result that has not demonstrated those requirements. A geometry-dependent elastic-plastic value may be useful for that specimen and loading arrangement, but it is not interchangeable with . Temperature, loading rate, crack orientation, weld location, and stable crack growth can change the governing result before unstable fracture occurs. That is why crack-tip performance must be matched to the parameter and validity model used in design.
Elastic-Plastic Toughness: J, CTOD, and R-Curves
Linear-elastic fracture mechanics (LEFM) works when the crack-tip plastic zone is small compared with the specimen and remaining ligament. Under those conditions, the stress-intensity factor describes the intensity of the elastic crack-tip field, and can represent plane-strain fracture toughness. ASTM E399-24 determines with fatigue-precracked metallic specimens under predominantly linear-elastic, plane-strain conditions. Its validity requirements are not administrative details: if plasticity spreads through too much of the ligament, a reported is not a valid plane-strain material limit.
As steel yields around a crack, the crack-tip field becomes nonuniform and the applied load is no longer represented adequately by alone. Plastic deformation absorbs energy, changes the crack-tip constraint, and can produce stable tearing before unstable fracture. NIST’s 2008 discussion of steel fracture describes elastic-plastic testing as a way to account for these complex stress-strain distributions and improve predictions of unstable crack propagation. The relevant result may then be a J value, a CTOD value, or an entire resistance curve rather than a single .
ASTM E1820 and J-based resistance
The J-integral is an elastic-plastic crack-driving parameter. In physical terms, it represents the energy available for crack extension per unit of newly created crack area, with units of energy per area, commonly or . For a sufficiently constrained crack under conditions where the J-field characterizes the near-tip deformation, J can describe the intensity of both elastic and plastic crack-tip loading. It is not simply another name for .
In the limiting linear-elastic case, a relationship such as
connects the parameters, where for plane stress and for plane strain. This equation does not make J and K interchangeable in general. It applies to the elastic contribution under defined assumptions; plastic work, specimen geometry, crack extension, and constraint can make the measured quantities behave differently.
ASTM E1820 provides Mode I procedures using K, J, and CTOD, reported either as point values or as resistance curves. Compact-tension, or C(T), and single-edge-bend, or SE(B), specimens are common configurations. A test begins with a fatigue-precracked specimen, then records load and displacement as the crack is loaded. Compliance changes, unloading procedures, or post-test measurements can be used to estimate crack extension and separate elastic from plastic contributions to J.
A value such as is therefore conditional. It depends on the standard’s definitions of initiation, specimen size, crack preparation, data reduction, and validity. A small specimen may produce a useful screening result but fail the size or constraint requirements needed for a transferable initiation toughness. The same caution applies to welds: ISO 15653:2018 addresses cracks located in weld metal and heat-affected zones and uses K, CTOD , and the experimental equivalent of the J-integral. Base-metal values cannot automatically stand in for those locations.
CTOD as crack-tip displacement
CTOD, written , measures crack-tip opening displacement. Rather than expressing crack severity as an energy flow or elastic stress-field amplitude, it describes how far the two crack faces separate near the original crack tip. In a yielding steel, that opening includes the effects of crack-tip blunting and plastic deformation. A critical CTOD is reached when a specified fracture or crack-extension event occurs.
This makes CTOD especially useful when plasticity is substantial and when a displacement-based description corresponds closely to observed tearing. ASTM E1290 focuses on critical CTOD values at specified crack-extension events and is particularly relevant to steels undergoing a ductile-to-brittle transition as temperature decreases. A low-temperature test may show little stable tearing before cleavage, while a warmer test may show blunting followed by ductile extension. The selected event matters.
CTOD and J are related through fracture-mechanics models and standard-specific conversion procedures, but they measure different quantities. A CTOD value is not automatically convertible into without assumptions about the crack-tip field, yield strength, geometry, and deformation regime. Nor does CTOD equal . ISO 12135:2021 places K, CTOD , J, and resistance curves within one quasistatic framework for homogeneous metallic specimens, but that common framework does not erase their distinct definitions.
Resistance curves versus single-point values
An R-curve records fracture resistance as crack extension proceeds. The horizontal variable is usually stable crack growth, ; the vertical variable may be J, CTOD, or another permitted fracture parameter. The curve can rise because the crack blunts, plastically deforms, and then requires increasing driving force to continue tearing. Its slope contains information that a single initiation value cannot provide.
That distinction is important in ductile structural steels. A point value may identify the onset of significant crack extension, whereas the R-curve shows whether the specimen can tolerate additional stable tearing before the applied driving force reaches the curve. Intersection of the applied J or CTOD driving force with the rising resistance curve can indicate stable growth; a subsequent loss of separation between driving force and resistance can indicate unstable fracture. The result depends on geometry and constraint, so it is not a universal grade constant.
Temperature, loading rate, thickness, weld location, crack orientation, and specimen geometry all affect the curve. A C(T) result and an SE(B) result may differ even when cut from the same heat of steel. A reported “toughness” without its parameter, crack-extension definition, test temperature, loading rate, and validity limits is incomplete. ASTM E1820, ISO 12135:2021, and ISO 15653:2018 provide procedures, not permission to treat J, CTOD, K, and R-curve data as interchangeable.
Temperature, Ductile-to-Brittle Transition, and Crack-Tip Plasticity
Temperature-dependent fracture behavior
Temperature can shift steel fracture behavior between ductile tearing and brittle cleavage. Strong evidence
Steel does not have one fixed fracture toughness across all service conditions. Temperature changes the balance between crack-tip plastic deformation and cleavage. As temperature falls, dislocation motion becomes more difficult in many ferritic and low-alloy steels. A crack tip that could previously blunt through plastic flow may instead reach a critical stress for rapid cleavage. The result can be a sharp transition from stable, ductile tearing to unstable, brittle fracture over a comparatively narrow temperature interval.
This behavior is commonly described as the ductile-to-brittle transition (DBT). It is especially important for body-centred-cubic ferritic steels, including many grades used in bridges, pressure equipment, pipelines, and structural fabrication. Austenitic stainless steels generally do not show the same pronounced transition in ordinary service because their face-centred-cubic structure retains greater low-temperature ductility, although alloy condition, weld thermal history, loading rate, and environment still affect fracture response.
A toughness value measured at room temperature therefore cannot be transferred automatically to a sub-zero structure. The crack-driving force must also be considered. NASA-HDBK-5010, Volume 2, expresses the Mode I stress-intensity factor for a centrally cracked plate as:
where is crack size, is applied stress, and is a geometry correction factor. Temperature does not appear explicitly in this equation, but it changes the material resistance against which is compared. A structure can experience the same nominal stress and crack size at two temperatures while having very different margins against fracture.
The temperature effect is also rate-sensitive. Faster loading leaves less time for plastic accommodation and can shift apparent transition behavior toward higher temperatures. Constraint has a similar effect. Thick sections, deep cracks, sharp crack fronts, and restrained weld details suppress crack-tip deformation, making cleavage more likely than a test on a thin, shallow-cracked specimen would suggest.
Critical CTOD and transition-sensitive steels
Crack-tip opening displacement, or CTOD , describes the opening displacement associated with deformation near a crack tip. Critical CTOD is not a general grade label. It is a measured value tied to a specified fracture event, test geometry, temperature, loading rate, and crack location.
ASTM E1290 addresses critical CTOD at specified crack-extension events and is particularly relevant to metallic materials undergoing a ductile-to-brittle transition as temperature decreases. The event may involve the onset of stable tearing, a defined amount of crack extension, or unstable fracture, depending on the procedure and interpretation. A reported consequently needs its event definition; values associated with different events should not be treated as interchangeable.
At warmer temperatures, a ferritic steel may show substantial crack-tip blunting followed by stable ductile tearing. CTOD can then be interpreted alongside a resistance curve, which records rising fracture resistance as the crack extends. At lower temperatures, the same steel may show little stable extension before cleavage. The relevant CTOD can fall sharply, and a single point value may conceal the change from tearing-controlled behavior to cleavage-controlled failure.
ASTM E1820 permits Mode I assessment using , , and CTOD, either as point values or resistance curves. ISO 12135:2021 likewise specifies quasistatic methods using stress intensity, CTOD , the -integral, and resistance curves for fatigue-precracked homogeneous metallic specimens. These parameters describe related crack-tip behavior, but they are not numerically interchangeable. is suited to predominantly elastic fields; and CTOD are more useful when appreciable plasticity develops.
The distinction becomes essential in welded steel. ISO 15653:2018 covers weld fracture-toughness testing with fatigue cracks located in weld metal or heat-affected zones and uses , CTOD , and the experimental equivalent of the -integral. A weld can contain coarse-grained heat-affected material, inclusions, residual stress, hardness gradients, and local brittle zones. Its CTOD result may therefore differ markedly from the parent plate result, even when both carry the same nominal steel designation.
Elastic-plastic and dynamic fracture
Linear-elastic fracture mechanics works when the crack-tip plastic zone remains small compared with the specimen dimensions and relevant crack geometry. ASTM E399-24 uses this basis to determine under predominantly linear-elastic, plane-strain conditions with fatigue-precracked metallic specimens. The validity requirements matter. A value that fails them is not a valid plane-strain , even if the test produced a clean-looking fracture surface.
When plasticity is substantial, the crack-tip field is not represented adequately by one elastic stress-intensity value. The -integral, CTOD, and resistance curves can capture elastic-plastic deformation and stable crack growth, but their interpretation still depends on constraint and specimen size. Nonuniform yielding produces gradients through the thickness and along the crack front. Local strain may concentrate in one region while other regions remain mostly elastic.
NIST’s 2008 account of dynamic fracture in steel explains why elastic-plastic fracture-toughness testing is needed when nonuniform crack-tip plasticity and complex stress-strain distributions influence unstable crack propagation. Under impact or rapidly increasing load, the crack-tip response can differ from a quasistatic test because plastic flow, wave propagation, inertia, and crack speed interact. Static toughness data may then overstate or understate the resistance available during the actual event.
Every meaningful toughness result should therefore identify the parameter and standard, temperature, loading rate, specimen geometry, thickness and constraint, crack orientation and location, weld condition where applicable, and validity limits. Without those details, “the toughness of the steel” is an incomplete statement.
Welds, Heat-Affected Zones, and Local Crack-Tip Performance
A welded steel component does not possess one automatically transferable toughness value. Its parent plate, weld metal, fusion boundary, and heat-affected zone (HAZ) may have different compositions, grain structures, residual stresses, and crack-tip constraints. A toughness result from the plate therefore cannot qualify the joint unless the crack location, welding procedure, thermal history, and test conditions are shown to be representative.
ISO 15653:2018 for weld fracture toughness
ISO 15653:2018 specifies fracture-toughness testing for welded metallic components using the stress-intensity factor , crack-tip opening displacement (CTOD), and an experimentally determined equivalent of the J-integral. These parameters describe different aspects of crack-tip behavior. is most appropriate when deformation remains sufficiently elastic and small-scale plasticity applies. CTOD describes the opening displacement associated with elastic-plastic crack-tip deformation. J represents the energy available for crack extension and is useful when plasticity is too extensive for a valid linear-elastic interpretation.
The standard is not simply a table of weld-grade toughness values. It provides methods for preparing and testing specimens whose fatigue cracks are deliberately positioned in particular weld regions. That placement is part of the result. A specimen tested with its crack in the deposited weld metal answers a different question from one with its crack following the HAZ or sampling the fusion boundary.
This distinction matters because a reported CTOD or J value is meaningful only with its test temperature, loading rate, specimen geometry, crack orientation, crack location, and validity assessment. A weld result obtained under one procedure cannot be assigned automatically to every joint made with the same nominal steel designation. Heat input, interpass temperature, shielding conditions, consumables, pass sequence, restraint, post-weld heat treatment, and repair welding can all change the local crack-tip response.
ISO 15653:2018 should therefore be read alongside the general fracture standards used for homogeneous metals. ISO 12135:2021 covers quasistatic methods based on , , J, and resistance curves, while ASTM E1820 evaluates Mode I behavior through , J, and CTOD, including both point values and crack-growth resistance curves. Those methods do not make K, J, and CTOD interchangeable. A critical CTOD at a specified crack-extension event is not the same property as , , or an R-curve.

Weld metal versus heat-affected zone
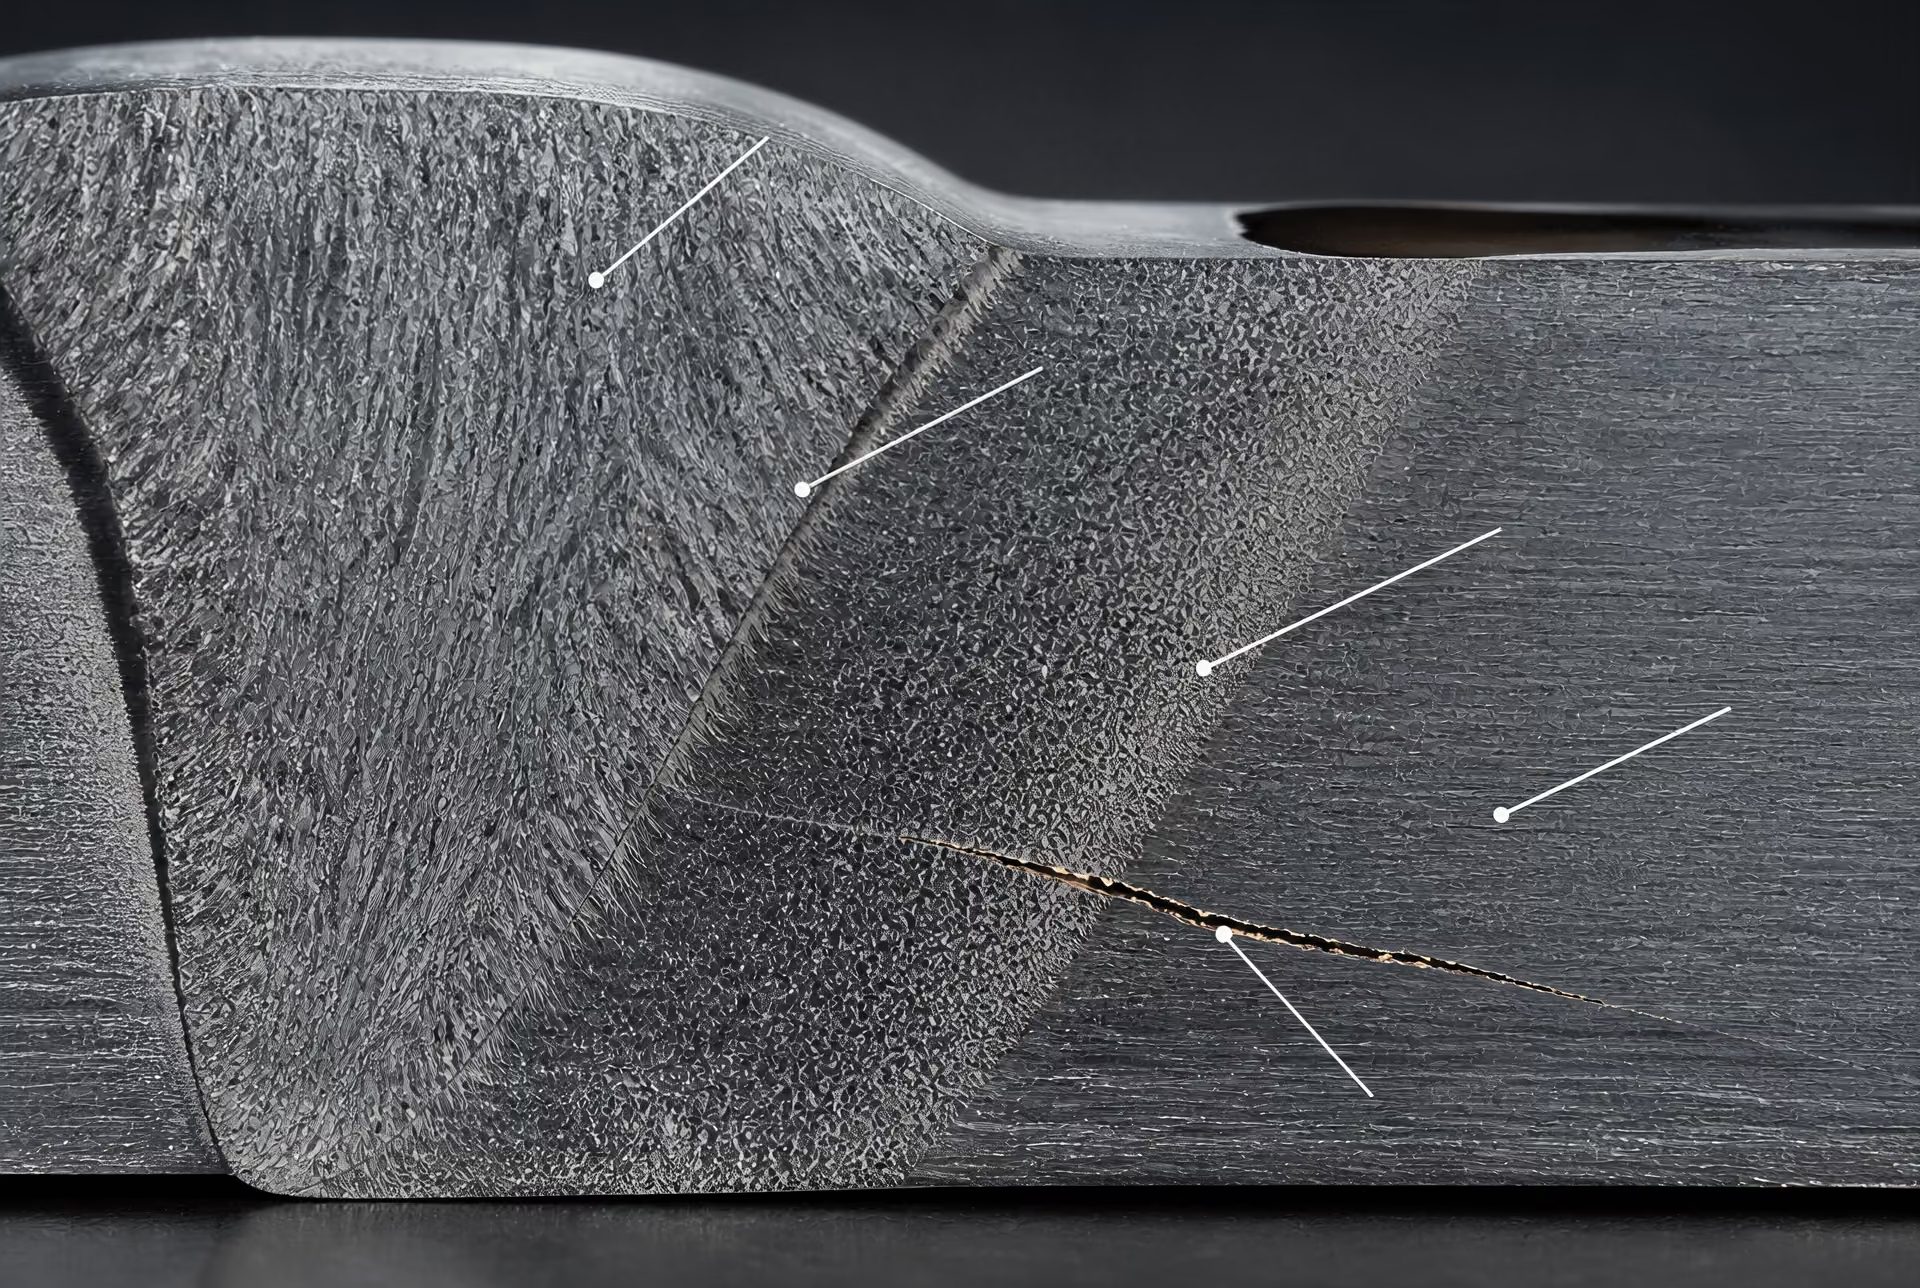
Weld metal solidifies from the molten pool and can contain columnar grains, segregation bands, inclusions, and reheated regions produced by later passes. Its toughness depends on the deposited composition and the weld thermal cycle, not only on the nominal designation of the parent plate. Hydrogen control, cooling rate, dilution, and consumable chemistry can affect the resulting microstructure and the likelihood of cleavage or ductile tearing.
Heat-affected zone (HAZ) The region of parent metal next to a weld whose microstructure and properties were changed by welding heat without being melted.
The HAZ is not a single material either. Moving outward from the fusion boundary, it may include coarse-grained, fine-grained, intercritical, and subcritical regions. The coarse-grained HAZ can have reduced toughness where peak temperatures promote grain growth and subsequent cooling produces a less favorable transformation structure. A fine-grained region may respond differently, while an intercritical zone can contain mixed transformed and untransformed areas. The local minimum may occur in a narrow band that a broadly positioned fatigue crack fails to sample.
Fatigue-crack placement is consequently decisive. A crack centered in weld metal mainly measures the deposited metal and its local defects. A crack placed in the HAZ measures a selected thermal subregion, provided the fatigue precrack remains where intended. A crack directed along the fusion boundary probes an interface with abrupt changes in composition, grain orientation, hardness, and deformation behavior. Small deviations in notch alignment can move the crack into a different region and alter the apparent toughness.
The result can also depend on whether the test records fracture initiation or stable crack growth. One weld region may resist initial cleavage yet show rapid ductile tearing after extension begins; another may sustain stable growth but fail at a low initiation value. Resistance-curve data can expose this difference more clearly than a single critical point.
Microstructure, residual stress, and crack placement
Residual welding stress changes the starting stress state at the crack. Tensile residual stress can increase the effective opening load at a flaw even when the externally applied nominal stress is modest. It may also alter fatigue-precrack growth and interact with the constraint imposed by a thick plate, stiff repair, or nearby weld. Stress relief, redistribution during service, and local yielding complicate the interpretation, but they do not justify ignoring residual stress during assessment.
Local constraint is equally important. The same nominal steel can show different crack-tip behavior in a thin specimen, a thick restrained joint, and a highly triaxial structural detail. In linear-elastic terms, NASA-HDBK-5010, Volume 2, gives for a centrally cracked plate, with representing geometry. A weld changes more than geometry: elastic modulus, yield behavior, thermal stress, and crack-front shape may vary across the specimen.
Inclusions and lack-of-fusion defects can act as local stress concentrators or initiate microvoids ahead of the main crack. At the fusion boundary, crystallographic changes and mismatched deformation can intensify local constraint. These effects can produce fracture paths that leave the intended region, particularly when the crack encounters a tougher or weaker neighboring zone.
A defensible weld-toughness interpretation therefore identifies the welding procedure, weld location, crack orientation, temperature, loading mode, specimen dimensions, and failure event. Without that information, a numerical result describes one tested local configuration—not every weld made from that parent steel.
Fatigue Crack Growth and the Role of ΔK

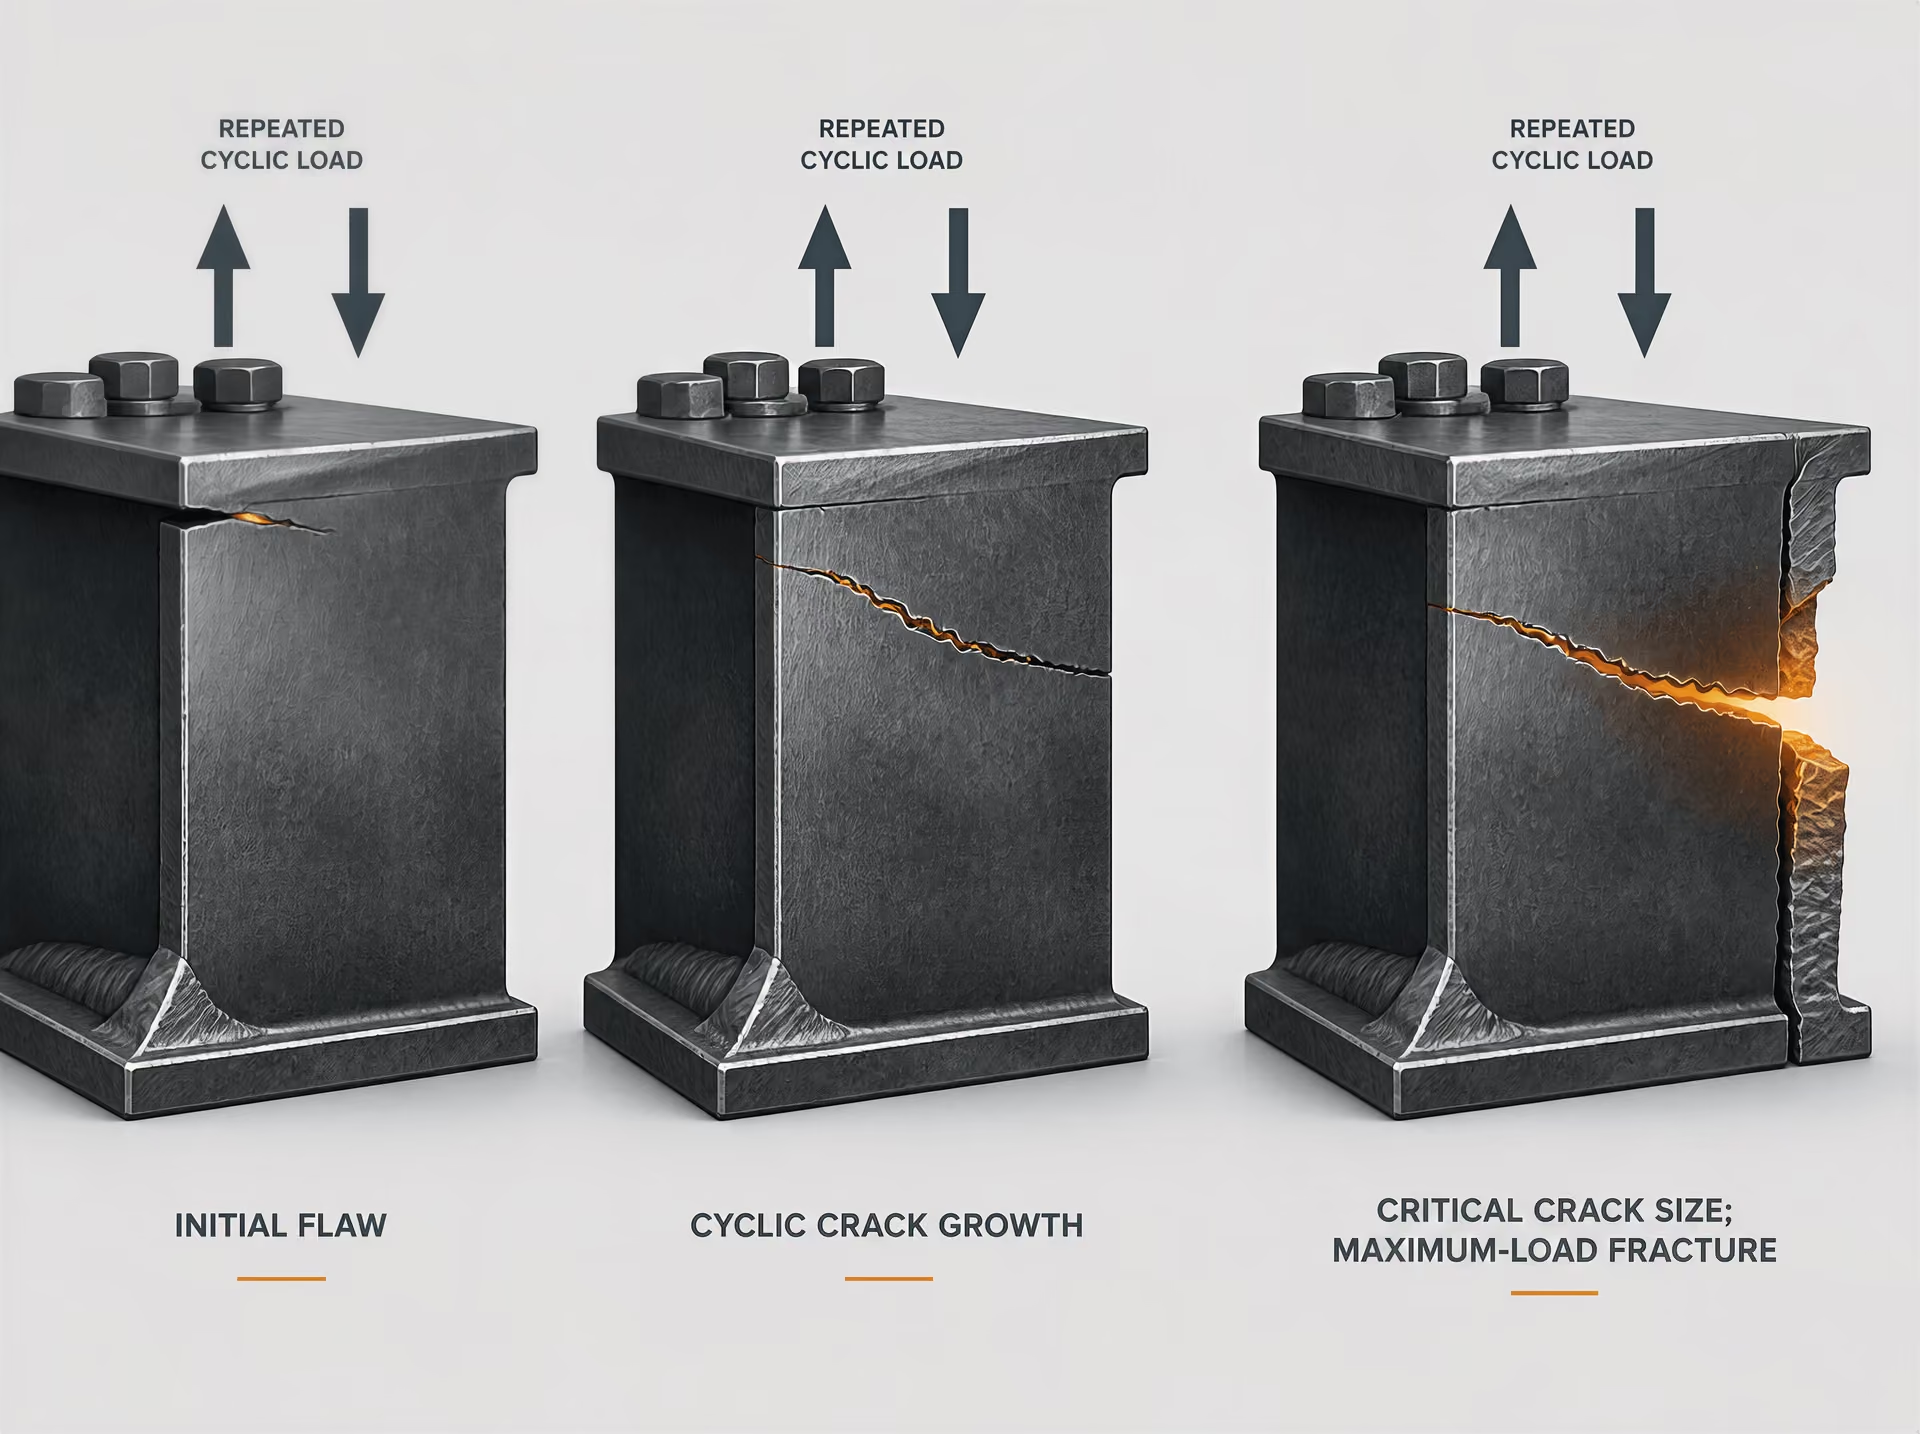
From cyclic loading to critical fracture
A steel structure can tolerate a crack for many thousands or millions of load cycles without experiencing immediate fracture. That does not mean the crack is harmless. Each tensile loading cycle can extend the crack by a small amount, gradually reducing the remaining ligament and increasing the stress intensity at the crack tip. Fatigue crack growth is therefore a subcritical process; final fracture is a separate event governed by the crack-tip condition at the maximum applied load.
The distinction follows the framework established by A. A. Griffith and extended by G. R. Irwin. Griffith’s energy criterion describes when crack extension becomes energetically favorable, while Irwin’s stress-intensity formulation relates the applied load, crack geometry, and crack-tip stress field. For a centrally cracked plate, NASA-HDBK-5010, Volume 2, gives the Mode I relation
where is the stress-intensity factor, is a geometry correction factor, is the applied nominal stress, and is the crack dimension used by the model. The same nominal stress produces different crack-tip conditions when the crack shape, position, free surfaces, thickness, or structural geometry changes.
During cyclic loading, the crack can grow while the maximum value of remains below the applicable fracture-toughness limit. Once the crack becomes sufficiently large, or the applied stress rises sufficiently, the maximum-load condition can reach a critical value such as , a critical CTOD, or a J-based fracture criterion. Unstable propagation may then follow. A structure may therefore survive repeated service loading below critical while still accumulating crack extension. “Below ” is not equivalent to “no damage.”
This separation also explains why fracture toughness is not the same property as fatigue resistance. A high may delay unstable fracture but does not, by itself, specify the rate of fatigue crack extension. Conversely, a crack-growth assessment cannot substitute a toughness test. ASTM E399-24 determines under predominantly linear-elastic, plane-strain conditions with fatigue-precracked metallic specimens; its validity depends on limiting crack-tip plasticity relative to specimen dimensions.
ΔK as the fatigue-driving parameter
For a cycle with minimum and maximum loads, the Mode I stress-intensity range is
NASA-HDBK-5010, Volume 2, identifies as the controlling parameter for cyclic crack growth within the applicable linear-elastic fatigue-fracture model. The maximum value, , serves a different purpose: it is checked against the fracture criterion for instantaneous failure. Using alone to predict fatigue life confuses these two checks.
The calculation of must use the crack geometry and the load range, not merely the nominal stress range. For a centrally cracked plate under a fixed geometry, the range may be written as
but can change with crack length, finite width, edge proximity, bending, holes, stiffeners, or weld details. A surface crack, corner crack, embedded flaw, and through-thickness crack do not share the same correction factor. AFGROW’s 2024 damage-tolerance handbook likewise describes crack-tip response through a stress-intensity factor dependent on loading, geometry, and crack dimensions.
Load ratio matters as well. Defining , two cycles with the same can produce different growth behavior when their mean stresses differ. Crack closure, tensile residual stress, crack-tip plasticity, and load-sequence effects can change the effective driving force. A negative or low cycle may partially close the crack, whereas a high- cycle keeps it open for more of the loading history. The assessment must therefore state the load spectrum and the crack-growth model rather than assign one universal growth rate to a steel grade.
The relevant loading mode must also be identified. Mode I opening is the usual basis for , but shear and tearing components can influence weld toes, weld defects, fastener holes, and complex structural joints. When crack-tip plasticity is not small compared with the specimen or structural dimensions, J-integral, CTOD, or resistance-curve methods may be more suitable. ASTM E1820 and ISO 12135:2021 cover these different fracture parameters; their values are not interchangeable with .
Inspection intervals and residual strength
Damage tolerance begins with an assumed initial flaw, often selected from manufacturing quality, weld-defect data, prior inspection capability, or a specified critical-detection size. The crack is then advanced through the service load spectrum using an appropriate -based model, with adjustments for load ratio, geometry, residual stress, temperature, and weld location. Weld metal and heat-affected zones may require separate properties and crack placements; ISO 15653:2018 specifically addresses weld fracture toughness using , CTOD , and the experimental equivalent of the J-integral.
Inspection intervals should be tied to the predicted interval between the assumed detectable crack size and the critical size, with allowance for model uncertainty and inspection error. At each assessment point, residual strength is checked using , not . The calculation asks whether the current crack size and maximum service load remain below the applicable toughness or resistance-curve limit. Temperature, thickness, constraint, loading rate, and crack location can reduce the margin, particularly in thick sections or near the ductile-to-brittle transition.
Damage-tolerance sequence
- Starting flaw Assume an initial flaw based on manufacturing quality, weld-defect data, inspection capability, or a specified detection size.
- Subcritical growth Advance the crack through the service load spectrum using an appropriate ΔK-based model.
- Inspection Inspect before the crack reaches the allowable or critical size, allowing for inspection error and model uncertainty.
- Residual strength Check the current crack against the maximum-load fracture criterion using Kmax, CTOD, J, or a resistance curve as applicable.
The result is a linked sequence: assume a starting flaw, predict subcritical extension, inspect before the crack reaches the allowable limit, and verify residual strength against a fracture-toughness criterion. Failure can occur in either part of that sequence. A crack may grow too far between inspections, or a previously acceptable crack may encounter a high maximum load and fracture immediately. That is why fatigue life and fracture toughness must be reported and assessed as separate, connected quantities.
Applying Standards and Toughness Data to Steel Design
A fracture-toughness result is not a general property of a steel grade in the way that nominal yield strength is. It describes a defined crack, specimen, loading mode, temperature, and failure criterion. The result must then be related to the crack and stress field in the component. A KIC value from a thick, fatigue-precracked specimen cannot simply be substituted for CTOD from a weld test, or for a J-R curve measured on a ductile steel.
Choosing a test method
Use ASTM E399-24 when the design question concerns a valid plane-strain, linear-elastic critical stress-intensity factor, KIC. The method uses fatigue-precracked metallic specimens and is applicable only when the crack-tip plastic zone remains small compared with the specimen dimensions. Its validity requirements are not administrative details: insufficient thickness, excessive yielding, or an invalid specimen result means that the reported value is not a valid KIC, even if the test produced a clean fracture.
For elastic-plastic behavior, select ASTM E1820 or ISO 12135:2021. ASTM E1820 evaluates Mode I fracture using K, J, and crack-tip opening displacement (CTOD), either as a single point value or as a resistance curve. ISO 12135:2021 provides quasistatic methods for K, CTOD δ, J, and R-curves in fatigue-precracked homogeneous metallic specimens. These methods are more suitable when substantial crack-tip plasticity occurs, when stable crack extension matters, or when a J-integral or resistance curve is required rather than a single linear-elastic number.
Use ASTM E1290 for a CTOD-focused evaluation, particularly when critical crack-tip opening displacement at a specified crack-extension event is the design measure. CTOD is often useful in steels that pass from ductile to brittle behavior as temperature falls, but a critical CTOD value remains tied to the event definition, specimen geometry, and test temperature. It is not interchangeable with JIC or KIC.
| Standard | Primary use | Parameters or focus |
|---|---|---|
| ASTM E399-24 | Plane-strain fracture toughness | KIC under predominantly linear-elastic, plane-strain conditions |
| ASTM E1820 | Mode I fracture behavior | K, J, CTOD, and resistance curves |
| ASTM E1290 | Critical crack-tip opening displacement | CTOD at specified crack-extension events |
| ISO 12135:2021 | Quasistatic homogeneous-metal testing | K, CTOD δ, J, and resistance curves |
| ISO 15653:2018 | Weld fracture-toughness testing | K, CTOD δ, and experimental equivalent of the J-integral |
Welded construction requires a weld-specific method. ISO 15653:2018 covers fracture-toughness testing of weldments using K, CTOD δ, and the experimental equivalent of the J-integral, with fatigue cracks positioned in weld metal or heat-affected zones. This distinction matters because weld metal, coarse-grained heat-affected zone material, intercritical regions, and unaffected parent plate can have different microstructures, residual stresses, inclusions, and transition temperatures. A parent-plate result does not qualify every location in a weld.
The choice also depends on loading. Mode I opening is the usual starting point, but mixed-mode loading, impact or dynamic loading, cyclic growth, and tearing after initiation may require separate analysis. NASA-HDBK-5010, Volume 2, expresses the Mode I intensity for a centrally cracked plate as
where β is a geometry correction factor, σ is the applied stress, and a is the crack dimension used by the model. Under cyclic loading, ΔK—not KIC—governs the rate of fatigue crack growth. A static fracture-toughness test cannot supply a fatigue-growth law.
Reading a toughness report correctly
Start with the steel designation and product form: for example, ASTM A572/A572M Grade 50 plate is not automatically equivalent to a weld consumable, a rolled section, or a quenched-and-tempered plate of another designation. Record heat treatment, thickness, and, where supplied, strength and transition-temperature data.
Minimum information to retain from a toughness report
- Material Steel designation, product form, thickness, heat treatment, and orientation.
- Specimen Specimen type, dimensions, crack geometry, and fatigue-precrack procedure.
- Test conditions Temperature, loading rate, loading control, and applied loading mode.
- Fracture result KIC, conditional KQ, JIC, CTOD δ, or a point on a J-R curve, together with the validity statement.
- Failure mechanism Cleavage, ductile tearing, pop-in, stable extension, or mixed fracture.
The report should state specimen type and dimensions, such as compact tension or single-edge bend, plus orientation. “L-T” and “T-L” identify different relationships between crack direction and product rolling direction; they can produce different results. For a weld, identify whether the crack lies in weld metal, fusion line, coarse-grained heat-affected zone, or another targeted location.
Also require the fatigue-precrack procedure, final crack-length measurement, test temperature, loading rate, and loading control. Temperature must be tied to the service case, not merely described as room temperature. The report should identify the fracture parameter—KIC, conditional KQ, JIC, CTOD δ, or a point on a J-R curve—and include the standard’s validity statement. A conditional KQ is not a valid KIC unless the plane-strain and size requirements are satisfied.
Finally, inspect the failure mode. Cleavage, ductile tearing, pop-in, stable extension, and mixed fracture carry different implications. A numerical value without the fracture appearance and crack-extension record hides the mechanism that controlled the result.
From laboratory specimen to structural assessment
The laboratory specimen supplies a material-characterization result under a particular constraint state. The structure supplies its own crack geometry, thickness, triaxiality, residual stress, weld detail, load history, and temperature. Structural assessment must connect the two.
A combination of crack size and stress below K = KIC can remain stable within the applicable fracture-mechanics model. Limited evidence
For a predominantly linear-elastic case, calculate the component stress intensity using the actual crack shape and geometry factor, then compare the result with a valid toughness value at the relevant temperature and orientation. The FHWA steel-bridge manual describes the basic condition: combinations of crack size and stress below K = KIC can remain stable within the applicable fracture-mechanics model. That comparison is not sufficient when yielding is extensive. Use J, CTOD, or a resistance curve where stable tearing and crack extension are part of the response. NIST’s 2008 discussion of dynamic fracture in steel explains why elastic-plastic testing is needed when nonuniform crack-tip plasticity and complex stress-strain fields influence unstable propagation.
This follows the foundations established by A. A. Griffith’s energy criterion and G. R. Irwin’s crack-tip stress field. Neither treats toughness as independent of geometry and loading. A practical assessment should therefore account for crack detection limits, probable flaw shape, inspection interval, residual and secondary stresses, constraint, and whether failure is initiation or stable growth.
Before accepting any claimed answer to “What is the toughness of this steel?”, ask:
1. Which standard and fracture parameter were used: ASTM E399-24 KIC, ASTM E1820 J or CTOD, ISO 12135:2021, ASTM E1290 CTOD, or ISO 15653:2018 for a weld? 2. What are the steel designation, product form, thickness, orientation, specimen type, and crack location? 3. What were the fatigue-precrack procedure, temperature, loading rate, and failure mode? 4. Is the reported value valid under the stated standard, or is it conditional? 5. Does the structural calculation use the actual crack geometry, constraint, loading mode, and service temperature? 6. Is the governing concern initiation, stable tearing, brittle fracture, or cyclic crack growth?
Without those definitions and service conditions, “the toughness of the steel” is an incomplete question.