


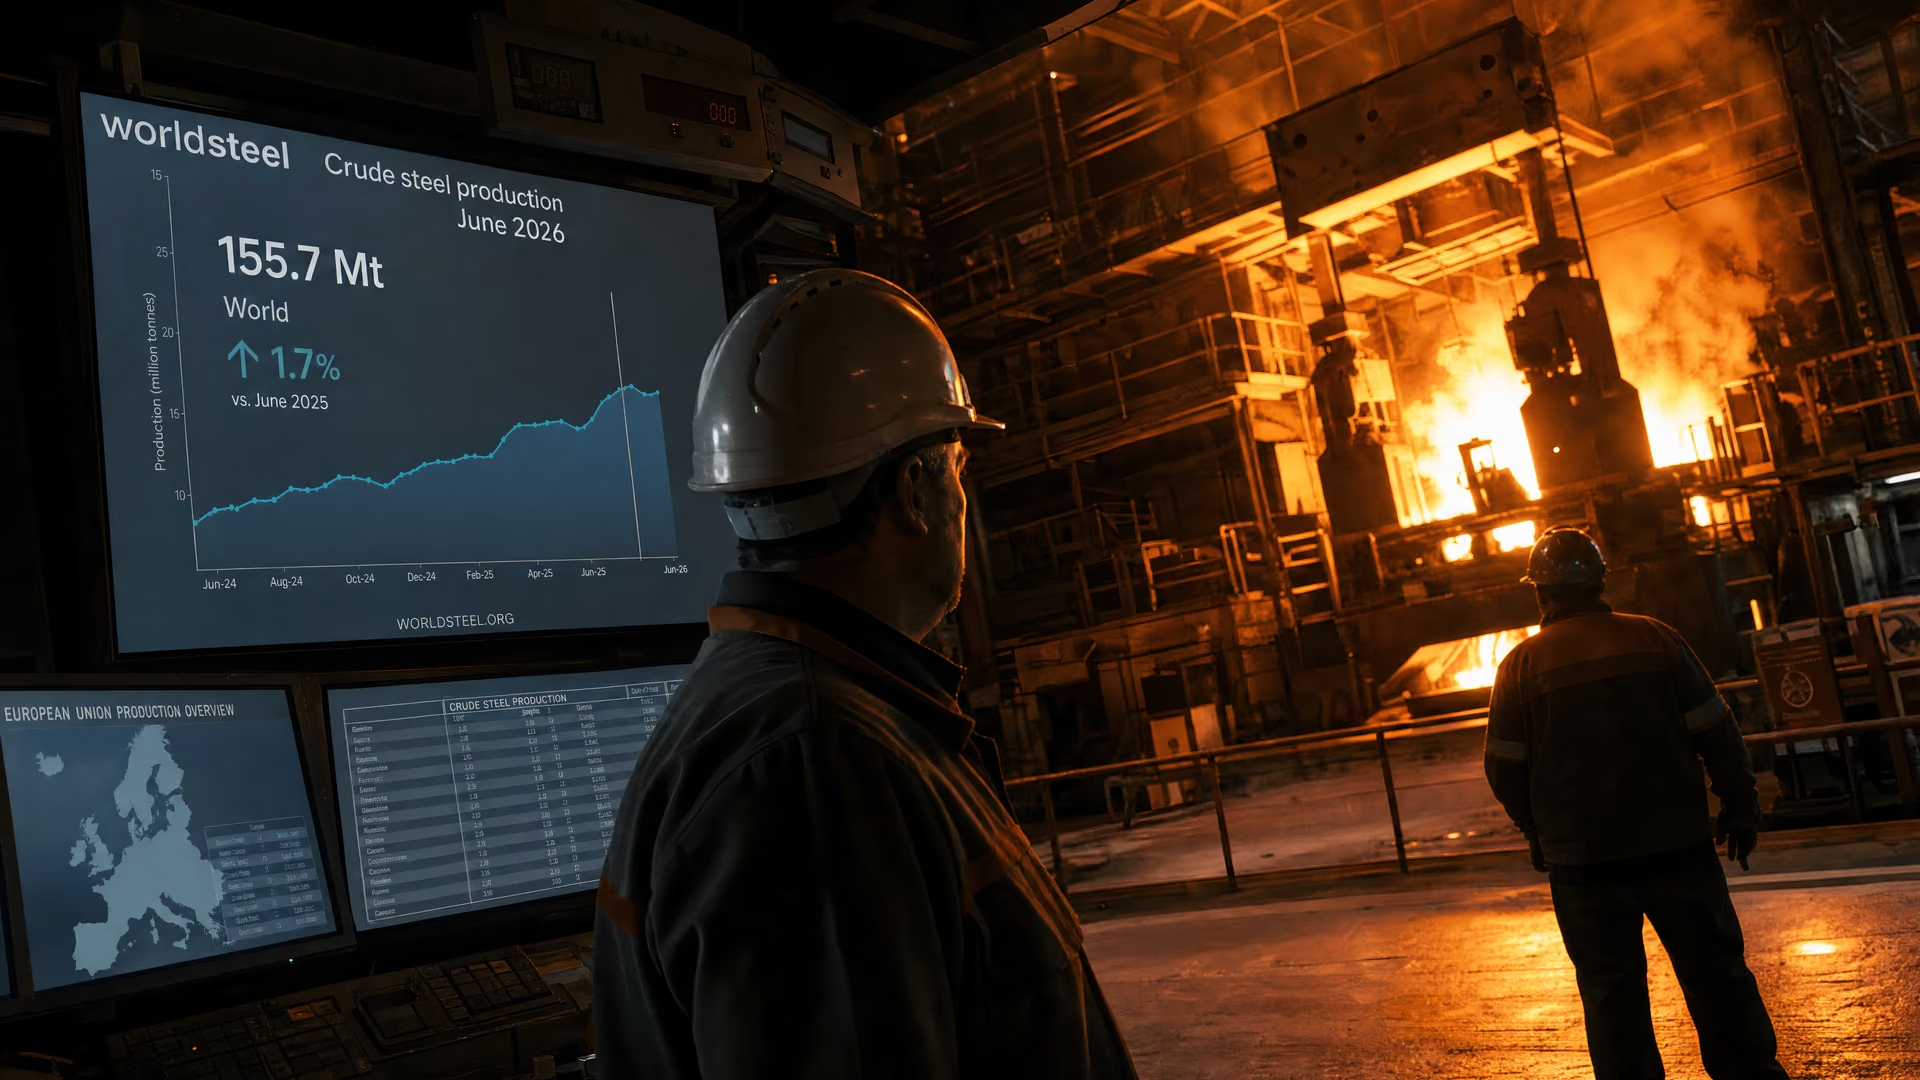
The European Union’s steel market gets a June benchmark as worldsteel reports 155.7 Mt of crude steel, up 1.7% year on year.

The European Union’s steel market gained a new global benchmark when Worldsteel’s June 2026 crude steel production report put output across 70 reporting countries at 155.7 million tonnes (Mt), up 1.7% from June 2025, while the available figures do not state a standalone EU total. Supporting coverage places Europe among the regions recording growth, but the distinction between a European regional result and an EU-specific production figure remains important for buyers, engineers and analysts.
Worldsteel sets the June production benchmark
The June result is a year-on-year comparison of crude steel production, not a measure of shipments, consumption or prices. Worldsteel’s reported scope covers 70 countries that submitted production data, and the combined total reached 155.7 Mt in June 2026. The increase over June 2025 was 1.7%.
For the European Union, the figure is useful as an external reference point for the condition of the wider steel industry. It does not, however, identify how much crude steel was produced inside the EU or how individual member-state results changed. That limitation should remain visible when the global number is used in regional market analysis.
The principal figures in the June release are:
A production measure with a defined reporting boundary
The reporting boundary is central to interpreting the result. The 155.7 Mt total is an aggregate of the countries included in the worldsteel dataset. It should therefore be read as a global production indicator that provides context for the EU market, rather than as a substitute for an EU production series.
Europe contributed to growth, but the EU total remains unstated
The supporting regional summary says that production gains in Europe, Africa, Asia and North America helped offset declines in the Middle East and the Commonwealth of Independent States. That places Europe on the positive side of the June global movement. It does not provide the additional detail needed to determine the European Union’s contribution within the European result.
That distinction is not merely editorial. Europe is a geographic region, while the European Union is a defined political and commercial jurisdiction. A European increase can include production outside the EU, and a global increase cannot be allocated to the EU without a separate EU or member-state figure. Separate coverage of the June global production increase likewise supports the global year-on-year result but does not supply an EU total in the facts available here.
For EU-focused analysis, the June release supports three limited observations:
- Global output rose to 155.7 Mt across the 70 reporting countries.
- The reported European regional direction was positive in June 2026.
- The supplied data do not quantify EU crude steel production or identify the performance of individual EU member states.
The monthly rise did not reverse the first-half decline
The June increase also needs to be set against the cumulative result for the first half of 2026. Supporting coverage reports that crude steel output across the same 70-country scope fell 0.7% in the first half compared with the first half of 2025. A positive June year-on-year result and a negative first-half comparison can therefore coexist: the monthly figure describes one period, while the half-year figure aggregates six months.
The reported measures can be set out as follows:
| Metric | Comparison period | Result | Scope | Source |
|---|---|---|---|---|
| Crude steel production | June 2026 | 155.7 Mt | 70 reporting countries | June 2026 crude steel production |
| Monthly year-on-year change | June 2026 versus June 2025 | +1.7% | 70 reporting countries | June 2026 crude steel production |
| First-half year-on-year change | First half of 2026 versus first half of 2025 | -0.7% | 70 reporting countries | Global steel output edges up in June |
A positive June result and a negative first-half result are not contradictory; they describe different comparison windows.
Reading of the reported worldsteel production figures
For the EU market, the half-year comparison is a reminder not to treat one stronger month as evidence of a sustained regional recovery. The available data establish the direction of the global monthly and first-half comparisons, but they do not show whether the EU followed either movement or how its internal production pattern developed.
How EU buyers should use the June figure
Procurement engineers and steel buyers can use the worldsteel release as a macro-level production reference, provided its scope is kept intact. It gives a common benchmark for discussing the international supply environment around June 2026, but it cannot answer the operational questions that arise in an EU purchasing decision.
A disciplined reading separates the information the release provides from the information it does not:
- Use 155.7 Mt as the reported crude steel output for the 70-country aggregate, not as EU production.
- Use +1.7% only for the June 2026 versus June 2025 comparison.
- Treat the reference to European growth as regional context, not as a quantified EU result.
- Do not infer product availability, shipment volumes, demand, pricing or individual mill performance from the production total alone.
The benchmark is informative but not a supply specification
The production number does not identify the grades, product forms, process routes or specifications represented in the aggregate. It therefore cannot replace supplier documentation, mill certificates or the applicable European or national technical requirements when a buyer is qualifying material.
For an EU purchasing team, the practical value of the June release lies in its scale and comparability: it records the direction of output across a defined international reporting group. Any decision involving a particular grade or delivery must be based on more specific information than the global crude steel total provides.
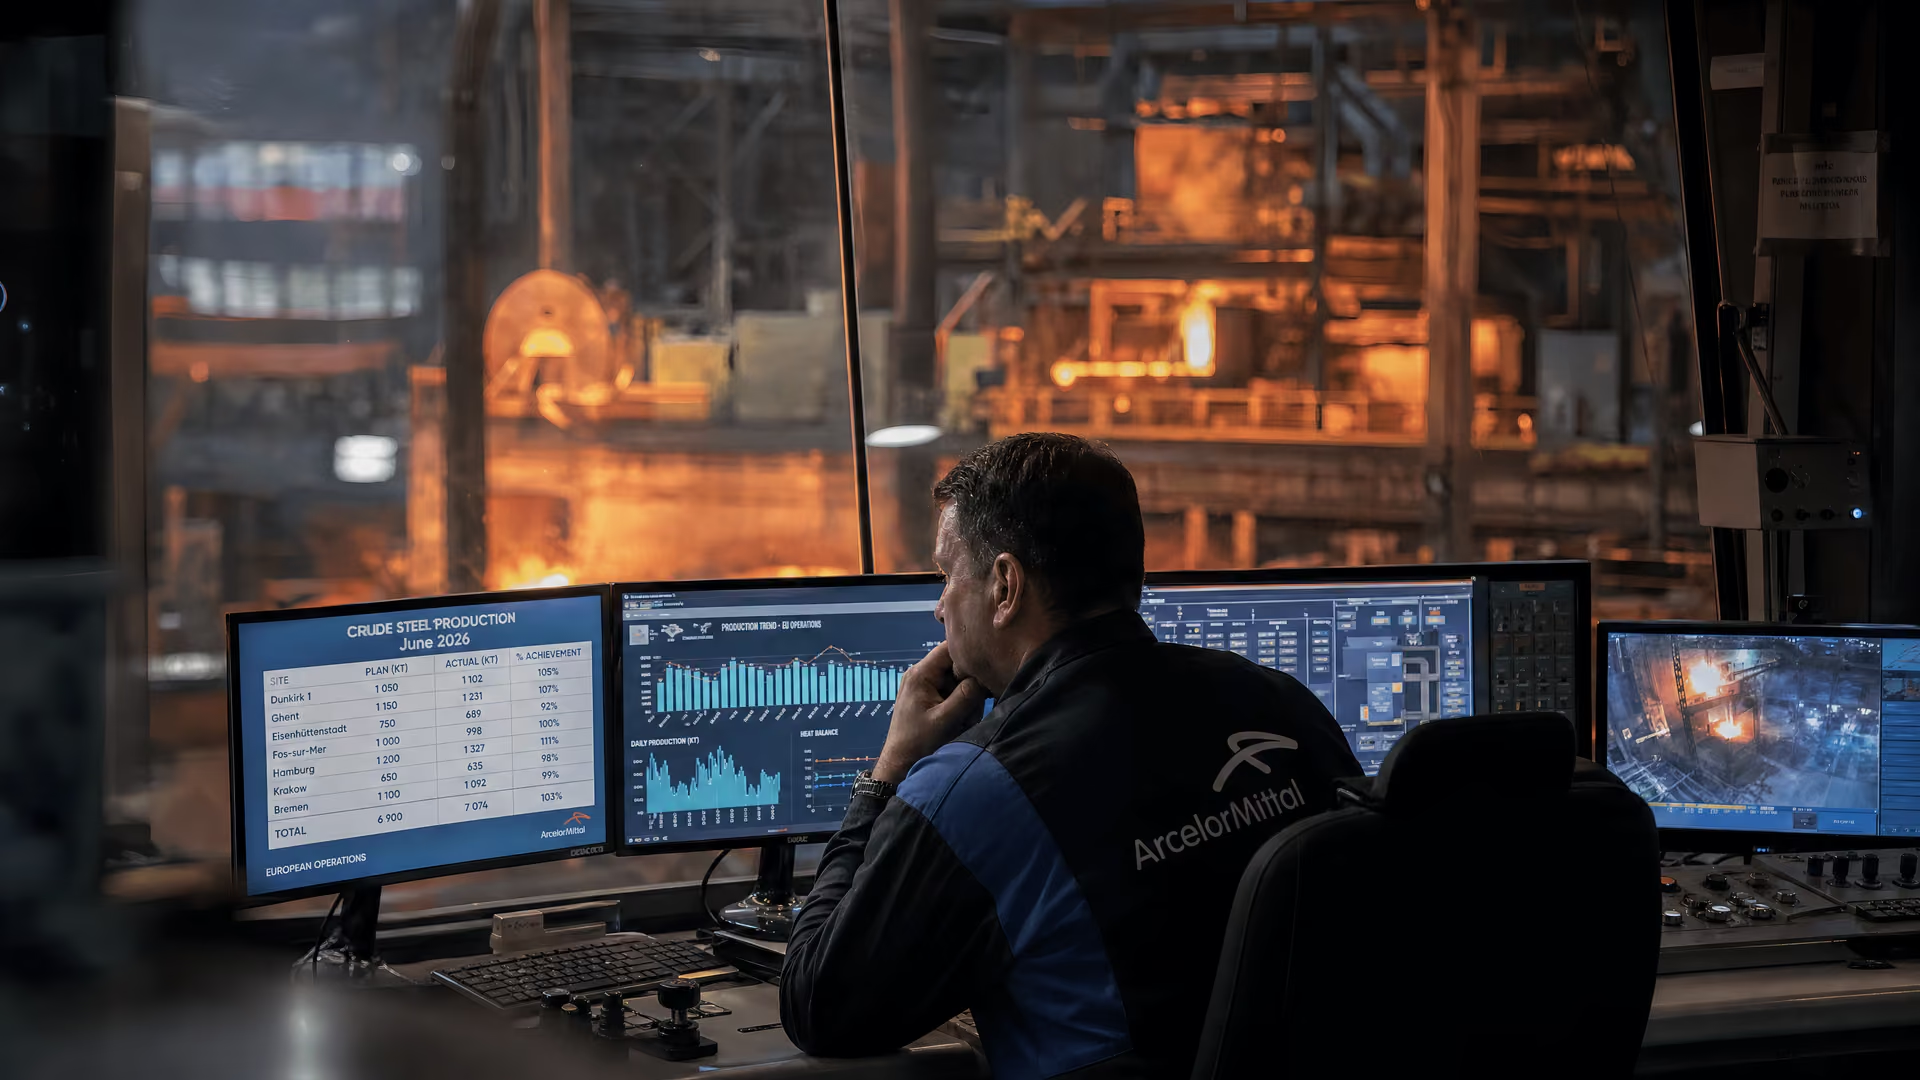
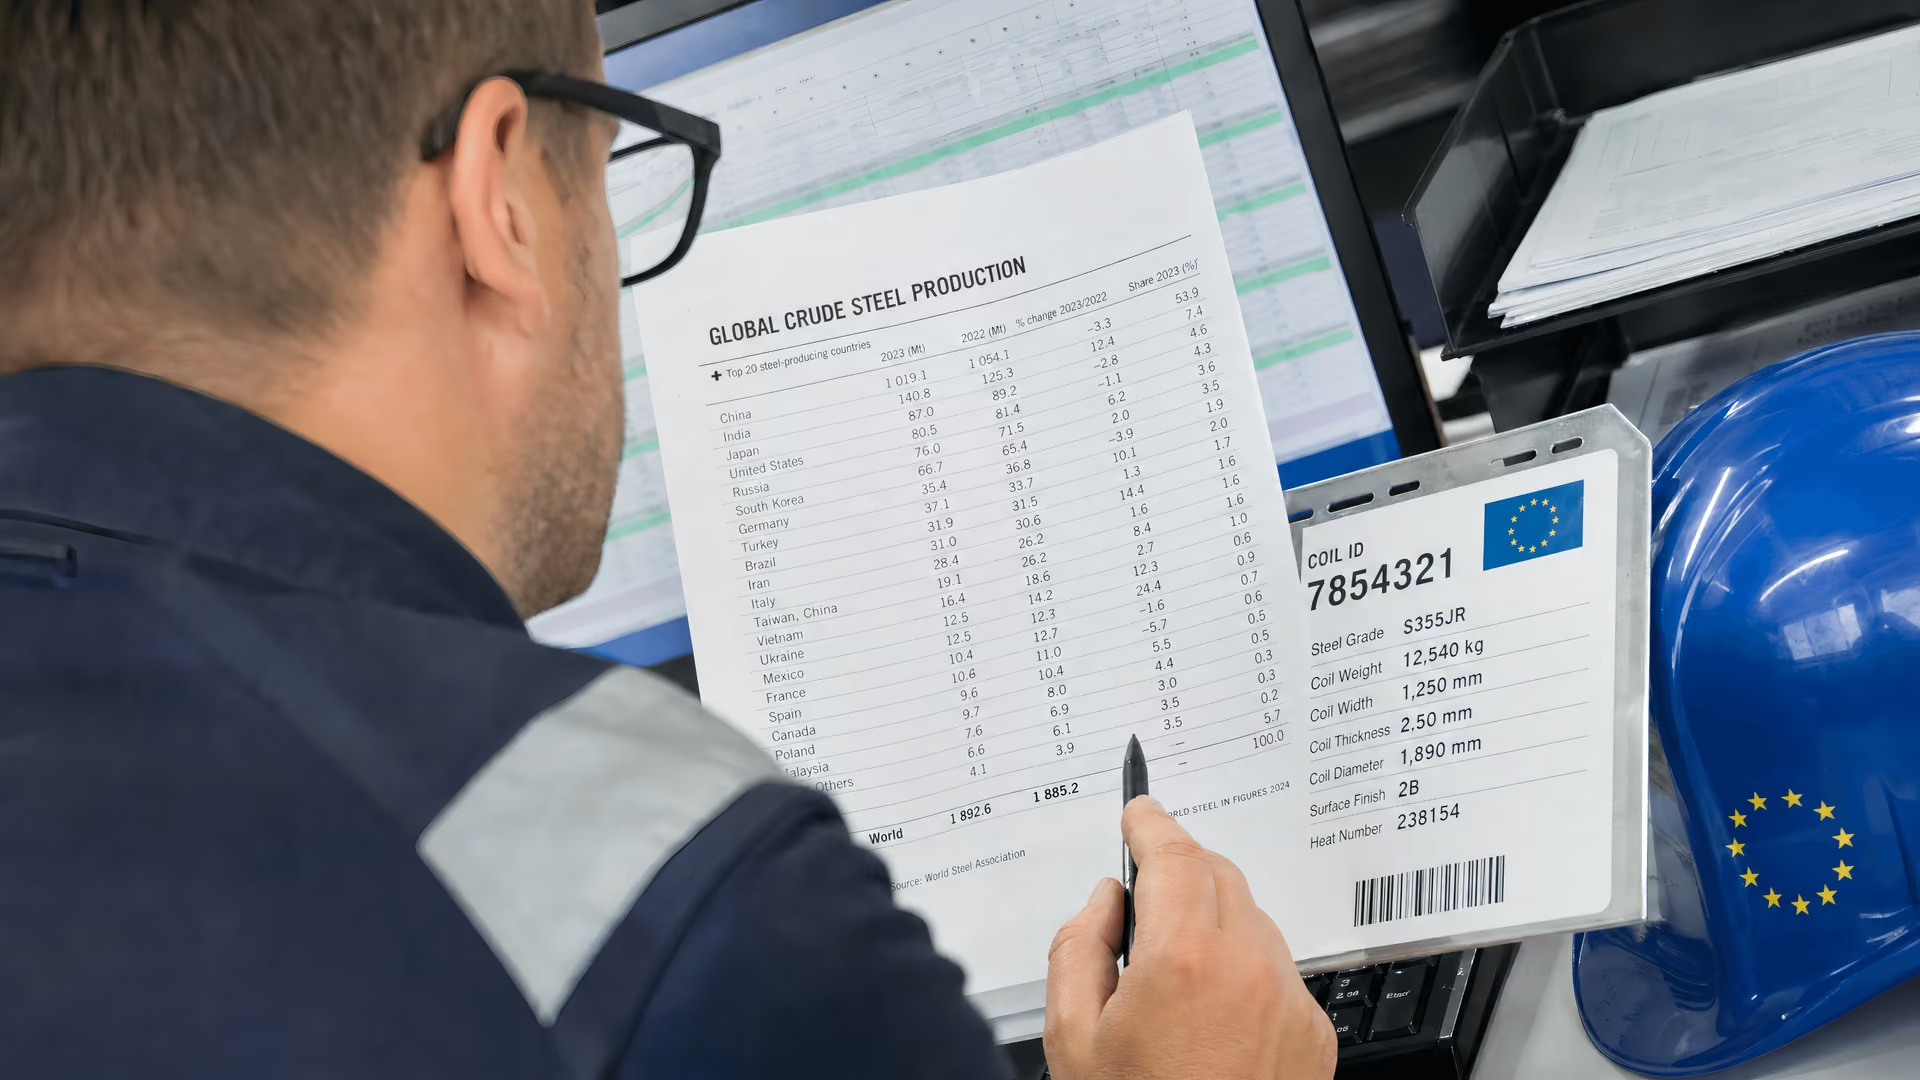
An editorial representation of that analytical task is:
What the June release does and does not establish for the EU
The June 2026 release establishes a clear global result: crude steel production across the 70 reporting countries reached 155.7 Mt, 1.7% above June 2025. Its supporting regional context places Europe among the areas contributing to the increase. The supplied information stops short of an EU-specific tonnage, a member-state breakdown or a product-level explanation.
That makes the release relevant to the European Union without making it an EU production report. The correct editorial and commercial reading is a global benchmark with a positive European regional signal, alongside a first-half result that remained 0.7% below the comparable period.
For European Union steel readers, the June 2026 worldsteel release is most useful when treated as a carefully bounded benchmark: global crude steel output rose to 155.7 Mt in the month, Europe contributed to the reported regional growth, and the broader first-half result remained negative. Without an EU-specific production figure, the data support context and comparison—not a standalone assessment of EU mill output.