



What Hardness Conversion Actually Means
Hardness conversion is an empirical mapping between test scales. It does not change the material, reproduce the original indentation, or reveal a hidden “true” hardness value. When a steel is tested by the Brinell method and reported as 210 HBW, that number comes from a defined indenter, force, dwell time, and indentation measurement. If the same result is reported as approximately 21 HRC through a conversion table, the Rockwell test has not been performed. The HRC value is inferred from a relationship established using comparable materials and test conditions.
Hardness terms
- HBW
- Brinell hardness measured with a tungsten-carbide ball.
- HRC
- Rockwell C hardness using a diamond cone and specified loads.
- HV
- Vickers hardness calculated from the diagonals of a diamond-pyramid impression.
- HL
- Leeb dynamic rebound hardness.
This distinction matters because hardness scales measure related but different responses. Brinell hardness uses the diameter of a relatively large indentation made by a carbide ball. Vickers hardness uses a diamond pyramid and calculates hardness from the applied force and the two diagonals of the impression. Rockwell hardness determines depth under specified preliminary and total forces; HRC uses a diamond cone and a 150 kgf total force. Their numbers are not different units of one universal physical quantity.
Measured hardness versus converted hardness
| Designation | Meaning | Measurement method |
|---|---|---|
| 210 HBW 10/3000 | Brinell hardness 210 | 10 mm carbide ball, 3000 kgf nominal force |
| 500 HV10 | Vickers hardness 500 | 10 kgf test force |
| 32 HRC | Rockwell C hardness 32 | Specified Rockwell C loads and diamond cone |
A measured value is tied to the test actually carried out. A laboratory report stating 210 HBW 10/3000 identifies the Brinell scale, a 10 mm carbide ball, and a 3000 kgf nominal force. “500 HV10” identifies a Vickers test made with a 10 kgf force. “32 HRC” identifies a Rockwell C result obtained under the conditions prescribed for that scale. The suffixes and test details are part of the result, not optional decoration.
Converted hardness should be reported separately from the directly measured scale. Strong evidence
A converted value should be marked as such. For example, “210 HBW, approximately 21 HRC by ASTM E140-12” communicates two separate facts: the first value was measured, while the second was read or calculated from an accepted correlation. Reporting only “21 HRC” can make an inferred value appear to have been directly measured, which is misleading when surface condition, section thickness, or scale selection could affect the result.[1] Standard Hardness Conversion Tables for Metals. ASTM International. ASTM International standard, 2012.
ASTM E140-12, Standard Hardness Conversion Tables for Metals, gives approximate relationships among Brinell, Vickers, Rockwell, superficial Rockwell, Knoop, Scleroscope, and Leeb scales for specified metals. Its tables include homogeneous carbon, alloy, and tool steels, but the presence of a steel category does not make every grade interchangeable. ASTM states that “the conversions are affected by alloy, grain structure, and heat treatment” (ASTM International, 2012). A quenched-and-tempered 4140 steel, a normalized AISI 1020 steel, and a cold-worked 301 stainless steel can show different relationships even when their readings on one scale are similar.
Geometry also affects whether a measurement is valid before any conversion is attempted. A thin sheet may show excessive influence from the opposite surface in a Brinell or Vickers test. A curved part can produce an altered indentation or an incorrectly interpreted Rockwell depth. A small indentation placed near an edge, another indentation, a weld, or a decarburized surface may not represent the bulk material. Conversion cannot repair a poorly selected or invalid test location.
Conversion tables, correlations, and estimates
A conversion table is a fitted summary of test results, usually divided by material group and hardness range. It is not a mathematical identity between scales. Within the range used to construct the table, the average difference between measured scales may be small; outside that range, the error can increase sharply. Interpolation within a stated range is generally more defensible than extrapolation beyond it.
Equations provide the same kind of relationship in another form. A correlation may be linear over a limited range, polynomial, or based on a regression fitted to a particular steel population. The coefficients describe that population. They do not establish a physical law for all steels. Scatter may arise from indenter geometry, elastic recovery, plastic flow, anisotropy, surface preparation, and variations in microstructure.[2] Metallic materials—Conversion of hardness values. International Organization for Standardization. ISO standard, 2013.
ISO 18265 limits direct applicability of converted values to the exact material tested and ranks tensile-strength estimates as least reliable. Strong evidence
ISO 18265:2013, Metallic materials—Conversion of hardness values, specifies principles for converting hardness values between scales and for estimating tensile strength. It warns that “the converted values are directly applicable only to the exact material tested” and identifies tensile-strength estimates as the least reliable conversions (International Organization for Standardization, 2013). That warning sets the proper order of confidence: a direct hardness result is strongest, a conversion to another hardness scale is less certain, and a tensile-strength estimate is less certain again.[3] Empirical Rockwell–Brinell relationships. National Institute of Standards and Technology. NIST Journal of Research, 1929.
The older NIST study of empirical Rockwell–Brinell relationships, published in 1929, found that tensile strength in steel could often be estimated from Brinell hardness for commercial purposes. “Commercial purposes” is an important qualification. It supports screening, process checks, and approximate material comparison; it does not replace a tensile test where a specification, design calculation, failure investigation, or acceptance decision depends on yield strength, ultimate tensile strength, elongation, or reduction of area.
The approximate Hᵥ ≈ 3σUTS relationship applies only to some high-strength, ductile metallic materials. Limited evidence
A frequently repeated relationship is Hᵥ ≈ 3σUTS for some high-strength, ductile metallic materials, with hardness expressed in a compatible stress unit. Research published in Materials Science and Engineering: A in 2012 associated this approximation with particular material classes and also showed that hardness-to-strength ratios depend on microstructure and indentation morphology. The expression should therefore be treated as a class-specific estimate, not a conversion rule for every carbon or alloy steel.
Why one number cannot represent every steel
| Grade or condition | Why the relationship can differ |
|---|---|
| AISI 1045, hot-rolled | Cooling history and structure affect response |
| AISI 1045, normalized | Finer ferrite–pearlite structure |
| AISI 1045, annealed | Softer, potentially coarser structure |
| AISI 1045, quenched and tempered | Martensite and tempering condition govern response |
| AISI 1045, surface hardened | Surface and core may have different properties |
Steel grade describes chemistry and specification, not a single mechanical condition. AISI 1045 can be supplied as hot-rolled, normalized, annealed, quenched and tempered, or surface hardened. Each condition changes phase distribution, grain size, residual stress, and deformation behavior. The same nominal grade can therefore have different hardness-to-strength relationships. A surface reading on carburized 8620 may describe a martensitic case, while a deeper reading describes a lower-carbon core; one converted number cannot represent both regions.[4] Hardness Tests and Hardness Number Conversions. SAE International. SAE technical report, 1967.
The SAE technical report Hardness Tests and Hardness Number Conversions (1967) states that precise conversions must be developed for the particular steel composition, heat treatment, and part because size, mass, composition, and processing influence the relationship. This is especially relevant to weldments, forgings, heat-affected zones, and components with strong thermal gradients.
Research reported in Materials Today: Proceedings in 2023 found a generally linear empirical relationship between Brinell hardness and tensile-strength parameters for historical and contemporary unalloyed structural steels in the raw or normalized condition. That result is useful precisely because its boundaries are stated. It should not be transferred without validation to quenched-and-tempered tool steel, precipitation-hardened stainless steel, bainitic plate, or a heavily cold-worked product.
The practical rule is simple: a conversion is meaningful only within the material family, condition, test range, and geometry for which the relationship was developed. If a decision depends on tensile properties, perform a tensile test. If a converted hardness value must be reported, retain the directly measured scale, identify the conversion standard or equation, state the material condition and range, and label the result as approximate.
The Hardness Scales Used for Steel
Dynamic rebound hardness Hardness inferred from the ratio of impact and rebound velocities rather than from a static indentation.
Steel hardness is reported on several scales because no single test suits every section, surface, or microstructure. The result may come from a large static indentation, a small diamond impression, or a dynamic rebound event. Those measurements are not interchangeable by definition. A value measured as HRC is not the same physical quantity as a value reported as HBW, even when a conversion table assigns them approximately equivalent numbers.
Scale-selection checks
- Hardness range Choose a scale suited to the expected steel hardness.
- Section thickness Ensure the part can support the indentation without flexure.
- Surface finish Prepare a surface suitable for depth or optical measurement.
- Support Use a rigid, stable backing and control curvature.
- Microstructure Consider cases, weld zones, and local gradients.
Scale selection depends on expected hardness, section thickness, surface finish, support beneath the test location, and whether the steel contains local gradients from carburizing, nitriding, welding, or tempering. A thin part can bend or yield under a large indenter. A rough surface can add error to a shallow depth measurement. A microscopic case layer may be averaged with its softer core if the impression is too large.

Brinell hardness: HBW and large impressions
| Method | Indenter or principle | Typical use or limitation |
|---|---|---|
| Brinell | Carbide ball and measured impression diameter | Large, representative sections |
| Rockwell | Depth under minor and major loads | Fast production checks; sensitive to support and surface condition |
| Vickers | 136-degree diamond pyramid and measured diagonals | Small regions, welds, and hardness traverses |
| Knoop | Elongated diamond impression | Very thin layers and narrow regions |
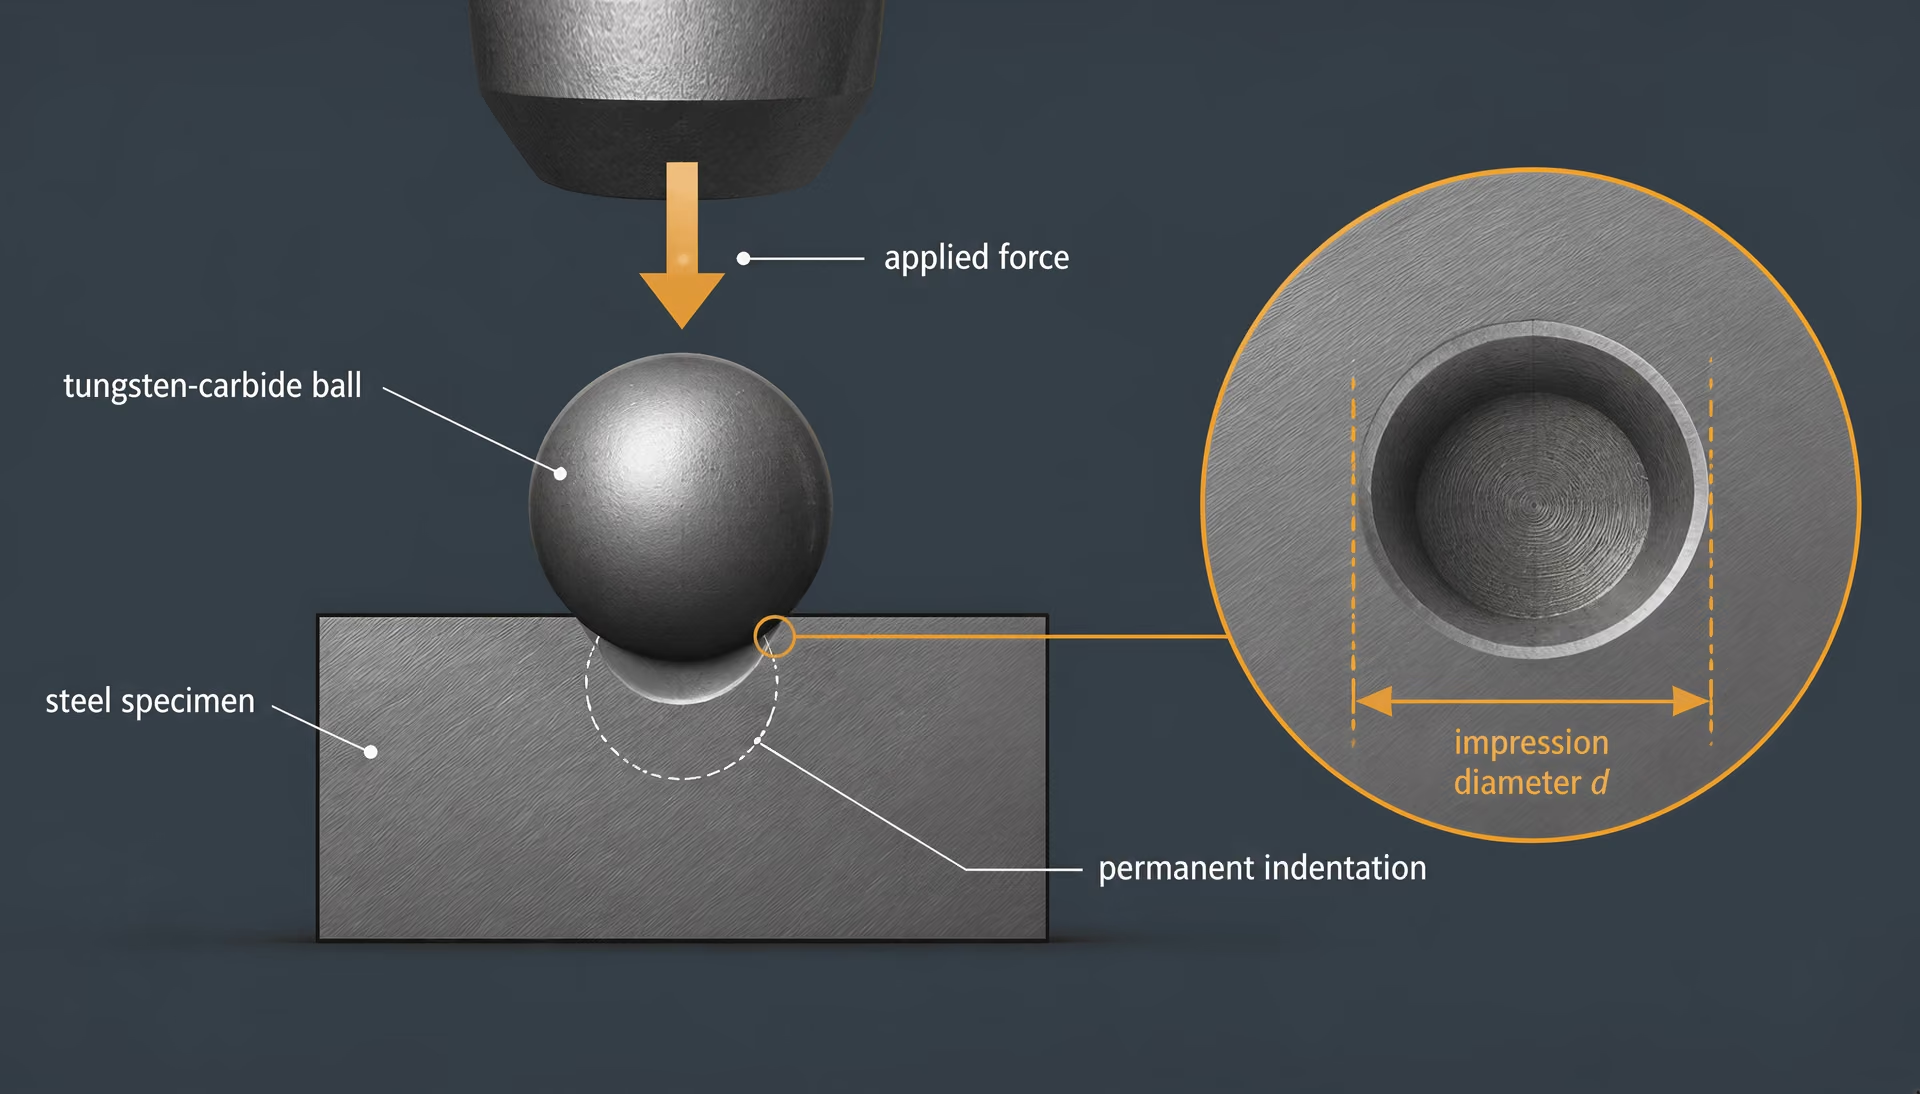
The Brinell method presses a hard ball into the steel with a specified force, then measures the diameter of the permanent, roughly circular impression. Modern designations use HBW, where the W identifies a tungsten-carbide ball. A complete result can be written, for example, as 220 HBW 10/3000, meaning a Brinell hardness of 220 obtained with a 10 mm ball and a 3000 kgf nominal force. The test standard is ASTM E10; ISO 6506 uses the same basic method.
| Nominal force | Context |
|---|---|
| 500 kgf | Typical steel-testing force |
| 1500 kgf | Typical steel-testing force |
| 3000 kgf | Typical steel-testing force |
Common Brinell balls have diameters of 1, 2.5, 5, or 10 mm. The applied force is selected with the ball diameter and material in mind; forces such as 500, 1500, and 3000 kgf are typical in steel testing. The test machine maintains the force for a specified dwell period, after which the operator or optical system measures the impression diameter. The HBW value is calculated from the force, ball diameter, and impression diameter rather than from indentation depth alone.
The impression is large compared with those made by Rockwell or microhardness tests. That is useful when the steel has ferrite, pearlite, bainite, or tempered martensite distributed over a representative volume, because the result averages several grains and small local variations. It is also a limitation. A 10 mm ball can be unsuitable near an edge, on a thin plate, beside a weld, or across a shallow hardened case. The test location needs sufficient thickness and a rigid backing so that the specimen does not flex or distort during loading. The surface must be reasonably flat and free of scale, decarburization, and deep machining marks.
Brinell testing is widely used for castings, forgings, normalized steels, and other parts where a large representative volume matters. It is less suitable for very hard steel if the ball may deform, for small finished components, and for narrow heat-affected zones. A smaller ball and lower force can reduce the impression, but the result then requires closer control of spacing, thickness, and surface preparation.
Rockwell hardness: HRC, HRB, and superficial scales
Rockwell hardness measures the permanent increase in indentation depth under a minor load followed by a major load. It does not measure the impression diameter. The machine first applies a 10 kgf minor load to establish a reference position, applies the major load, removes the major load while retaining the minor load, and converts the residual depth into a hardness number. On ordinary Rockwell scales, one hardness point corresponds to 0.002 mm of depth change.
HRC uses a 120-degree diamond cone, commonly called a Brale indenter, with a 150 kgf major load. It is intended for harder steels, including quenched and tempered tool steels and many hardened alloy steels. HRB uses a 1/16-inch tungsten-carbide or hardened-steel ball and a 100 kgf major load, making it suitable for softer steels, annealed low-carbon grades, copper alloys, and similar materials. Other ordinary Rockwell scales use different balls or loads, so the letter is essential; “Rockwell 60” without the scale is incomplete.
The Rockwell result is fast because the machine reads depth directly, and the small impression often leaves less visible marking than Brinell. That small contact area also makes the test sensitive to surface roughness, curvature, decarburized layers, and individual hard or soft constituents. The specimen must be thick and rigid enough to resist movement. A reading taken too close to an edge, another indentation, or a support discontinuity can be falsely high or low.
Superficial Rockwell scales use the same depth principle but lower forces for thin sections, small parts, and surface layers. A 3 kgf minor load is followed by a 15, 30, or 45 kgf major load, depending on the selected scale and indenter. Designations such as 30N, 45N, 30T, and 15T identify the force and indenter family; the scale designation must be reported exactly rather than replaced with ordinary HRC or HRB. Superficial tests reduce the risk of penetrating a thin hardened layer or deforming a light section, but they do not automatically provide a more accurate result. The surface still needs suitable preparation, and the affected depth must be large enough relative to the indentation.

Vickers and Knoop microhardness
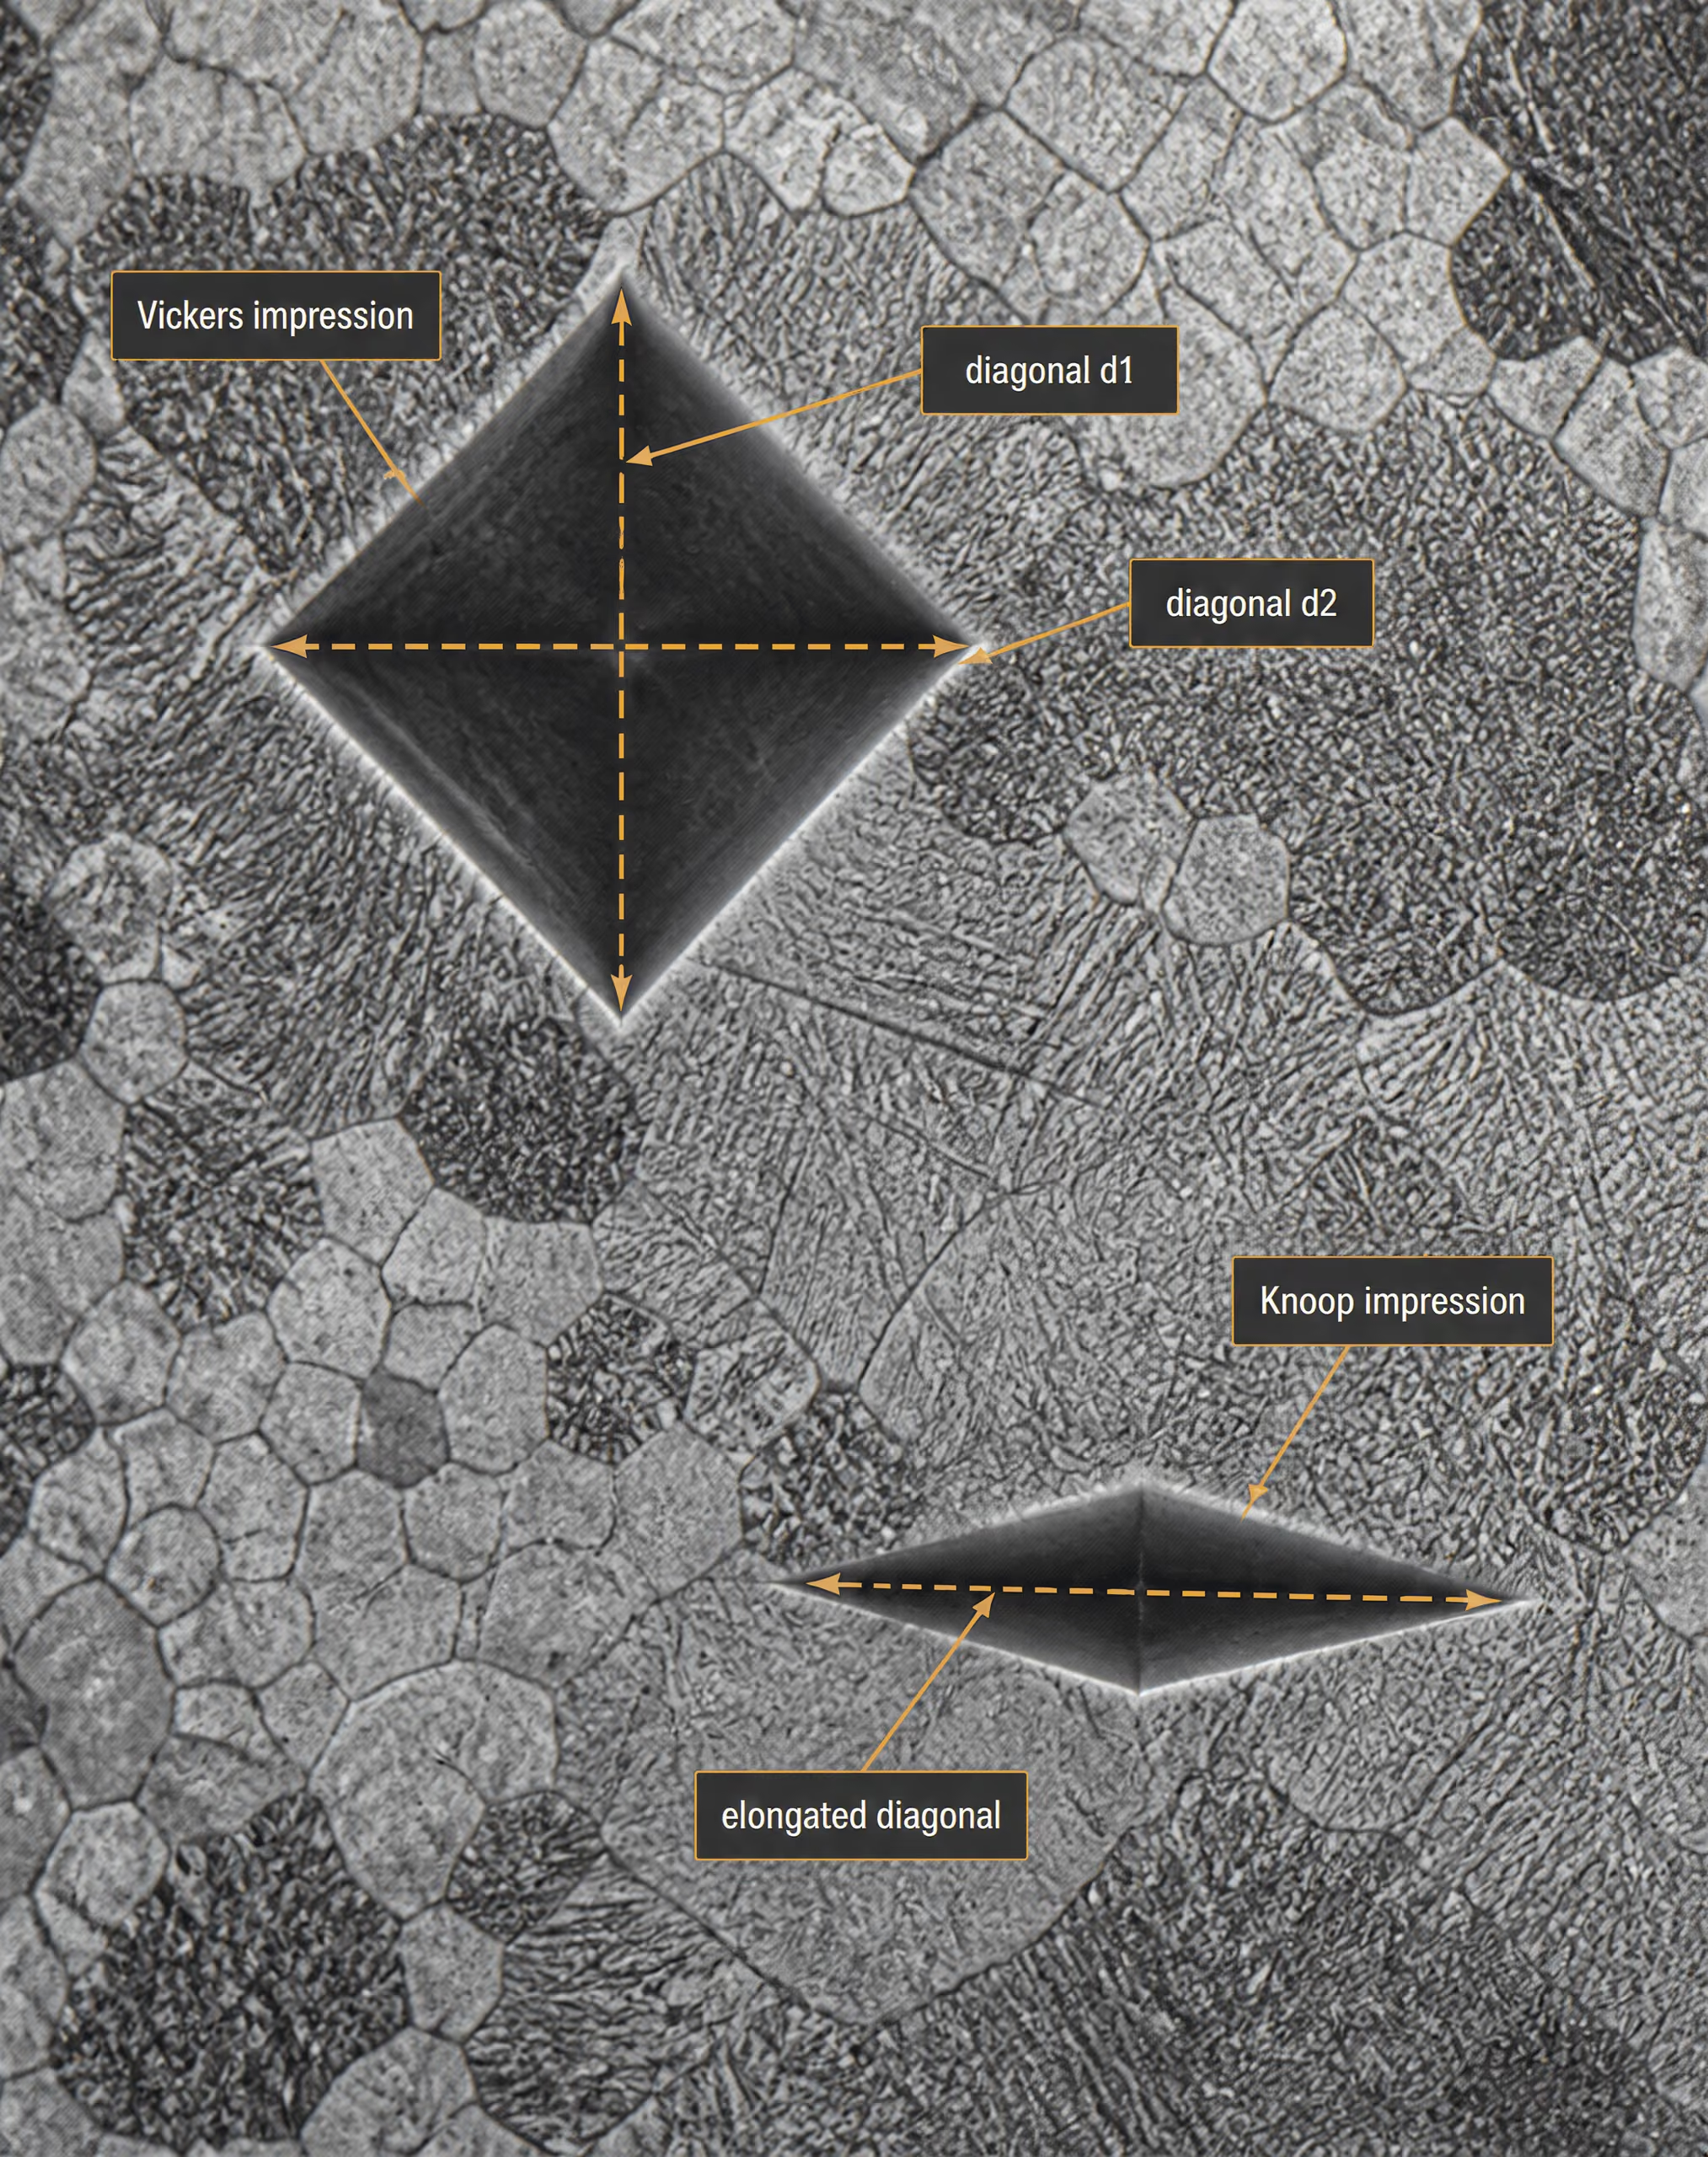
The Vickers method presses a square-based diamond pyramid with a 136-degree angle between opposite faces into the specimen. After unloading, the operator measures the two diagonals of the residual impression optically and calculates HV, or Vickers hardness. Test forces range from microhardness loads of a few grams-force to conventional loads near 100 kgf. A designation such as 600 HV 0.5 identifies the hardness and the 0.5 kgf test force.
Because the diamond does not change shape for the normal range of steel hardness, Vickers can cover soft and very hard steels with one indenter geometry. It is valuable for weld cross-sections, decarburization checks, nitrided layers, carburized cases, and hardness traverses across local gradients. The impression is much smaller than a Brinell impression, so polished preparation and careful spacing are required. At very low loads, surface roughness, elastic recovery, measurement resolution, and individual phases can materially affect the number. The steel must be supported firmly; a thin foil or unsupported edge can bend instead of receiving a valid indentation.
Knoop microhardness also uses a diamond, but its shape is elongated and asymmetrical. The long diagonal of the impression is measured, producing a Knoop hardness value commonly designated HK. Knoop is particularly useful for very thin coatings, narrow case depths, and brittle or small regions because the impression is shallow and elongated. Its geometry makes the result sensitive to orientation, surface preparation, cracking, and the direction of microstructural features. Knoop and Vickers values should not be treated as identical merely because both use diamond indenters.
Leeb and Scleroscope methods
Leeb hardness is a dynamic rebound method rather than a static indentation test. A spring-driven impact body, usually fitted with a tungsten-carbide ball or another specified tip, strikes the surface. The instrument measures the impact velocity and rebound velocity and reports a Leeb value, usually HL, based on their ratio. The resulting contact mark is small, but the reading depends strongly on surface finish, curvature, mass, thickness, support, and impact direction. ASTM A956 covers Leeb testing.
Leeb is useful for large forgings, installed machinery, and locations where a conventional bench tester cannot be positioned. The part must be heavy or firmly coupled to a rigid support; otherwise, vibration absorbs energy and lowers the rebound value. Conversion from HL to HRC, HBW, or another scale requires the correct impact device, direction, and material family. It is not a direct substitute for a static indentation test.
The Scleroscope method also relies on rebound. A diamond-tipped hammer is released from a fixed height inside a vertical tube, and the height to which it rebounds from the steel surface is observed or electronically measured. The result is expressed in Scleroscope hardness units, commonly written as HS. Unlike Brinell or Vickers, it does not calculate hardness from a measured permanent impression. Surface cleanliness, vertical alignment, mass, support, and roughness therefore have major effects.
ASTM E140-12 provides approximate relationships among HBW, HV, Rockwell, superficial Rockwell, Knoop, Scleroscope, and Leeb values for specified metals, including homogeneous carbon, alloy, and tool steels. ASTM states that alloy, grain structure, and heat treatment affect the conversions. ISO 18265:2013 likewise sets principles for conversion and warns that converted values apply directly only to the exact material tested; tensile-strength estimates are the least reliable conversions. Scale choice should therefore produce a valid measured value first. A converted number is secondary evidence, not a replacement for direct testing when steel strength or acceptance depends on it.
ASTM E140 and ISO 18265: What the Standards Permit
Hardness conversion standards do not turn one test result into an equivalent measurement made by another method. They provide empirical relationships between hardness scales, usually expressed as tables. The distinction matters: a measured value is obtained directly by applying a specified indenter, force, dwell time, and procedure to the part; a converted value is calculated from that measurement; and an estimated tensile strength is a further inference from hardness. Each step can add uncertainty.
The scope of ASTM E140-12
ASTM E140-12, Standard Hardness Conversion Tables for Metals, presents approximate relationships among specified hardness scales for specified metals. Its tables include Brinell, Vickers, Rockwell, superficial Rockwell, Knoop, Scleroscope, and Leeb values. The document is not a general equation that makes every hardness scale interchangeable. It is a reference for cases in which the material and test conditions fall within the experience represented by the applicable table.
For steel, the standard includes tables for homogeneous carbon steels, alloy steels, and tool steels. “Homogeneous” is important. A table developed for a reasonably uniform steel cannot be assumed to describe a carburized case, a decarburized surface, a weld heat-affected zone, a banded rolled product, or a part containing a steep hardness gradient. The indenter may sample only a shallow region while the requested conversion implicitly assumes uniform material beneath it.
ASTM International states directly that “the conversions are affected by alloy, grain structure, and heat treatment” (2012). Those variables change the deformation response beneath the indenter. Two steels may have the same Brinell hardness but different proportions of ferrite, pearlite, bainite, martensite, or retained austenite. They may therefore produce different tensile strengths, yield behavior, and results on another hardness scale. Even within one grade, normalized, quenched-and-tempered, annealed, and cold-worked conditions need not follow the same conversion curve.
The tables also depend on the range of hardness covered. A conversion near the middle of a table is not automatically reliable at its upper or lower boundary. Extrapolation is not a permitted substitute for a table entry. Nor should a Rockwell C result be converted to Brinell when the indentation is too close to an edge, another impression, a backing surface, or a weld boundary. A clean numerical output does not correct a poor test.
Scale selection comes before conversion. Brinell is often useful for relatively coarse, heterogeneous, or large-section steel because its large impression averages a broader volume. Vickers can cover a wide hardness range and can be applied at low loads, but small impressions are more sensitive to surface preparation, local phases, and measurement resolution. Rockwell methods are fast and practical for many production checks, while superficial Rockwell scales reduce force and penetration for thinner sections or surface-treated layers. Leeb and Scleroscope methods are dynamic tests whose readings depend strongly on mass, support, orientation, surface condition, and instrument calibration.
Confidence order
- Direct hardness Use the measured result from the specified test method.
- Hardness conversion Infer another hardness scale only within the applicable material and range.
- Tensile-strength estimate Treat the additional inference as the least reliable result.
ASTM E140-12 does not erase those method differences. A table can state an approximate relationship between HRC and HB, for example, but it cannot establish that a particular part was tested correctly or that its microstructure belongs to the population from which the relationship was derived. The reported result should therefore retain the original scale and method. “62 HRC, converted to approximately 700 HV” conveys more information than reporting only “700 HV,” because the first value is measured and the second is inferred.
The same caution applies when hardness is used to infer tensile strength. The NIST study of empirical Rockwell–Brinell relationships, published in 1929, reported that tensile strength in steel can often be estimated from Brinell hardness for commercial purposes. That finding supports practical estimation within an appropriate steel population; it does not establish tensile strength as a universal function of HB. Tensile testing measures fracture-related behavior in a shaped specimen, whereas indentation measures localized plastic resistance under a different stress state.
The principles in ISO 18265:2013
ISO 18265:2013, Metallic materials—Conversion of hardness values, sets out principles for converting hardness values between scales and for estimating tensile strength. The standard treats conversion as conditional on the material, the hardness method, the applicable range, and the evidence behind the relationship. It is therefore closer to a framework for responsible use than to a claim that all scales have one fixed mathematical equivalence.
A central limitation is explicit: “The converted values are directly applicable only to the exact material tested” (International Organization for Standardization, 2013). In practice, “exact material” includes more than a nominal grade designation such as ASTM A36, AISI 4140, or UNS S30400. It includes composition within the relevant limits, product form, grain structure, surface condition, heat treatment, prior deformation, and—in many cases—the specific manufacturing route. A 4140 bar quenched and tempered at 600 °C is not interchangeable with a 4140 carburized gear tooth or an induction-hardened shaft simply because all carry the same base grade designation.
ISO 18265:2013 also identifies tensile-strength estimates as the least reliable conversions. That ranking is metallurgically sensible. Conversion between two indentation scales already depends on how different indenters and loads interact with the same material. Moving from hardness to ultimate tensile strength introduces additional dependence on strain hardening, defects, anisotropy, specimen geometry, and failure behavior. A hardness number may screen for an incorrect heat treatment, but it cannot, by itself, demonstrate compliance with a specified tensile-strength range when that property is a design or acceptance requirement.
A frequently repeated relation illustrates the danger of removing qualifications from the evidence. A 2012 study in Materials Science and Engineering: A identified the approximate relation for some high-strength, ductile metallic materials. Here is hardness expressed in a compatible stress unit and is ultimate tensile strength. The relation is material-class-specific, not a law for all steels. The same study reported that hardness-to-strength ratios depend on material class, microstructure, and indentation morphology. Applying the factor three to a cast iron, a soft annealed low-carbon steel, a precipitation-hardened stainless steel, and a tempered martensitic tool steel would not be defensible without qualification.
There are narrower cases in which an empirical relation is useful. A 2023 study of historical and contemporary unalloyed structural steels found a generally linear relationship between Brinell hardness and tensile-strength parameters for steels in the raw or normalized condition. That result may support a plant-specific or product-family estimate when the tested material remains within the studied population. It does not justify transferring the line to quenched-and-tempered alloy steel, cold-drawn wire, or a weldment.
Approximate tables versus material-specific calibration
A standardized reference table and a qualification correlation answer different questions. ASTM E140-12 asks, in effect, what approximate hardness value may correspond to a measured value for a specified class of metals under the standard’s stated scope. A qualification correlation asks what relationship has been demonstrated for one defined steel, process route, condition, and part.
For example, a manufacturer or laboratory might test normalized 1045 steel from a named mill route, measure Brinell hardness and tensile strength on matched specimens, and fit a regression over the actual production range. The resulting equation may be suitable for that 1045 condition if it is checked against new lots and supported by uncertainty analysis. It should not automatically be applied to induction-hardened 1045, nor should it replace tensile tests when a contract specifies yield or ultimate strength directly.
SAE’s 1967 technical report, Hardness Tests and Hardness Number Conversions, makes this point in practical terms: precise conversions must be developed for the particular steel composition, heat treatment, and part because size, mass, composition, and processing influence the relationship. Part size and mass are especially relevant to dynamic methods and to thin sections that cannot provide adequate support. Surface preparation, curvature, indentation spacing, and backing hardness can also shift the measured value before any conversion is attempted.
A defensible report records the measured hardness, standard and scale, test force or load, indenter, location, surface condition, material grade, and heat-treatment condition. If a converted value is required, it should be labeled as converted and tied to ASTM E140-12 or ISO 18265:2013, including the table or range where practical. If tensile strength is estimated, the report should identify the empirical model, calibration population, scatter, and limits of use.
When the result affects a fracture-critical design, a heat-treatment release, or formal acceptance against tensile properties, direct tensile testing is the appropriate evidence unless a separately qualified procedure has established the correlation. Hardness conversion is valuable for comparison and process control. It is not permission to treat a convenient number as a universal substitute.
Why Steel Grade and Chemical Composition Change the Conversion
A hardness number describes resistance to a particular indenter under a particular loading cycle. It does not identify the steel’s complete strength, ductility, fracture behavior, or microstructure. Two specimens can both measure 200 HBW while reaching that value through very different mixtures of ferrite, pearlite, bainite, martensite, carbides, and retained austenite. Their tensile strengths may differ, and their values on another hardness scale may not match the number suggested by a general conversion table.
This distinction separates measured hardness from converted hardness and from estimated tensile strength. A measured 200 HBW is a result from a defined Brinell test. A value such as 92 HRB obtained from a table is a converted result. A tensile strength inferred from either value is a further estimate, with additional uncertainty. ASTM E140-12, Standard Hardness Conversion Tables for Metals, gives approximate relationships for specified metals and hardness scales, but ASTM states plainly that “the conversions are affected by alloy, grain structure, and heat treatment” (ASTM International, 2012).
Carbon, alloying elements, and hardenability
Carbon changes steel hardness through several linked mechanisms. In a low-carbon ferritic steel, much of the carbon remains in ferrite or forms relatively small amounts of pearlite. Increasing carbon generally increases the pearlite fraction in a slowly cooled structure and raises the carbon content available to form martensite during quenching. Martensite is much harder than ferrite, but its hardness also depends strongly on its carbon content and tempering condition. A quenched 0.40%C steel and a quenched 0.20%C steel therefore cannot be assigned the same tensile-strength relationship merely because a surface reading happens to be similar.
Hardenability The ability of a steel to develop martensite to a given depth under a specified cooling condition; it is not the same as the maximum hardness.
Alloying elements alter both the phases present and the path by which they form. Manganese, chromium, molybdenum, and nickel can delay pearlite and bainite transformations, increasing hardenability—the depth to which a steel can develop martensite under a specified cooling rate. AISI 1045 may produce a hard martensitic surface and a softer ferritic-pearlitic core in a section that cools rapidly at the surface. AISI 4140, with chromium and molybdenum additions, can harden more deeply under comparable treatment. If both parts receive the same nominal quench, their hardness gradients and tensile properties can be different even where one local indentation gives the same HRC value.
The distinction between hardness and hardenability matters in thick sections. Hardenability does not mean that every point becomes equally hard; it means that the steel resists diffusional transformation during cooling. Section size, quenchant, agitation, and part geometry determine the cooling history. SAE’s 1967 technical report, Hardness Tests and Hardness Number Conversions, therefore states that precise conversions must be developed for the particular steel composition, heat treatment, and part, since size, mass, composition, and processing affect the relationship (SAE International, 1967).
Carbides add another source of divergence. Chromium-rich carbides in a tool or stainless steel, vanadium carbides in some high-speed or powder-metallurgy grades, and iron carbides in pearlite do not interact with an indentation in the same way as a uniform martensitic matrix. A high carbide population can raise resistance to indentation while reducing the relationship between hardness and tensile deformation of the matrix. Retained austenite can produce the opposite complication: a specimen may show a high hardness after quenching, yet subsequent transformation during service or grinding can change its dimensions and measured hardness.
Temper treatment also matters. Tempered martensite, bainite, and fine pearlite may occupy overlapping hardness ranges while having different yield-to-tensile-strength ratios and fracture responses. Indentation size, residual stress, work hardening, and anisotropy then influence the reading. The same nominal hardness is not a phase analysis.
Unalloyed structural steels and commercial correlations
A broad hardness–strength trend can still be useful within a restricted steel family. Unalloyed structural steels in the raw or normalized condition often contain ferrite and pearlite whose proportions change with carbon content and cooling history. Historical and contemporary unalloyed structural steels studied in 2023 showed a generally linear empirical relationship between Brinell hardness and tensile-strength parameters in those conditions (Materials Today: Proceedings, 2023). The result explains why Brinell-based strength estimates can work reasonably for a controlled group of ordinary structural steels.
| Grade | Use of hardness result described |
|---|---|
| EN 10025-2 S275JR | Process check or rough screening estimate |
| EN 10025-2 S355JR | Process check or rough screening estimate |
The relationship is empirical, not a physical law. For grades such as EN 10025-2 S275JR and EN 10025-2 S355JR, a hardness reading may support a process check or a rough screening estimate when the material is known to be unalloyed or low-alloy structural steel in the expected supply condition. It cannot establish compliance with the specified yield strength and tensile-strength ranges without the required tensile test. Normalizing refines grain structure and changes the ferrite–pearlite balance; rolling history and segregation can change the result again.
A 1929 NIST study of empirical Rockwell–Brinell relationships reported that tensile strength in steel can often be estimated from Brinell hardness for commercial purposes (NIST, 1929). “Often” is the operative limit. Such an estimate is useful for approximate correlation within the population from which it was derived, not as permission to replace a tensile test across all steel grades.
ISO 18265:2013 establishes principles for converting hardness values between scales and for estimating tensile strength, but warns that converted values are directly applicable only to the exact material tested and identifies tensile-strength estimates as the least reliable conversions (ISO, 2013). Thus, a table entry for HBW to HRC should not be treated as evidence that the converted HRC value predicts tensile strength with equal confidence.
Tool steels, stainless steels, and excluded assumptions
Tool steels and stainless steels expose the limits of general carbon-steel correlations. AISI D2 may contain a substantial population of chromium-rich carbides in a hardened and tempered matrix. AISI H13 may contain tempered alloy martensite after hot-work tool-steel treatment. AISI 420 stainless steel can range from relatively soft annealed material to hard martensitic material after quenching and tempering. Each condition changes indentation response, and none should be assigned a carbon-steel conversion simply because its HRC or HV value falls in the same numerical range.
Austenitic stainless steels such as AISI 304 and AISI 316 present a different problem. Their face-centred-cubic matrix may work harden strongly during indentation, and cold reduction can produce deformation-induced martensite in some compositions. A measured hardness after cold work therefore reflects both initial composition and processing history. Ferritic, duplex, precipitation-hardening, and martensitic stainless grades require separate assumptions because their phase balance and strengthening mechanisms differ.
The often-cited approximation Hᵥ ≈ 3σUTS has been identified for some high-strength, ductile metallic materials, but a 2012 study in Materials Science and Engineering: A stresses that hardness-to-strength ratios depend on material class, microstructure, and indentation morphology (Materials Science and Engineering: A, 2012). It is not a universal conversion for steel.
Direct tensile testing remains necessary when tensile properties control acceptance, design, or failure assessment unless a qualified correlation is approved. Strong evidence
Reports should therefore give the measured scale, test standard, force or ball designation where relevant, location, and material condition. If a converted value is reported, label it as converted and name the governing table or standard. If tensile strength is estimated, label it as an estimate and state the material range supporting it. When acceptance, design allowables, or failure assessment depends on tensile properties, direct tensile testing remains necessary.
Heat Treatment and Microstructure: The Main Sources of Error
Heat treatment is a first-order variable in any hardness relationship. It cannot be treated as a footnote beneath the steel grade. Two specimens with the same nominal chemistry can have substantially different hardness, tensile strength, ductility, and indentation response after annealing, normalizing, quenching, tempering, carburizing, nitriding, or induction hardening. A hardness conversion that ignores condition may produce a precise-looking number with little physical authority.
This distinction matters because three different quantities are often confused. Measured hardness is the result obtained from a specified test, such as 220 HBW or 62 HRC. Converted hardness is an approximate estimate on another scale, such as a Rockwell C value inferred from Vickers hardness. Estimated tensile strength is a further inference from hardness and is less secure than a scale conversion. ASTM E140-12, Standard Hardness Conversion Tables for Metals, gives approximate relationships among Brinell, Vickers, Rockwell, superficial Rockwell, Knoop, Scleroscope, and Leeb scales for specified metals, including homogeneous carbon, alloy, and tool steels. It also states that “the conversions are affected by alloy, grain structure, and heat treatment.”
ISO 18265:2013 makes the same limitation explicit. It specifies principles for converting hardness values between scales and for estimating tensile strength, but states that converted values are directly applicable only to the exact material tested. Its tensile-strength estimates are identified as the least reliable conversions. Those restrictions are especially important when the measured surface does not represent the entire section.
Annealed, normalized, quenched, and tempered conditions
In an annealed steel, slow cooling generally produces a relatively coarse ferrite–pearlite structure, or another softened structure selected for machining and forming. A Brinell indentation in this condition samples a comparatively large volume containing ferrite and pearlite colonies. The resulting hardness often tracks tensile strength reasonably well within a narrow family of low-carbon steels, but the relationship still changes with carbon content, pearlite fraction, colony spacing, and grain size. A low-carbon annealed steel and a higher-carbon annealed steel can have similar-looking test surfaces yet different strength–hardness ratios.
Normalizing changes the comparison. Heating above the critical range followed by air cooling usually produces finer ferrite and pearlite than slow furnace cooling. Grain refinement can raise yield strength and tensile strength without producing the same proportional increase in indentation hardness. The 2023 Materials Today: Proceedings study of historical and contemporary unalloyed structural steels found a generally linear empirical relationship between Brinell hardness and tensile-strength parameters for steels in the raw or normalized condition. That result supports practical estimation within the studied population; it does not make the line transferable to quenched-and-tempered alloy steel or a surface-hardened component.
Quenching creates martensite, often with retained austenite and transformation stresses. Hardness can rise sharply because the indenter encounters a high-strength, shear-resistant phase, but the tensile response also depends on carbon content, prior-austenite grain size, carbide dissolution, retained austenite, and cracking sensitivity. A quenched SAE 1045 specimen and a quenched AISI 4140 specimen may both read near a high Rockwell C value while differing in tensile strength and toughness. Their alloying elements alter hardenability and temper response; the same nominal HRC therefore does not guarantee the same tensile properties.
Tempering decomposes or modifies martensite, reduces residual stress, and changes carbide distribution. Low-temperature tempering can retain high hardness while relieving some quench stress. Higher-temperature tempering lowers hardness but may improve toughness and produce a strength–hardness relationship unlike that of the as-quenched state. A quenched-and-tempered AISI 4140 shaft, for example, should be compared with conversion data for a similar alloy and condition, not with a generic carbon-steel table. Even within one grade, tempering temperature and time can move the material through different combinations of hardness, yield strength, tensile strength, and elongation.
The NIST study of empirical Rockwell–Brinell relationships, published in 1929, reported that tensile strength in steel can often be estimated from Brinell hardness for commercial purposes. “Often” is the operative word. The result describes an empirical population, not a physical law that survives every change in heat treatment. The 1967 SAE technical report Hardness Tests and Hardness Number Conversions likewise emphasized that precise conversions must be developed for the particular steel composition, heat treatment, and part because size, mass, composition, and processing affect the relationship.
Surface hardening and through-thickness gradients
Carburizing, nitriding, and induction hardening make a single hardness value even less representative. Carburizing enriches the surface of a low-carbon steel with carbon, followed by quenching to form a hard martensitic case over a tougher, lower-carbon core. A surface reading may be 60 HRC or higher while the core is far softer. Converting that surface value to tensile strength for the whole component is a category error: the test measures the case, not the load-bearing cross-section as a uniform material.
Nitriding produces a nitrogen-enriched diffusion zone and, near the surface, a compound layer containing iron nitrides such as ε-Fe₂–₃N and γ′-Fe₄N. The layer can be very hard and thin. Conventional Rockwell or Brinell tests may be unsuitable because their penetration and plastic zone extend below the treated region; a micro-Vickers or Knoop traverse is often needed to resolve the hardness profile. Even a microindentation value can be distorted by the substrate if the indentation is too deep relative to the layer thickness.
Induction hardening creates a hardened martensitic zone whose depth depends on frequency, power, scan speed, geometry, and quench conditions. Hardness changes continuously from the surface through the transition region into the softer core. A reported “62 HRC” is incomplete unless the location and measurement depth are stated. The same component can yield different conversions at the surface, at effective case depth, and in the core.
These gradients also affect indentation geometry. A shallow indentation placed over a hard layer may be constrained by the softer material beneath it; a deeper indentation averages several regions. Surface curvature, section thickness, edge distance, and part mass can alter the stress field. ASTM E140-12 tables are intended for the material ranges and test conditions represented by the tables, not for arbitrary case-hardened profiles. ISO 18265:2013’s requirement that a conversion apply directly only to the exact material tested is particularly relevant here.
Grain structure, phases, and indentation morphology
Hardness is a local resistance to indentation, not a direct measurement of tensile strength. The indenter produces elastic and plastic deformation over a finite volume. Grain size, crystallographic texture, phase boundaries, inclusions, carbides, and residual stresses all influence that volume. A fine ferrite–pearlite structure may distribute deformation differently from coarse pearlite. Bainite, martensite, ferrite, retained austenite, and carbide-rich regions can produce similar average hardness values through different deformation mechanisms.
Residual compressive stress can raise the apparent resistance to indentation, while tensile residual stress can reduce it or promote cracking. Grinding burns, decarburization, shot peening, and machining damage can therefore change a surface reading without changing the bulk tensile properties in the same proportion. Indentation placement matters too: an indent over a large carbide, near a phase boundary, or close to a prior indentation may not represent the matrix.
Indentation morphology supplies another warning. Brinell and Vickers methods rely on the size and shape of a permanent impression; Rockwell methods rely on penetration depth. Pile-up around an indent can make the contact area smaller than an idealized analysis assumes, while sink-in makes it larger. In anisotropic, multiphase, or highly work-hardening steels, these effects alter the relation between hardness and flow stress. A peer-reviewed 2012 study in Materials Science and Engineering: A reported that hardness-to-strength ratios depend on material class, microstructure, and indentation morphology. It identified the approximate relationship Hᵥ ≈ 3σUTS for some high-strength, ductile metallic materials, but that expression is material-class-specific, not a universal steel equation.
Accordingly, a report should state the steel grade, heat-treatment condition, test method, scale, location, and any case-depth information. A measured value such as 245 HBW is not interchangeable with a converted value such as 23 HRC, and neither is automatically an estimated tensile strength. When acceptance, fracture risk, or structural design depends on tensile properties, the appropriate response is direct tensile testing or a validated grade-and-condition-specific correlation—not an unsupported conversion from a convenient hardness number.
Brinell, Rockwell, and Vickers Conversion Relationships
Hardness conversion tables do not make HBW, HRC, and HV interchangeable measurements. They report an estimated value on one scale from a measured value on another. The distinction matters because each method applies a different indenter, force, contact geometry, and calculation procedure. A Brinell result such as 220 HBW is measured from the diameter of a relatively large indentation; 220 HBW converted to 21 HRC is a table estimate, not a second Rockwell test.
ASTM E140-12, Standard Hardness Conversion Tables for Metals, gives approximate relationships among Brinell, Vickers, Rockwell, superficial Rockwell, Knoop, Scleroscope, and Leeb scales for specified metals. Its steel tables include homogeneous carbon steels, alloy steels, and tool steels. The qualification is important: ASTM states that “the conversions are affected by alloy, grain structure, and heat treatment.” ISO 18265:2013 likewise establishes principles for conversion between hardness scales and for estimating tensile strength, but says that converted values apply directly only to the exact material tested. A table therefore supports comparison within its stated material and range; it does not establish a physical identity between hardness numbers.
Reading HBW-to-HRC and HRC-to-HBW tables
First identify the actual test and its complete designation. HBW means Brinell hardness measured with a tungsten-carbide ball; the ball diameter and applied force may also be reported, as in 220 HBW 10/3000. HRC means Rockwell C hardness, normally obtained with a diamond cone and a 150 kgf total force under the Rockwell procedure. A bare “HB” or “HR” is incomplete for technical reporting because ball material, ball diameter, Rockwell scale, and test force can affect the result.
To convert 220 HBW to HRC, locate 220 in the HBW column of the applicable ASTM E140-12 or ISO 18265:2013 table and read across to the HRC column. If the row gives 21 HRC, the proper report is approximately 21 HRC converted from 220 HBW, not “21 HRC” as though a Rockwell C test had been performed. Reverse conversion requires the same discipline: start with the measured HRC value, select the correct steel table, and read the corresponding HBW estimate. The reverse lookup will not necessarily reproduce the original number because the tabulated relationship is rounded and may be constructed from a fitted or empirical relationship rather than a reversible equation.
Adjacent entries are not exact equivalents. Suppose a table lists 210 HBW as 19 HRC and 230 HBW as 22 HRC. A measured 220 HBW lies between those rows, but it does not possess both a precise 20.5 HRC and a physically verified Rockwell value. Linear interpolation could produce approximately 20.5 HRC as a reporting aid if the governing standard permits interpolation in that range, yet the result remains an estimate whose uncertainty includes the scatter of the conversion relationship and the uncertainty of the original measurement.
The material class must match the part. A 4140 steel quenched and tempered to a martensitic structure does not necessarily follow the same HBW–HRC relationship as normalized AISI 1020, annealed AISI 1045, or a high-carbon tool steel. The reason is mechanical, not merely tabular: indentation response depends on yield strength, strain hardening, carbide distribution, retained austenite, grain size, residual stress, and deformation around the indentation. SAE International’s 1967 report, Hardness Tests and Hardness Number Conversions, states that precise conversions must be developed for the particular steel composition, heat treatment, and part because size, mass, composition, and processing influence the relationship.
Rockwell testing is fast and convenient for repetitive inspection, but it can be sensitive to conditions that a large Brinell indentation averages over. Thin sections may flex or allow the indentation stress field to interact with the opposite surface. A poorly supported specimen can give a false result. Scale selection also matters: using HRC where HRB is appropriate, or applying a superficial Rockwell scale without identifying its force and indenter, invalidates the comparison. Surface scale, decarburization, roughness, curvature, and inadequate spacing between indents can shift the reading. A converted HRC value cannot correct a bad HBW measurement or compensate for an unsuitable Rockwell setup.
When Vickers provides a useful bridge
Vickers hardness, reported as HV with the test force identified when required, uses a diamond pyramid and calculates hardness from the two diagonals of the impression. Its geometry makes it useful across a wider hardness span than a single Rockwell scale and for conditions where a Brinell ball is too large. A Vickers indentation can examine a small hardened layer, a weld or heat-affected zone, an individual phase region, or a thin section, provided the force, surface preparation, indentation spacing, and optical measurement meet the governing method.
Vickers can act as a bridge when HBW and HRC are separated by scale limitations. For example, a carburized case may be too thin for a conventional Brinell impression and may give unstable results on a standard Rockwell test if the indentation penetrates beyond the case. A low-force Vickers traverse can show the hardness gradient from the surface into the core. That information is more useful than assigning one converted HRC number to a layered structure. The same applies to weld metal and heat-affected zones, where several microstructures may exist within a few millimetres.
Vickers is not automatically more accurate. Its diagonal measurement is affected by surface finish, optical resolution, operator judgment, pile-up or sink-in, and the selected force. Very small impressions magnify measurement error. A locally measured HV value may also sample a carbide, martensite island, or decarburized patch rather than the bulk steel represented by a Brinell indentation. Conversion from HV to HRC or HBW is therefore meaningful only when the table covers the relevant steel class, hardness interval, and test-force conditions.
Hardness-to-strength formulas require still greater caution. A 2012 study in Materials Science and Engineering: A identified the approximate relationship Hᵥ ≈ 3σUTS for some high-strength, ductile metallic materials, while showing that hardness-to-strength ratios depend on material class, microstructure, and indentation morphology. This is not a general equation for carbon and alloy steels. ISO 18265:2013 identifies tensile-strength estimates as the least reliable conversions. A 1929 NIST study found that steel tensile strength can often be estimated from Brinell hardness for commercial purposes, but that finding supports a controlled empirical estimate, not a universal substitution for a tensile test.
Range limits, interpolation, and discontinuities
Use a conversion only inside the table’s stated hardness range and material category. If a table ends at 60 HRC, a measured 64 HRC must not be extrapolated from the final rows. If the part is a precipitation-hardened stainless steel but the table covers homogeneous carbon, alloy, and tool steels, selecting the nearest-looking row does not make the conversion valid. A grade designation alone may also be insufficient: normalized, annealed, quenched, tempered, carburized, and cold-worked conditions can produce different relationships at the same nominal composition.
Interpolation is acceptable only where the standard or an approved procedure supports it and where the surrounding entries form a suitable continuous section. It should be identified as interpolation, with sensible rounding that does not imply unsupported precision. Reporting 21.37 HRC from a Brinell table generally claims more certainty than the source can provide. Report the measured value first, then the converted value and the reference, such as “220 HBW; approximately 21 HRC converted per ASTM E140-12.”
Discontinuities can appear where a table changes material class, Rockwell scale, indenter, or hardness interval. They can also reflect transitions in indentation mechanics rather than an abrupt change in the steel. Do not smooth across such a boundary or average values from separate tables. When acceptance depends on tensile properties, case depth, weld qualification, or a specified grade condition, perform the required direct test. Conversion is a comparison tool; it is not evidence that the unperformed test would have passed.
Hardness and Tensile Strength: A Relationship, Not an Identity
Hardness and tensile strength are related because both depend on a metal’s resistance to plastic deformation, but they are not interchangeable properties. A hardness test makes a small indentation at one location. A tensile test loads a standardized specimen through a much larger volume until yielding, plastic flow, and fracture occur. The two tests therefore sample different material volumes, impose different stress states, and produce different kinds of measurements.
A hardness value may be measured directly on the Vickers, Brinell, Rockwell, Knoop, or another scale. A converted hardness value is calculated from a different measured scale using a published relationship. An estimated tensile strength is a further step: it infers a tensile property from hardness. Each step adds assumptions and potential error. Treating an estimated tensile strength as though it were a tensile-test result is poor reporting practice, especially when a specification, design calculation, or failure investigation depends on yield strength, ultimate tensile strength, or elongation.
What hardness measures mechanically
Hardness is resistance to localized plastic deformation. In a Vickers test, a diamond pyramid is pressed into the surface with a specified force, then the two indentation diagonals are measured. The Vickers hardness number, , is calculated from the applied force and the projected area of the impression. A Brinell test presses a carbide ball into the material and relates the force to the diameter of the resulting indentation. Rockwell testing instead measures penetration depth under defined minor and major loads, with the result reported on a specified scale such as HRC or HRB.
The indenter creates a complex three-dimensional stress field beneath the contact. It includes compressive, shear, and tensile components, and the material near the indentation may experience severe plastic strain. The measured response is affected by work hardening, elastic recovery, friction, indenter geometry, surface preparation, and the size of the plastically deformed zone. It also reflects the material immediately beneath the test surface, not necessarily the average properties of an entire part.
This local character explains why hardness is useful for checking gradients and processing effects. A quenched-and-tempered martensitic layer, a decarburized surface, a weld heat-affected zone, or a carburized case can show a hardness value that differs sharply from the core. Indentation spacing, edge distance, specimen thickness, curvature, and surface roughness can also distort the result. A hardness number without its scale, test method, load, and condition is incomplete. “60” could mean 60 HRC, 60 HRB, 60 HRA, or approximately 60 HV under a stated load; those values are not equivalent.
Tensile strength, by contrast, is the maximum engineering stress reached during a uniaxial tensile test. The specimen is pulled through a gauge length, and the reported ultimate tensile strength, , is calculated from the maximum load divided by the original cross-sectional area. The test captures deformation over a relatively large gauge volume and reveals additional properties, including yield behavior, uniform elongation, total elongation, and reduction of area. A hardness indentation cannot supply those tensile-strain measurements.
The distinction matters in heterogeneous steel. A surface hardness test can be dominated by a thin hardened layer even when the core has a lower tensile strength. Conversely, a coarse-grained region, banded microstructure, inclusion population, or local heat-treatment variation may influence a tensile specimen differently from a small indentation. Hardness and strength may track one another within a controlled production family, but that tracking is an empirical result, not a definition.
The approximate relationship
A frequently repeated rule states:
When Vickers hardness and tensile strength are expressed in compatible units, this relation is sometimes useful as a rough order-of-magnitude comparison. For example, a material with might be associated with a tensile strength near under a relationship of this form. That calculation is not a material certificate and should not be presented as one.
The relationship has been identified for some high-strength, ductile metallic materials. A 2012 study in Materials Science and Engineering: A reported that the hardness-to-strength ratio depends on material class, microstructure, and indentation morphology. Those qualifiers are decisive. The factor of three is not a general equation for all steels, all hardness scales, or all heat treatments. It is not valid simply because the measured number is called Vickers hardness.
Mechanically, the approximation has a plausible basis. Plastic deformation beneath an indenter requires a high representative flow stress, while tensile strength reflects the stress level reached during uniaxial deformation and strain hardening. In a restricted material class with a consistent relationship between representative indentation pressure, flow stress, and tensile response, a near-constant ratio can emerge. Change the deformation mechanism or the strain-hardening behavior, and the ratio changes as well.
The same steel grade can move away from the approximation after different processing routes. Ferrite-pearlite, bainite, tempered martensite, and quenched martensite do not harden under loading in the same way. Retained austenite, carbide distribution, grain size, residual stress, and prior deformation can alter the indentation shape and the tensile curve. A high-carbon tool steel, a low-carbon structural steel, and an austenitic stainless steel may show different hardness-to-tensile-strength ratios even at similar nominal hardness values.[5] Brinell hardness and tensile-strength relationship in unalloyed structural steels. Materials Today: Proceedings authors. Materials Today: Proceedings, 2023.
Published empirical work supports limited, condition-specific use rather than universal substitution. Research reported in Materials Today: Proceedings in 2023 found a generally linear relationship between Brinell hardness and tensile-strength parameters for historical and contemporary unalloyed structural steels in the raw or normalized condition. That result is useful for that material population and condition. It does not establish the same line for quenched-and-tempered alloy steel, cold-worked sheet, case-hardened components, or weldments.
The units also require care. Vickers hardness is conventionally reported as a dimensionless hardness number, although it is related to force per area. Tensile strength is normally reported in MPa or N/mm². Since is approximately , careless mixing of hardness conventions and SI stress units can produce an error of nearly an order of magnitude. A sound report states the equation, units, material population, and uncertainty.
Why tensile-strength estimates are the least reliable conversions
Hardness-scale conversion and tensile-strength estimation are not equivalent tasks. ASTM E140-12, Standard Hardness Conversion Tables for Metals, gives approximate relationships among Brinell, Vickers, Rockwell, superficial Rockwell, Knoop, Scleroscope, and Leeb values for specified metals, including homogeneous carbon, alloy, and tool steels. ASTM International states that “the conversions are affected by alloy, grain structure, and heat treatment.” The tables therefore describe defined empirical populations; they do not turn every hardness value into a universal material property.
ISO 18265:2013, Metallic materials—Conversion of hardness values, specifies principles for converting hardness values between scales and for estimating tensile strength. It also warns that “the converted values are directly applicable only to the exact material tested” and identifies tensile-strength estimates as the least reliable conversions. That ranking follows from the chain of inference. Converting HRC to HV already assumes a relationship between two indentation methods. Estimating from either value additionally assumes a relationship between localized indentation plasticity and large-volume uniaxial deformation.
The NIST study published in 1929 on empirical Rockwell–Brinell relationships observed that tensile strength in steel can often be estimated from Brinell hardness for commercial purposes. This is a practical observation, not a declaration of physical identity. “Often” depends on the steel population, condition, and permitted error. NIST’s observation does not remove the need to validate the relation against tensile data from the relevant grade and processing route.
The SAE technical report Hardness Tests and Hardness Number Conversions, published in 1967, made the same limitation more explicit: precise conversions must be developed for the particular steel composition, heat treatment, and part because size, mass, composition, and processing influence the relationship. A thick forging, a thin strip, and a small heat-treated pin can produce different correlations even when their nominal grades are identical. Geometry changes constraint around the indentation, while mass and section size influence cooling rate and therefore microstructure.
For acceptance decisions, a hardness-derived tensile strength should be labeled as an estimate and accompanied by the measured scale, test standard, location, material grade, heat-treatment condition, calibration population, and expected uncertainty. If a drawing or material specification requires tensile strength, the proper evidence is a tensile test performed to the applicable standard, not a converted number chosen because it appears close to the requirement. Hardness can screen, compare, and monitor. It cannot, by itself, prove the full tensile behavior of a steel part.
Geometry, Size, Mass, and Test Location
A hardness value describes the response of a particular volume of material beneath a particular indenter. It does not describe composition alone. Two specimens cut from the same heat-treated steel can produce different readings when one is thin, lightly supported, curved, rough, decarburized, or measured near an earlier indentation. The measured value may therefore change even though the alloy and heat treatment have not.
This matters before any conversion is attempted. A conversion table can relate a valid Brinell, Rockwell, or Vickers measurement to an approximate value on another scale; it cannot repair an indentation distorted by flexure, vibration, surface damage, or an unsuitable test location. The SAE technical report Hardness Tests and Hardness Number Conversions (1967) specifically emphasizes that precise relationships must be developed for the particular steel composition, heat treatment, and part, since size, mass, composition, and processing affect the result.
Minimum thickness and edge distance
The test piece must be thick enough that the plastic deformation zone beneath the indentation does not reach the opposite surface. If it does, the backing material no longer constrains the indentation in the same way as a bulk specimen. The indenter may penetrate farther, or the contact geometry may change, producing a hardness value that is lower or otherwise biased relative to a sufficiently thick section. The permitted minimum thickness depends on the hardness scale, indenter, applied force, and hardness range; a thin sheet suitable for superficial Rockwell testing may not be suitable for standard Rockwell or Brinell testing.
Small parts create a related problem. A low-mass component can move, tilt, or elastically deform under the test force. Even a small displacement changes the penetration depth in a Rockwell test and can affect the diameter measurement in a Brinell test. The fixture may appear firm while the part itself bends. Thin flanges, narrow ribs, and the walls of hollow sections are especially sensitive.
Distance from an edge also matters. An indentation placed too close to an edge has less surrounding material to resist plastic flow. Material can bulge toward the free edge, and the measured diagonal or indentation depth can depart from the behavior of an indentation in an unrestricted surface. The same issue applies to holes, slots, keyways, and abrupt section changes. A reading beside a machined groove is not automatically representative of the adjacent flat area.
Nearby indentations can interfere as well. Plastic strain from a previous indentation leaves a locally hardened and displaced region. If the next indentation is too close, its size or depth may change. Spacing requirements vary by method and hardness, so the applicable standard must govern rather than a convenient rule of thumb. A sequence of closely placed readings can give a false impression of repeatability because each test is influencing the next.
Support, curvature, and component mass
The supporting anvil is part of the measurement system. A hard, stable, properly seated support limits movement and provides the reaction force needed for a controlled indentation. A compliant backing, trapped scale, burr, paint fragment, or uneven fixture allows local settlement. The indenter then measures the combined response of the steel, the support, and any material between them.
Vibration has a similar effect. Testing beside a press, grinder, or machine tool can disturb the force application or depth measurement. On a light component, the vibration may be amplified by the part’s own flexibility. A reading obtained on a massive block and one obtained on a thin component resting on a flexible fixture are not equivalent merely because both use the same Rockwell scale.
Curvature changes the contact geometry. On a convex surface, the indenter contacts less surrounding material than it would on a plane, and the surface may deflect away from the load. On a concave surface, access and alignment can be equally problematic. The radius of curvature relative to the indentation size is important: a broad, shallow curve may have little effect, while a small-radius shaft or tube can produce a substantial bias. The indenter must be normal to the local surface, not simply aligned with the overall component.
Cylindrical parts also raise questions about location. A reading at the crown of a shaft, near its side, or on a flattened test pad may represent different constraint conditions. If a pad is machined for testing, its removal can expose a different depth and may no longer represent the working surface. The test report should identify the location, orientation, section thickness, and support condition so that later readings can be compared meaningfully.
These restrictions apply to converted hardness and strength estimates with added force. ASTM E140-12, Standard Hardness Conversion Tables for Metals, gives approximate relationships among Brinell, Vickers, Rockwell, superficial Rockwell, Knoop, Scleroscope, and Leeb scales for specified metals, including homogeneous carbon, alloy, and tool steels. ASTM states that “the conversions are affected by alloy, grain structure, and heat treatment.” A geometry-induced error is not removed by selecting a different column in that table.
Surface preparation and decarburization
Surface condition can alter the result before the indenter reaches representative steel. Oxide scale, rust, plating, paint, machining marks, and surface roughness interfere with seating and with the optical measurement of a Brinell or Vickers impression. A rough surface can make the edges of a small indentation difficult to locate, while a loose oxide fragment can collapse under load. The preparation method must remove contamination without changing the metallurgical condition being measured.
Grinding is not automatically harmless. Heavy grinding can generate a heat-affected layer, local tempering, residual stress, or a work-hardened skin. Excessive pressure can create a surface that is harder or softer than the material below it. Cooling, light cuts, and adequate material removal help reduce this risk, but the required depth depends on the process and the component. A polished surface may improve optical measurement while still representing damaged material if the preparation was too aggressive.
Heat treatment can also create intentional or accidental hardness gradients. A carburized case is harder than its low-carbon core, and a shallow indentation may measure only the case. As the indentation becomes larger or deeper, the softer substrate begins to influence the result. A conversion based on homogeneous steel is then unsuitable. Decarburization has the opposite effect: heating in a decarburizing atmosphere can remove carbon from the surface, leaving a soft layer over harder steel. A surface hardness test may consequently fail a specification even when the interior meets it, or appear acceptable if the test force penetrates beyond the layer.
Local measurements require still more care. A weld metal, fusion boundary, and heat-affected zone may contain different microstructures and hardness gradients over very short distances. A conventional Brinell impression can be too large to isolate one zone, whereas a micro-Vickers or Knoop test may resolve the gradient but demand better preparation and spacing control. The report should state whether the value is from the weld metal, the HAZ, the unaffected base metal, or a specified distance from the fusion line.
ISO 18265:2013 establishes principles for converting hardness scales and estimating tensile strength, but states that converted values apply directly only to the exact material tested and identifies tensile-strength estimates as the least reliable conversions. The NIST study of empirical Rockwell–Brinell relationships (1929) found that steel tensile strength can often be estimated from Brinell hardness for commercial purposes; that finding does not make a surface reading from a curved, decarburized part a tensile test. A 2012 study in Materials Science and Engineering: A identified the approximate relation for some high-strength, ductile metals, while showing that the ratio depends on material class, microstructure, and indentation morphology. Geometry and preparation must be controlled first. Otherwise, the conversion adds apparent precision to a measurement that never represented the intended material volume.
Hardness Gradients, Case Depth, and Welded or Processed Steel
A hardness conversion becomes especially uncertain when hardness changes over a few tenths of a millimetre. Carburized, nitrided, induction-hardened, laser-processed, welded, and additively manufactured steels may contain several microstructural regions within the size of one indentation or within the spacing used for routine inspection. A reported “converted tensile strength” then gives a false impression of uniformity. It may describe only the tested surface, an indentation influenced by two zones, or an average that conceals the region controlling cracking, wear, or deformation.
ASTM E140-12, Standard Hardness Conversion Tables for Metals (2012), gives approximate relationships among Brinell, Vickers, Rockwell, superficial Rockwell, Knoop, Scleroscope, and Leeb scales for specified metals, including homogeneous carbon, alloy, and tool steels. Its warning is central here: “The conversions are affected by alloy, grain structure, and heat treatment.” A gradient adds another variable: location. ISO 18265:2013 states that converted values are directly applicable only to the exact material tested, while tensile-strength estimates are the least reliable type of conversion. A local hardness value can therefore be useful for checking a process without being a defensible estimate of the part’s bulk tensile strength.

Case-hardening profiles
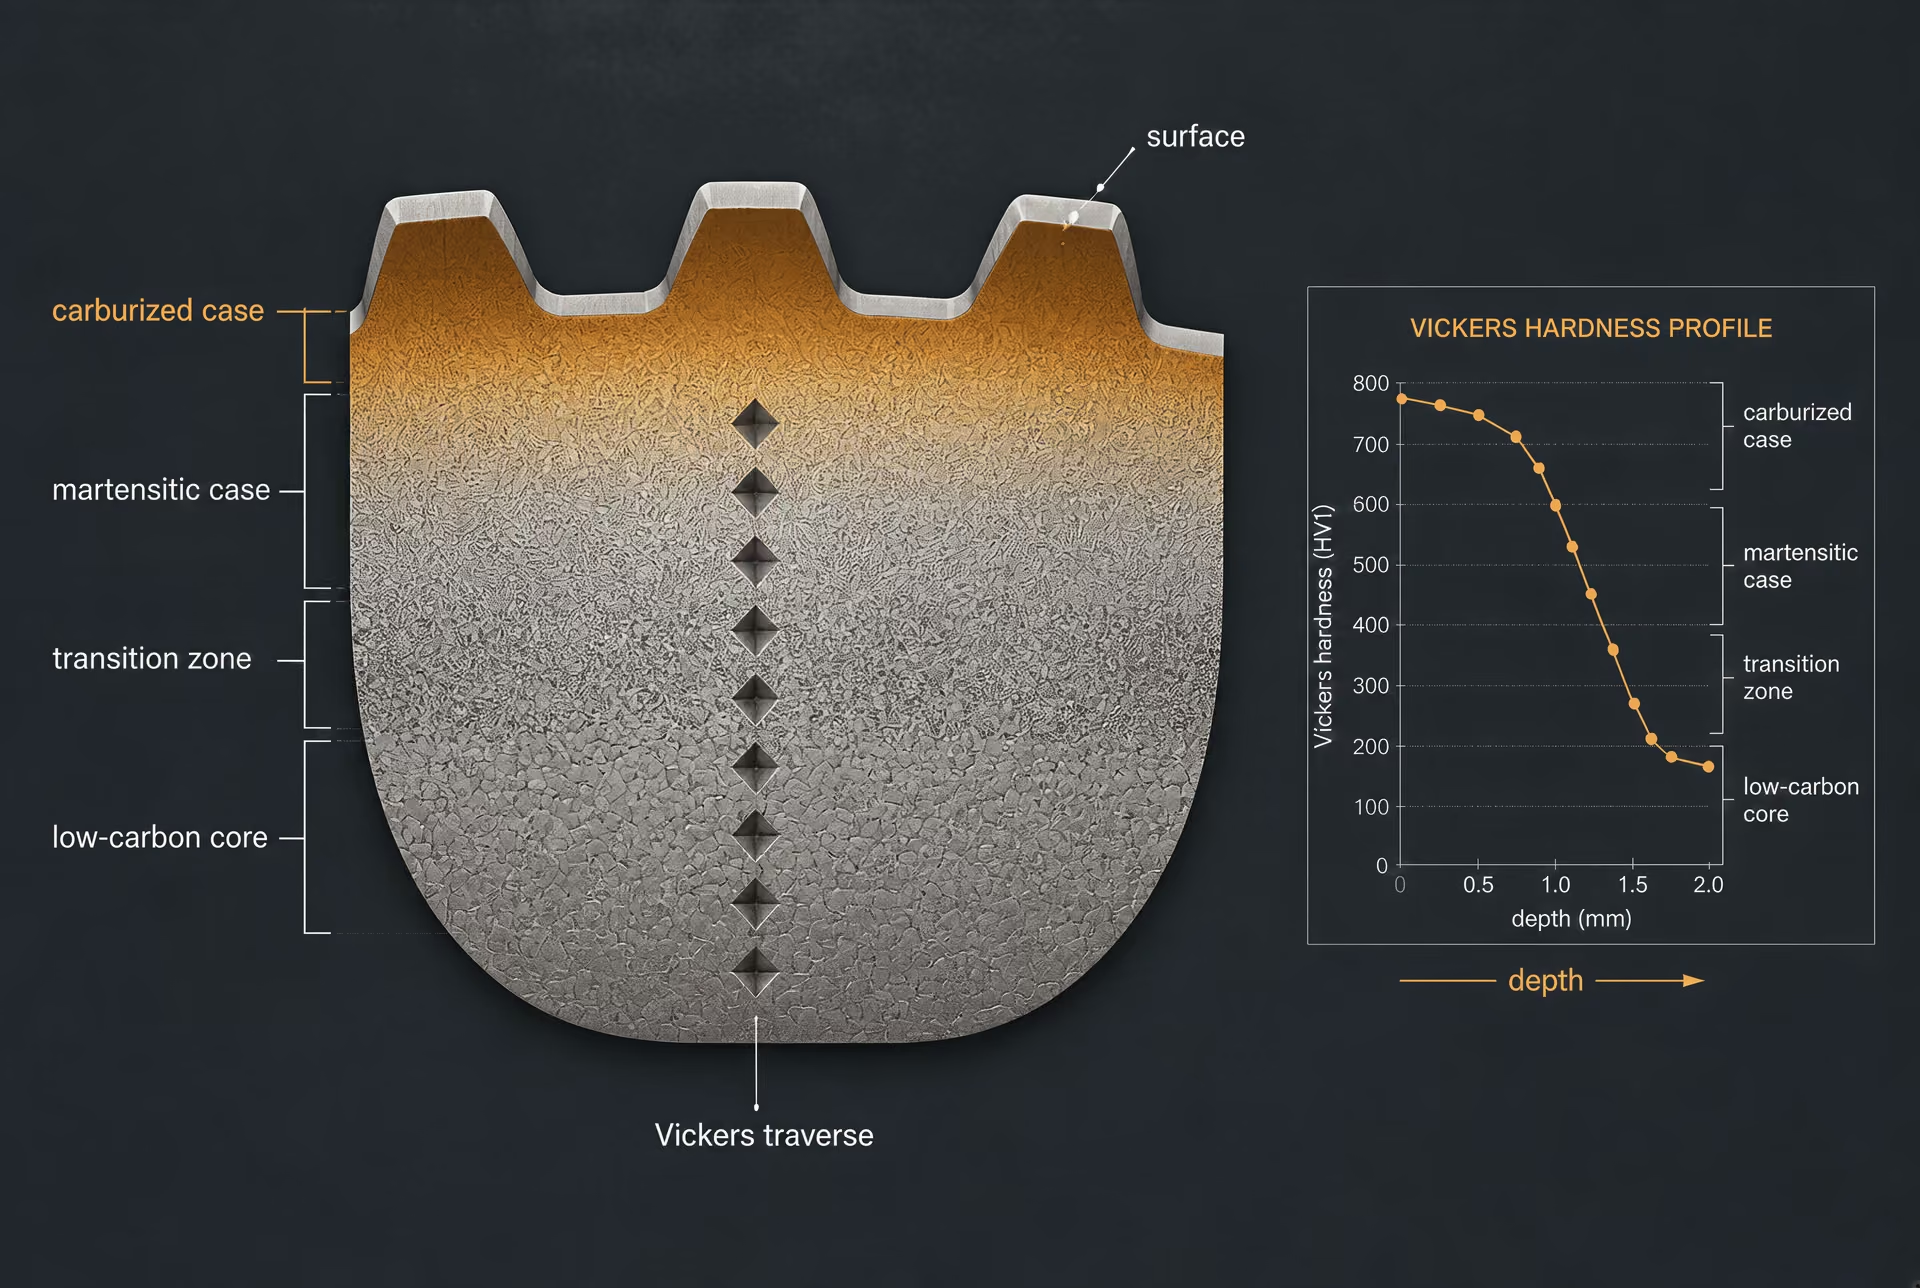
Carburizing creates a carbon-enriched surface that usually transforms to high-carbon martensite after quenching, while the lower-carbon core retains a different hardenability response and toughness. Nitriding produces a compound layer and a diffusion zone whose hardness decreases with depth; the profile depends on steel chemistry, nitriding potential, temperature, time, and prior tempering. Induction hardening produces a rapidly quenched martensitic case over a transition region and a softer core. Laser hardening or laser alloying can create still narrower, irregularly shaped zones, especially where scan overlap, cooling rate, or dilution varies.
Surface hardness and core hardness answer different questions. A measurement near the surface may verify that a carburized case reached a specified hardness, but it cannot stand in for the tensile properties of the low-carbon core. Conversely, a core measurement says little about resistance to contact fatigue or adhesive wear at the working surface. A single Rockwell C result on a thin case is particularly vulnerable to substrate influence: the deformation field extends below the hardened layer, so the softer core can lower the apparent value. Excessive surface curvature, insufficient support, or a rough compound layer can add further error.
A profile is normally made by preparing a cross-section, polishing it carefully, and placing Vickers indents at measured depths from the surface. The test load must produce indentations large enough to measure reliably but small enough to resolve the gradient. Indents placed too far apart miss the transition; indents placed too close interact through overlapping plastic strain fields. ISO 6507-1 and ASTM E384 specify requirements for Vickers and Knoop testing, including limits related to spacing, edges, and measurement. The applicable standard and test force should be recorded rather than reported merely as “microhardness.”
Case depth is not just the depth of the hardest point. An effective case depth is commonly defined by the depth at which hardness falls to a specified limiting value, but the limiting value depends on the product specification, steel, and method. A valid report should identify surface preparation, test force, indenter type, depth origin, indent spacing, hardness scale, and the criterion used for effective depth. A smooth-looking curve does not remove uncertainty; scatter may reflect carbide distribution, retained austenite, local decarburization, or measurement resolution.

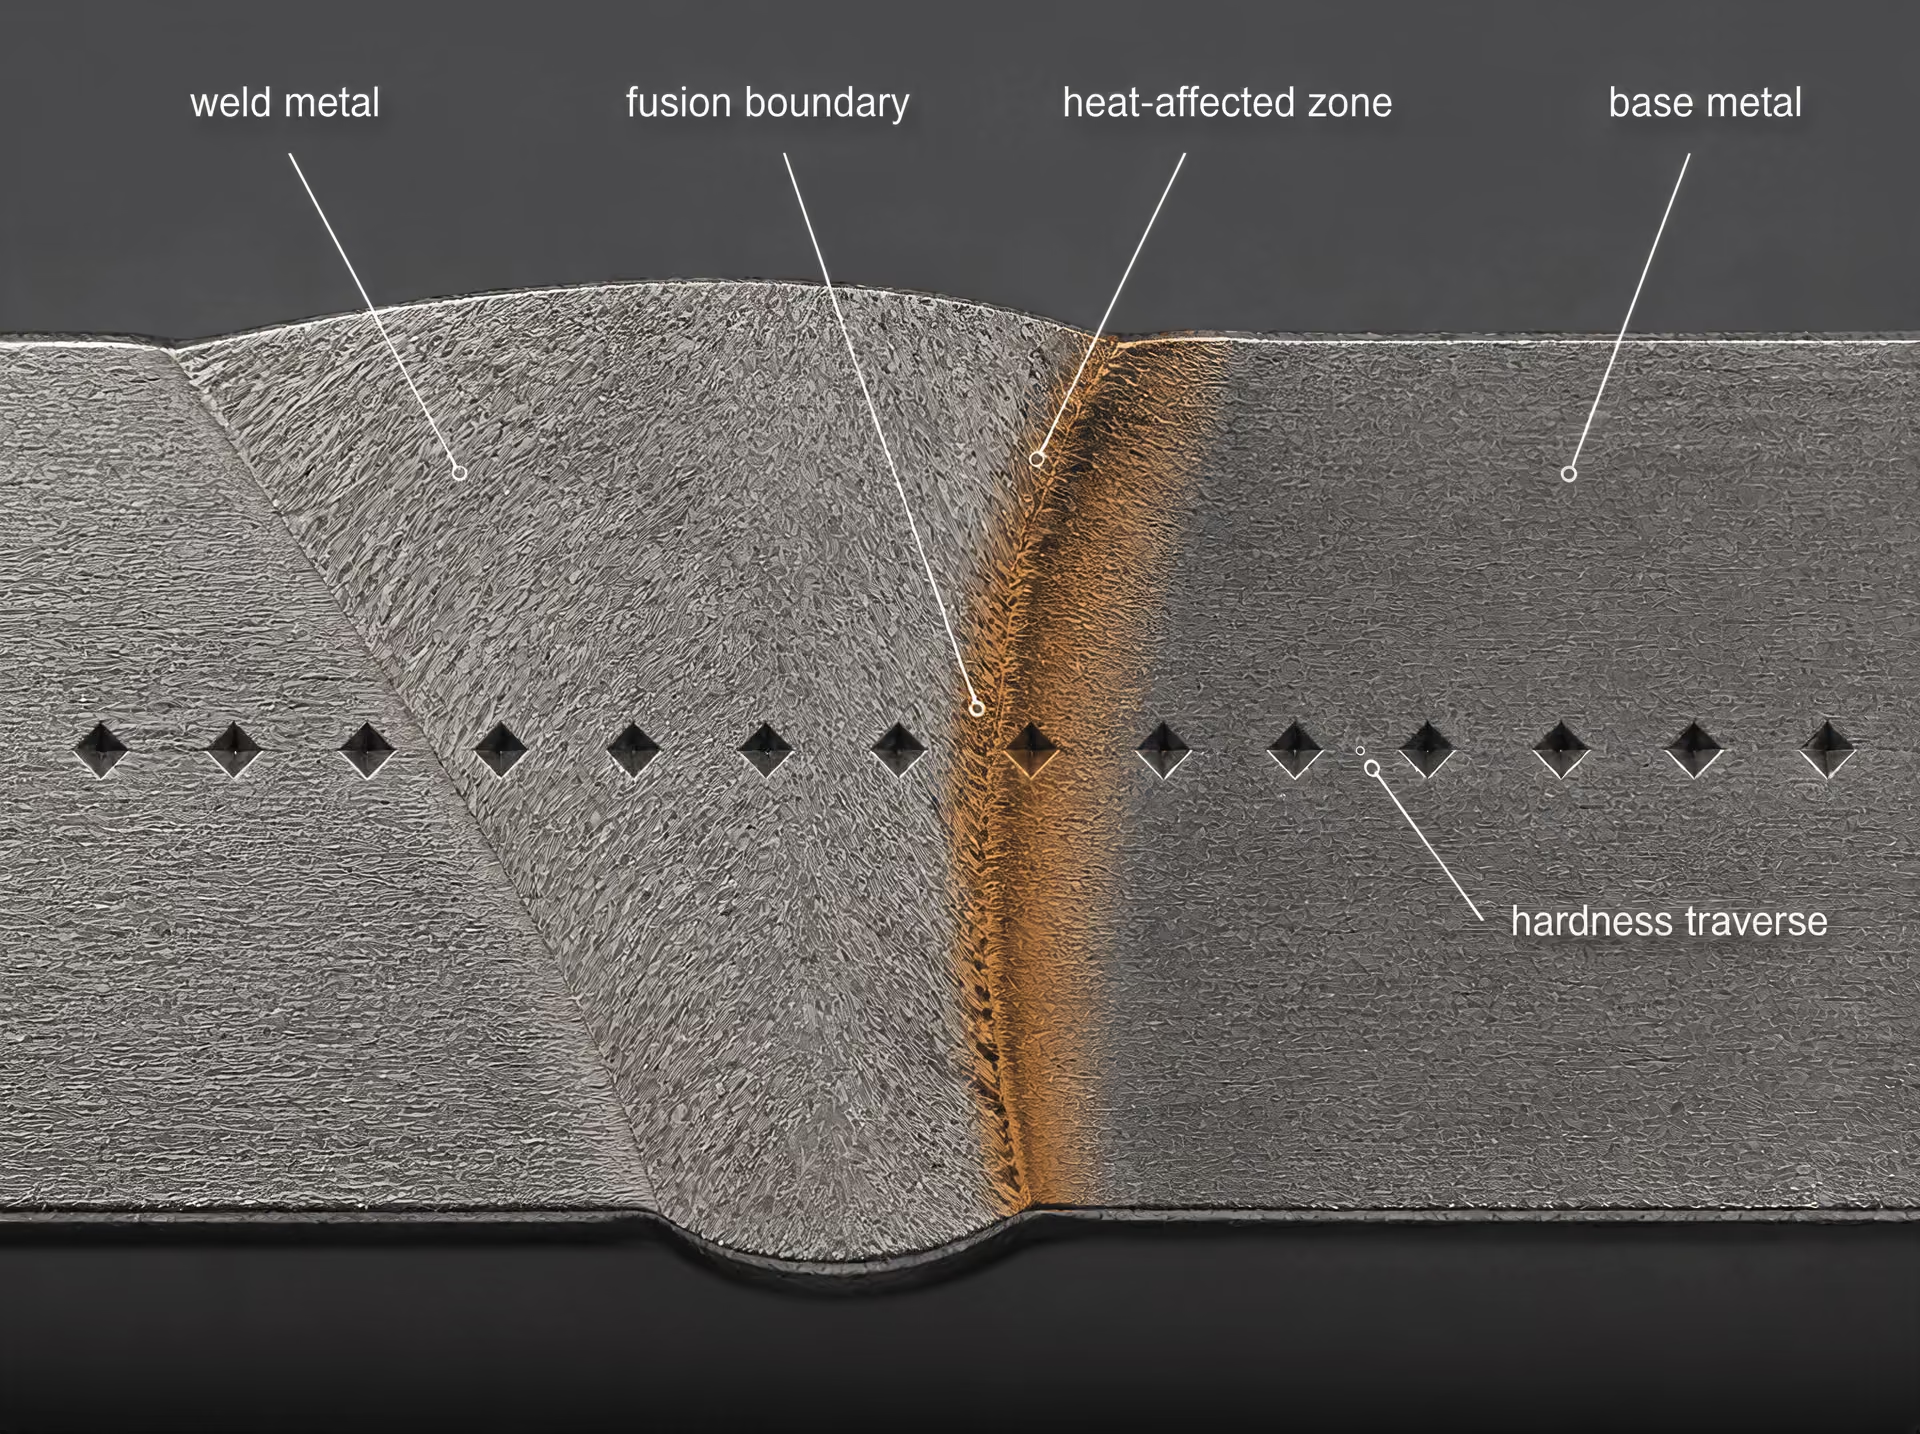
Weld metal and heat-affected zones
A weld cross-section is a sequence of zones rather than one material. Fusion weld metal may differ in composition and solidification structure from the parent plate. Immediately beside it, the heat-affected zone (HAZ) can contain coarse-grained, fine-grained, intercritical, and subcritical regions. In carbon and low-alloy steels, a rapidly cooled coarse-grained HAZ may form hard martensite or bainite, whereas a tempered or intercritical region may be softer and susceptible to local softening. The weld cap, root, fusion boundary, and unaffected base metal can each produce different readings.
Indent position matters. An indent centered on the fusion boundary may sample a mixed deformation field from weld metal and HAZ, so its number cannot be assigned confidently to either zone. The first indent should be far enough from the fusion line and specimen edge to satisfy the governing test standard, yet the row must still be close enough to resolve the narrowest zone. A practical map uses a documented grid or traverse, with closer spacing across the fusion boundary and hardness transitions than in uniform base metal. The exact spacing must follow the selected method and acceptance specification; it should not be chosen solely for convenience.
Weld hardness is often checked for process control, hydrogen-cracking risk, or confirmation of a qualified welding procedure. That purpose does not make it a tensile test. A high local HAZ hardness may signal a martensitic structure and increased cracking susceptibility, while a low value may indicate overtempering or loss of strength. Neither result establishes the tensile strength of the whole welded joint. Joint strength also depends on weld geometry, defects, residual stress, restraint, toughness, and the weakest local region.
Mapping local hardness without false averaging
Hardness mapping should preserve location instead of collapsing every reading into one mean. Record coordinates from a reference surface or weld centreline, identify the microstructural zone, and show individual values or a plotted depth profile. The mean can hide a narrow maximum or minimum: ten readings in soft base metal may overwhelm two critical readings in a brittle HAZ. If an average is required, report the range, standard deviation, number of readings, and exclusion rules alongside it.
The same principle applies to laser-processed tracks and additively manufactured steel. Melt-pool boundaries, layer interfaces, scan rotations, lack-of-fusion defects, porosity, and reheated bands can produce direction-dependent hardness. A surface grid may miss a subsurface band; a cross-section may miss variation along the scan path. Measurements should therefore follow the process geometry in more than one direction when anisotropy is plausible.
Directly measured hardness remains the primary result. A converted Brinell, Rockwell, or Vickers value should be labelled as converted and tied to the specified table, material condition, and test location. The 1929 NIST study found that steel tensile strength could often be estimated from Brinell hardness for commercial purposes, and a 2023 study found a generally linear Brinell relationship for unalloyed structural steels in raw or normalized conditions. Those findings do not validate conversion of a case, HAZ, or additively processed surface into bulk tensile strength. Even the approximate relation Hᵥ ≈ 3σUTS reported in a 2012 Materials Science and Engineering: A study applies to some high-strength, ductile metallic materials, not to every steel or microstructure. When design, acceptance, or failure assessment depends on tensile properties, perform a tensile test on representative material.
How to Choose a Conversion for a Specific Steel
A hardness conversion should begin with the measured result, not with the number required by a specification. Record the original scale exactly—such as 220 HBW, 32 HRC, 410 HV, or 72 HRA—together with the test method, indenter, test force, surface preparation, and measurement location. “Hardness” without a scale is incomplete information. A converted value is not a second measurement; it is an estimate produced from an empirical relationship.
Identify grade, product form, and condition
First identify the steel as precisely as the available records allow. A designation such as AISI 1045, ASTM A36, AISI 4140, ASTM A240 Type 304, or ASTM A681 W1 describes a material family, but it does not by itself establish the hardness relationship. Chemistry within a specification range can alter response to indentation, and two products with the same nominal grade may have different carbon distributions, grain sizes, inclusions, or retained phases.
Record the product form: plate, sheet, bar, wire, tube, forging, casting, weldment, or machined component. Thickness and local section size matter because the indentation must be supported by enough material. A Brinell indentation in a thick 4140 steel forging samples a larger volume than a Vickers impression near the surface of a 1 mm sheet. The two results may not represent the same microstructural region, even if both are reported as hardness numbers.
Condition is equally important. State whether the material is annealed, normalized, quenched and tempered, precipitation treated, cold worked, carburized, nitrided, induction hardened, or otherwise surface treated. For example, normalized AISI 1045 and quenched-and-tempered AISI 1045 can have different ferrite–pearlite or martensitic structures and therefore different hardness-to-tensile-strength relationships. A carburized AISI 8620 component may show high surface hardness while its core remains much softer. A conversion based on homogeneous steel is not a sound description of that gradient.
The record should also identify whether the test was taken on a ground, polished, decarburized, oxidized, plated, or shot-peened surface. Surface layers can dominate a shallow Vickers, Knoop, or Rockwell superficial result. Conversely, a large Brinell impression may average the surface layer with the underlying core. If the measured location is near a weld, heat-affected zone, edge, hole, or bend, that location belongs in the result.
ASTM E140-12, Standard Hardness Conversion Tables for Metals, states that “the conversions are affected by alloy, grain structure, and heat treatment” (ASTM International, 2012). That warning is a selection rule, not merely a general qualification. A table entry for homogeneous carbon, alloy, or tool steels should not automatically be applied to a case-hardened layer, a duplex microstructure, or a weld zone.
Match the original and target scales
Next determine what the target value is meant to communicate. Converting 32 HRC to approximately 300 HBW is a scale-to-scale comparison. Converting 32 HRC to an estimated tensile strength is a different and less reliable operation. The first should be reported as converted hardness; the second should be reported as an estimated tensile strength, with its basis and limitations.
Choose the test scale from geometry and material condition before choosing a conversion table. Brinell, specified by ASTM E10 or ISO 6506-1, is often suitable for sufficiently thick, relatively homogeneous steel because its larger impression averages local variation. It is poorly suited to a narrow section, a thin wall, a small radius, or a surface close to an edge. Rockwell scales, covered by ASTM E18 or ISO 6508-1, provide rapid results, but the selected scale must suit the material hardness and thickness. Rockwell C is not a general substitute for every steel test; softer steels may require Rockwell B, while thin sections or shallow hardened layers may require a superficial Rockwell scale.
Vickers testing under ASTM E384 or ISO 6507-1 is useful when the available area is small or when hardness must be traversed through a case depth or weld. Knoop testing can be preferable for very thin layers or narrow regions because its elongated impression permits localized measurement. Portable Leeb testing can help with large components that cannot be brought to a fixed machine, but surface condition, component mass, curvature, support, impact direction, and calibration affect the result. A Leeb-to-Rockwell conversion should therefore be tied to the permitted Leeb device and the material class, not treated as interchangeable with a direct Rockwell test.
Indentation mechanics also limit the comparison. Different scales impose different indenter shapes and forces, producing different plastic zones. A conversion works only to the extent that the tested steel behaves like the materials used to establish the relationship. A high hardness value near the upper limit of one scale may not convert reliably to another scale, even when both readings are technically within their nominal ranges.
The relationship between hardness and tensile strength is especially conditional. A 2012 study in Materials Science and Engineering: A identified the approximate relation for some high-strength, ductile metallic materials, but also reported that hardness-to-strength ratios depend on material class, microstructure, and indentation morphology. The expression is not a universal steel equation. Likewise, a 2023 study of historical and contemporary unalloyed structural steels found a generally linear relationship between Brinell hardness and tensile-strength parameters for steels in the raw or normalized condition. That finding does not establish the same relationship for quenched-and-tempered 4340, nitrided 4140, or a martensitic tool steel.
Check the standard's scope and range
After identifying the material and selecting the scales, read the scope and notes of the applicable standard. ASTM E140-12 gives approximate relationships among Brinell, Vickers, Rockwell, superficial Rockwell, Knoop, Scleroscope, and Leeb values for specified metals, including homogeneous carbon, alloy, and tool steels. The table must cover both the relevant material category and the measured hardness range. Do not extrapolate beyond its endpoints merely because the numerical trend appears smooth.
ISO 18265:2013 establishes principles for converting hardness values between scales and for estimating tensile strength. It states that converted values are directly applicable only to the exact material tested and identifies tensile-strength estimates as the least reliable conversions. This makes the grade, condition, and product history essential evidence when an ISO table is cited.
Published tables are most defensible when the steel is compositionally and metallurgically similar to the population behind the table, the test lies well within the stated range, the specimen geometry satisfies the original method, and the result is not being used as a tensile-property certificate. A table conversion may be adequate for process monitoring or a preliminary comparison. It is not adequate by itself when a contract, safety assessment, or design calculation depends on yield strength, ultimate tensile strength, or fracture performance.
For critical decisions, perform a laboratory correlation. Test representative pieces—or adjacent specimens from the same heat, product form, thickness, and heat-treatment batch—using the original hardness method and the desired target method or tensile test. Paired measurements should cover the actual operating range, include repeated readings, and be analyzed with prediction limits rather than a single fitted line. The SAE technical report Hardness Tests and Hardness Number Conversions (1967) makes the central point directly: precise conversions must be developed for the particular steel composition, heat treatment, and part because size, mass, composition, and processing affect the relationship. A NIST study from 1929 found that steel tensile strength could often be estimated from Brinell hardness for commercial purposes, but that result supports practical estimation, not a universal law.
Report the original measured value first, followed by the converted value, table or model used, material condition, and an uncertainty or qualification. For example: “Measured 32 HRC; approximately 302 HBW using ASTM E140-12 for alloy steel, subject to the table’s range and material limitations.” If tensile strength is inferred, label it explicitly as estimated. When the property controls acceptance or design, perform the tensile test itself.
Validation, Uncertainty, and Acceptance Decisions
A hardness conversion is defensible only when its basis resembles the material being evaluated. The relevant comparison is not between an isolated hardness number and a table value; it is between measured hardness and measured tensile behavior from material sharing the same grade, heat treatment, section size, and manufacturing history. A conversion developed from normalized plate should not automatically be applied to quenched-and-tempered bar, cold-worked sheet, carburized parts, or weld-affected material, even when the nominal chemical grade is identical.
Paired testing and regression
Validation starts with paired specimens or paired locations from representative material. Measure hardness using the specified method—such as Brinell, Rockwell, or Vickers—and perform tensile tests according to the governing tensile standard on material taken from the same heat, product form, orientation, thickness range, and processing route. The test plan should preserve the condition that matters in service: a 42CrMo4 bar in the quenched-and-tempered condition is not represented adequately by unrelated annealed 42CrMo4, and ASTM A36 plate should not be grouped with a higher-strength normalized structural grade merely because both are carbon steels.
The hardness procedure must be controlled before fitting any relationship. Record the scale, indenter, test force, dwell time, surface preparation, test spacing, and distance from edges or curvature. ASTM E140-12, Standard Hardness Conversion Tables for Metals, covers approximate relationships among Brinell, Vickers, Rockwell, superficial Rockwell, Knoop, Scleroscope, and Leeb hardness values for specified metals, including homogeneous carbon, alloy, and tool steels. ASTM states that “the conversions are affected by alloy, grain structure, and heat treatment.” That statement is a limitation on the table, not a minor qualification.
Prediction interval An interval expressing the expected range for an individual future result, including both model uncertainty and material-to-material scatter.
A regression can then relate the measured quantities. Depending on the data, a linear model may be suitable over a restricted range:
where is measured tensile strength and is measured hardness on a stated scale. A nonlinear model, a grade-specific model, or separate models for different heat treatments may be necessary. The model should be fitted to paired observations, not to hardness values copied from a conversion table. Report the number of heats, specimens per heat, hardness range, tensile range, coefficient estimates, residual standard deviation, and confidence intervals for the fitted mean and for an individual prediction.
The distinction between those intervals matters. A confidence interval around the mean predicted tensile strength describes uncertainty in the estimated average relationship. An individual prediction interval also includes specimen-to-specimen scatter, so it is wider. Acceptance decisions concern individual material, not an abstract mean. A narrow regression line can therefore coexist with a prediction interval too wide to support a specification limit.
Bias must be checked separately from scatter. If converted tensile strength is consistently higher than direct tensile results, the conversion has positive bias and may falsely accept weak material. Compare residuals across hardness, heat, section thickness, orientation, and heat-treatment batch. A residual plot can reveal curvature, changing variance, or a cluster associated with one furnace load. A single overall correlation coefficient will not expose those effects.
Outliers require investigation rather than automatic deletion. An extreme result may come from a mislocated indentation, poor surface preparation, a tensile-specimen defect, transcription error, or genuine segregation and microstructural variation. Excluding it is justified only with a documented technical reason and, where possible, a repeat test. Otherwise, the outlier is part of the relationship that the acceptance procedure must withstand.
The historical evidence explains why restricted models can work. A 2023 study in Materials Today: Proceedings found a generally linear empirical relationship between Brinell hardness and tensile-strength parameters for historical and contemporary unalloyed structural steels in the raw or normalized condition. That finding does not establish the same line for alloyed, quenched-and-tempered, precipitation-hardened, carburized, or heavily cold-worked steels. Likewise, a 1929 NIST study reported that steel tensile strength can often be estimated from Brinell hardness for commercial purposes, but an estimate useful for screening is not a universal material law.
Repeatability, reproducibility, and uncertainty
Repeatability describes variation when the same operator uses the same instrument and method on sufficiently similar locations under closely controlled conditions. Reproducibility is broader: it includes changes in operator, instrument, laboratory, day, or testing setup. These components should not be confused with scatter in the hardness-to-strength relationship.
For example, five repeated Vickers indents may show little variation, indicating good repeatability, while direct tensile results from nominally similar specimens vary substantially because of ferrite-pearlite spacing, martensite tempering, banding, inclusions, or local segregation. Conversely, a stable material may show poor repeatability because the surface is rough, the part is too thin, the indentation is too near an edge, or the indenter or force verification is defective. The first problem belongs to the conversion model; the second belongs mainly to the measurement system.
An uncertainty budget should include calibration, instrument resolution, operator and laboratory effects, surface and geometry effects, sampling, and the residual variation of the empirical relationship. A converted result is therefore not simply “measured hardness ± instrument uncertainty.” It contains uncertainty from the conversion itself. ISO 18265:2013 specifies principles for converting hardness values between scales and for estimating tensile strength, while warning that “the converted values are directly applicable only to the exact material tested.” It also identifies tensile-strength estimates as the least reliable conversions.
Sampling often dominates the result. One hardness indentation samples a small volume, whereas a tensile specimen samples a much larger and differently oriented volume. Several readings from one convenient surface do not represent an entire forging, plate, weldment, or coil. Sampling should cover heats, locations, thicknesses, and orientations that the production process can generate. If a relationship is validated only on centerline material, it should not silently govern surface-hardened or decarburized regions.
The same caution applies to simple formulas. A 2012 study in Materials Science and Engineering: A identified the approximate relationship for some high-strength, ductile metallic materials. The hardness-to-strength ratio nevertheless depends on material class, microstructure, and indentation morphology. Treating that expression as a general steel equation can produce a precise-looking result with no defensible uncertainty statement.
When conversion is unsuitable for acceptance
Conversion is unsuitable when the specification requires tensile strength and the conversion has not been validated for the exact product and condition. Direct tensile testing, performed by the governing material standard, should control whenever acceptance depends on yield strength, tensile strength, elongation, reduction of area, or a related tensile property. A converted value can support process monitoring, sorting, or investigation, but it should not replace the acceptance test merely because hardness is faster.
Particular caution is required near a specification boundary. Suppose a material standard requires a minimum tensile strength of tensile strength , and a hardness table produces an apparently exact equivalent. The table does not transform that minimum into an exact hardness limit. Rounding, model bias, prediction uncertainty, and sampling variation can move material across the boundary. A hardness value marginally above the converted threshold may therefore have a meaningful probability of failing the direct tensile requirement; a value marginally below it may not prove failure.
The governing standard also controls whether conversion is permitted at all. ISO 18265:2013 and ASTM E140-12 provide principles or tabulated approximate relationships, not a blanket authorization to substitute one test for another. SAE’s 1967 technical report, Hardness Tests and Hardness Number Conversions, likewise emphasizes that precise conversions must be developed for the particular steel composition, heat treatment, and part because size, mass, composition, and processing influence the relationship.
Acceptance procedures should state whether a reported number is measured hardness, converted hardness, or estimated tensile strength. Those labels must not be collapsed. If a screening conversion indicates a possible failure, perform the specified direct test or an approved investigation. If tensile results are unavailable, report the conversion with its source, material scope, uncertainty, and limitations rather than presenting it as a guaranteed tensile property.
Common Errors in Hardness-Conversion Tables
Hardness-conversion tables are useful only when the measured value, material, condition, and test method fall within the basis of the table. A converted result is not a second measurement. It is an estimate derived from an empirical relationship, usually with scatter that increases when the material or test conditions differ from those used to establish the relationship.
ASTM E140-12, Standard Hardness Conversion Tables for Metals, gives approximate relationships among Brinell, Vickers, Rockwell, superficial Rockwell, Knoop, Scleroscope, and Leeb scales for specified metals. Its scope includes homogeneous carbon steels, alloy steels, and tool steels, but the tables do not erase differences among those classes. ASTM states that “the conversions are affected by alloy, grain structure, and heat treatment” (ASTM International, 2012). ISO 18265:2013 makes the same practical point: converted values apply directly only to the exact material tested, while tensile-strength estimates are the least reliable type of conversion (ISO, 2013).
Treating equivalent numbers as interchangeable
A table entry such as 40 HRC ≈ 375 HBW does not mean that a 40 HRC reading and a 375 HBW reading are interchangeable facts. The first is a measured Rockwell C result produced with a diamond cone, a specified minor load, and a specified major load. The second is a Brinell value associated with a carbide ball, a defined force, and an indentation diameter. They are related estimates, not duplicate observations.
This distinction matters in inspection records. If a drawing calls for 35–40 HRC, a Brinell result converted to that interval may support preliminary screening, but it does not necessarily satisfy a requirement written for a Rockwell C test. The conversion can hide a difference caused by indentation depth, local microstructure, surface condition, or test scatter. A direct HRC measurement is the appropriate evidence when the specified acceptance method is Rockwell C.
The reverse error is also common: a user converts HRC to HBW outside the table range and reports the extrapolated number as though it were tabulated. A relationship calibrated between, for example, 20 and 50 HRC should not be extended casually to a 62 HRC tool-steel surface. At high hardness, indentation mechanics and carbide populations can change the relationship sharply. Table endpoints are not exact boundaries in the material; they are the limits of the published data or recommended correlation. A value just beyond an endpoint is not automatically invalid, but it is unsupported by that table and requires a method suited to the actual hardness range.
The original measurement must remain visible. “420 HBW converted to 44 HRC” is materially better than simply reporting “44 HRC,” because it tells the reader that no Rockwell test was performed. A sound record includes the measured scale, converted scale, test standard, location, and material or heat-treatment condition.
Mixing scales, units, and indenter conditions
Hardness designations contain test information. HRC, HRB, and superficial Rockwell scales are not interchangeable versions of one Rockwell number. HRC uses a diamond indenter and a 150 kgf major load; HRB generally uses a ball indenter and a 100 kgf major load. Superficial Rockwell scales use lower forces and have their own designations, such as 30N or 30T. Omitting the suffix can turn a traceable result into an ambiguous one.
The same warning applies to Brinell notation. HBW identifies a tungsten-carbide ball, while older records may use HB or HBS conventions that do not provide the same indenter information. A Brinell result also depends on ball diameter, test force, dwell time, and the ratio of force to indentation diameter. Two values written as “HB” may not have been generated under equivalent conditions.
Vickers hardness, written HV with the test force commonly included in the designation, is another frequent source of error. HV is a hardness number, not a tensile-strength value. A statement such as “650 HV steel has 650 MPa tensile strength” confuses unrelated quantities and can be wrong by a large margin. For some high-strength, ductile metallic materials, research has identified the approximate relation , but the same study reports that hardness-to-strength ratios depend on material class, microstructure, and indentation morphology (Materials Science and Engineering: A, 2012). The expression is therefore a restricted empirical approximation, not a conversion law.
Units introduce another trap. Brinell hardness is not a stress value, even though its numerical definition contains force and area. Tensile strength may be reported in MPa or ksi, while hardness scales are dimensionless test numbers with scale-specific meanings. A table that estimates tensile strength from HBW must be identified as an estimate, with its source and material range stated.
Geometry can invalidate an otherwise suitable scale. A thin sheet may show a falsely high or low result if the indentation is too deep or the support is inadequate. A small part, curved surface, narrow edge, or locally hardened layer may not provide enough material for the intended indent. The SAE report Hardness Tests and Hardness Number Conversions (1967) states that precise conversions must be developed for the particular steel composition, heat treatment, and part because size, mass, composition, and processing affect the relationship.
Extrapolating across grades or heat treatments
The most dangerous error is not arithmetic. It is unexamined material substitution: applying a relationship established for one steel to another because both are labeled “steel.”
A carbon-steel correlation may perform reasonably for a plain-carbon grade in the normalized condition and fail for a high-alloy tool steel, precipitation-hardening stainless steel, or carburized low-carbon steel. AISI 1045, AISI D2, AISI H13, AISI 304, and AISI 17-4 PH do not share one hardness-to-strength relationship. Their alloy content, carbide or precipitate populations, retained austenite, grain size, and deformation response alter both indentation and tensile behavior.
Heat treatment can be decisive even within one grade. Quenched-and-tempered AISI 4140, annealed AISI 4140, and induction-hardened AISI 4140 may produce the same nominal bulk hardness in one location while differing in strength distribution, residual stress, and failure behavior. Surface hardening is especially easy to miss. Carburizing, nitriding, induction hardening, and laser hardening can create a hard case over a softer core. A shallow Rockwell or Vickers indent may measure the case; a larger Brinell indent may include the core. Converting either result without recording depth and location creates a false comparison.
Research on historical and contemporary unalloyed structural steels found a generally linear empirical relationship between Brinell hardness and tensile-strength parameters for steels in the raw or normalized condition (Materials Today: Proceedings, 2023). That finding supports controlled use within a defined steel population; it does not justify transferring the line to hardened tool steel or stainless steel. A 1929 NIST study likewise reported that steel tensile strength can often be estimated from Brinell hardness for commercial purposes, while treating the relationship as empirical rather than universal (NIST, 1929).
When tensile properties affect design, weld qualification, fracture assessment, or acceptance, direct tensile testing or a validated grade-and-condition-specific correlation is required. The table should inform judgment, not replace the test that the decision actually depends on.
Reporting Hardness and Converted Properties Correctly
Hardness data should show what was actually measured before showing any conversion. A hardness number without its scale, method, and test condition is incomplete: “hardness 42” could mean 42 HRC, 42 HRB, 42 HV, or 42 HBW, and those values do not describe the same material response. The report should also make clear whether the number came from an indentation test, a published conversion table, or an estimate based on an empirical strength relationship.
Record the original test result first
The first value in a report should be the measured result in its original scale and designation. For example:
> Measured hardness: 58 HRC, ASTM E18, AISI 4140 steel, quenched and tempered at 540 °C; test location: mid-radius, 10 mm below the machined surface; surface ground; calibrated Rockwell tester, 150 kgf major load.
That statement identifies a result obtained by a Rockwell test. It does not silently replace the result with a Brinell or Vickers number. If several indents were made, report the individual readings or their mean and range, such as 58, 59, 58 HRC; mean 58.3 HRC, range 1 HRC. The number of indents and their spacing can matter when the material has a gradient, coarse microstructure, decarburization, or localized heat treatment.
The report should identify the steel grade exactly as specified by the applicable material standard, where possible. “4140” is less precise than SAE J404 Grade 4140, and “stainless steel” is not an adequate grade description when the material is UNS S30400, AISI 304, or another specified designation. Record the heat-treatment condition: annealed, normalized, quenched and tempered, carburized, nitrided, or as-received. A hardness reading from a nitrided case is not interchangeable with a reading from the core.
Geometry belongs in the record because thin sections, small parts, curved surfaces, and low-mass specimens can distort indentation results. State thickness, diameter, distance from an edge, and whether the test was made on a flat or curved surface. Surface preparation also matters. Identify machining, grinding, polishing, coating removal, and any visible scale or decarburized layer. A Rockwell, Brinell, Vickers, Knoop, or Leeb result should name the instrument or at least the test method, load, indenter, and relevant standard.
State the standard and conversion basis
A converted value must follow the original measurement, not replace it. For example:
> Measured: 58 HRC, ASTM E18. Converted: approximately Rockwell-equivalent 615 HV under ASTM E140-12, Table [applicable table], for the specified steel range; conversion is approximate and not a separate Vickers measurement.
The table number or equation should be recorded where the source provides one. If software supplied the result, identify the software, database, revision, and selected material category. “Converted to 615 HV” is insufficient because different tables can produce different results, particularly near the ends of their stated ranges.
ASTM E140-12, Standard Hardness Conversion Tables for Metals, provides approximate relationships among Brinell, Vickers, Rockwell, superficial Rockwell, Knoop, Scleroscope, and Leeb scales for specified metals, including homogeneous carbon, alloy, and tool steels. ASTM states that “the conversions are affected by alloy, grain structure, and heat treatment” (ASTM International, 2012). That limitation is part of the result. It should be retained in drawings, inspection records, and certificates rather than removed for presentation convenience.
ISO 18265:2013 establishes principles for converting hardness values between scales and for estimating tensile strength. Its warning is stricter than many short conversion charts suggest: converted values apply directly only to the exact material tested, and tensile-strength estimates are the least reliable conversions (International Organization for Standardization, 2013). A report should therefore name the conversion basis explicitly:
> Basis: ISO 18265:2013, steel conversion table, approximate value; applicability restricted to the tested grade and condition.
ASTM E140 and ISO 18265 are not licenses to convert every scale combination. Their tables have material categories, ranges, and test-method limits. A conversion outside those limits should be marked unsupported or omitted.
Separate measured, converted, and estimated values
| Label | Meaning | Reporting example |
|---|---|---|
| Measured hardness | Direct result from the performed hardness test | 225 HBW 10/3000, ASTM E10 |
| Converted hardness | Approximate value inferred on another hardness scale | Approximately 22 HRC, ISO 18265:2013 |
| Estimated tensile strength | Further inference from hardness | Approximately 760 MPa, estimate only |
Use separate labels for three different kinds of information:
> Measured hardness: 225 HBW 10/3000, ASTM E10. > Converted hardness: approximately 22 HRC, ISO 18265:2013, applicable steel table. > Estimated tensile strength: approximately 760 MPa, empirical hardness–strength relationship; not measured by tensile testing.
The third value must never be presented as tensile strength: 760 MPa unless a tensile test produced it. ISO 18265 identifies tensile-strength estimates as the least reliable conversions. The NIST study of empirical Rockwell–Brinell relationships, published in 1929, found that steel tensile strength can often be estimated from Brinell hardness for commercial purposes, but that finding describes an empirical convenience, not a universal law. Direct tensile testing remains necessary when a design calculation, material certification, failure investigation, or acceptance decision depends on yield strength, ultimate tensile strength, elongation, or reduction of area.
Some relationships are useful only within a stated material class. A 2012 study in Materials Science and Engineering: A identified the approximate relation Hᵥ ≈ 3σUTS for some high-strength, ductile metallic materials. The ratio changes with material class, microstructure, and indentation morphology; it should not be applied automatically to ferritic-pearlitic ASTM A36, quenched-and-tempered SAE J404 Grade 4140, martensitic stainless steel, or a nitrided surface. A 2023 study of historical and contemporary unalloyed structural steels found a generally linear empirical relation between Brinell hardness and tensile-strength parameters in raw or normalized material. That result does not establish the same line for quenched-and-tempered, cold-worked, carburized, or precipitation-hardened steel.
A complete entry can therefore read:
> Material: SAE J404 Grade 4140, quenched and tempered at 540 °C; 40 mm bar, test at mid-radius; ground surface. Measured: 31 HRC, ASTM E18, calibrated Rockwell tester. Converted: approximately 295 HBW, ASTM E140-12, applicable alloy-steel table; approximate only. Estimated tensile strength: approximately [value] MPa from [named equation or table]; estimate only, not a tensile-test result.
That format preserves the evidence, the assumptions, and the limits of the conversion. It also lets a later reviewer decide whether a direct test is required rather than mistaking a convenient equivalent number for a new measurement.
Worked Metallurgical Comparisons Without False Precision
Hardness conversion becomes misleading when the number is treated as a material identity rather than as the result of a particular test on a particular condition of steel. A Brinell value measured on a sound, homogeneous section may correlate reasonably with tensile strength within a controlled family of normalized steels. The same numerical hardness from a quenched-and-tempered grade, or from the case of a carburized component, does not carry the same meaning.
ASTM E140-12, Standard Hardness Conversion Tables for Metals, provides approximate relationships among Brinell, Vickers, Rockwell, superficial Rockwell, Knoop, Scleroscope, and Leeb scales for specified metals, including homogeneous carbon, alloy, and tool steels. ASTM states directly that “the conversions are affected by alloy, grain structure, and heat treatment” (ASTM International, 2012). That limitation governs each comparison below.
Normalized unalloyed structural steel
A normalized unalloyed structural steel is the case in which a Brinell–strength relationship can be comparatively coherent. Consider a grade such as ASTM A36, or an EN 10025-2 grade such as S275JR, provided the material is actually in a normalized or equivalent fine-grained condition and the tested section is sufficiently homogeneous. Normalizing refines and regularizes the ferrite–pearlite structure by heating above the critical range and cooling in air. It does not make every heat of steel identical, but it reduces some of the condition variation that complicates hardness interpretation.
For this class, Brinell hardness samples a relatively large volume through a ball indentation. The result therefore averages ferrite, pearlite, inclusions, and local fluctuations more effectively than a very small microhardness impression. If carbon content, manganese content, grain size, thickness, and processing history remain within a restricted population, increasing Brinell hardness will generally accompany increasing yield and tensile strength. A 2023 study in Materials Today: Proceedings found a generally linear empirical relationship between Brinell hardness and tensile-strength parameters for historical and contemporary unalloyed structural steels in the raw or normalized condition (Materials Today: Proceedings, 2023).
“Generally linear” is not a permission to calculate a guaranteed tensile value from a single indentation. It describes a fitted relationship for a material set. Even within S275JR or ASTM A36, differences in plate thickness, deoxidation practice, phosphorus and sulfur content, rolling history, and local segregation can shift the result. A hardness value taken from a weld heat-affected zone is not interchangeable with one taken from the parent plate.
The older NIST study of empirical Rockwell–Brinell relationships reached a practical position that remains useful: tensile strength in steel can often be estimated from Brinell hardness for commercial purposes, but the estimate is empirical rather than a universal law (NIST, 1929). Thus, a conversion table can help screen material uniformity or support process control when the steel family and condition match the table. It cannot replace a tensile test when a specified yield strength, tensile strength, elongation, or acceptance criterion is at stake.
Quenched-and-tempered alloy steel
A quenched-and-tempered alloy steel exposes the weaknesses of a broad hardness conversion more sharply. SAE 4140 and EN 10083-3 42CrMo4 may both be described as chromium-molybdenum steels, yet their hardness–strength relationship depends strongly on austenitizing practice, quench severity, tempering temperature, holding time, and section size. The same nominal grade can contain tempered martensite near a quenched surface, mixed bainite and martensite at an intermediate location, and a softer transformation structure toward the center of a large bar.
Tempering condition matters because hardness and tensile behavior do not change in precisely the same proportion throughout the tempering range. Low-temperature tempered martensite may retain high hardness with limited toughness; higher-temperature tempering lowers hardness while improving ductility and relieving residual stress. Secondary hardening reactions, carbide precipitation, retained austenite, and temper embrittlement can further disturb a simple one-number relationship. A conversion from HRC to HB may be acceptable as a scale approximation for a homogeneous test piece, while an estimated tensile strength based on that converted HB can carry substantially greater uncertainty.
Section size is equally important. A small 42CrMo4 specimen may harden through its section, whereas a large forged shaft of the same designation may develop a hardness gradient because the core cools more slowly. Testing the surface and assigning that result to the entire cross-section can overstate core strength. The SAE technical report Hardness Tests and Hardness Number Conversions states that precise conversions must be developed for the particular steel composition, heat treatment, and part, since size, mass, composition, and processing influence the relationship (SAE International, 1967).
The approximate relation Hᵥ ≈ 3σUTS, reported for some high-strength, ductile metallic materials in a 2012 Materials Science and Engineering: A study, illustrates the danger of exporting a useful correlation beyond its material class. The study also reports that hardness-to-strength ratios depend on material class, microstructure, and indentation morphology (Materials Science and Engineering: A, 2012). It should not be applied as a general rule to every 4140 condition, still less to a conversion chain involving several hardness scales.
Surface-hardened steel with a soft core
A carburized steel component makes the substitution of hardness for tensile strength especially unsafe. Take SAE 8620 or EN 10084 20MnCr5 after carburizing, quenching, and tempering. Carbon enrichment produces a hard martensitic case, while the low-carbon core remains much tougher and substantially softer. The part therefore has no single hardness that represents its complete mechanical state.
A Rockwell C measurement on the case reports the resistance of a shallow surface region. It says little about core yield strength, core tensile strength, elongation, or fracture behavior. If the case is thin relative to the indentation depth or if the test load reaches the transition zone, the measured value may be depressed by the soft substrate. A superficial Rockwell or Vickers test may better resolve the case, but it still characterizes the tested layer, not the bulk. Microhardness traverses can map hardness from the surface into the core; they cannot by themselves establish a tensile stress–strain curve.
The distinction also affects sampling. Grinding through the case before a Brinell test may produce a meaningful core hardness, but that result must be reported as a core measurement. Leaving the case intact and taking a surface reading produces a case result. Calling either value “the hardness of the part” conceals the property gradient.
ISO 18265:2013 specifies principles for converting hardness values between scales and for estimating tensile strength, but states that converted values apply directly only to the exact material tested and identifies tensile-strength estimates as the least reliable conversions (ISO, 2013). A carburized SAE 8620 tooth is not the exact homogeneous material represented by a carbon-steel conversion table. ASTM E140-12 therefore cannot turn its case HRC value into a defensible bulk tensile-strength value.
For a design or acceptance decision, the correct response is to define the property being verified: case hardness, effective case depth, core hardness, or tensile properties from a separately prepared specimen. Direct tensile testing, metallographic examination, and hardness-depth profiling answer different questions. A converted number answers only the narrow question supported by the applicable material-specific correlation.
A Practical Reference Workflow
Hardness conversion should begin with a decision about the property that is actually needed. A measured hardness value describes the response of a particular surface, location, indenter, and test force. A converted hardness value is an estimate on another hardness scale. An estimated tensile strength is a further inference, and is usually less reliable than a hardness-scale conversion. These three results should not be reported as though they were interchangeable.
Before testing
Define the engineering question before selecting the test. If the requirement is surface wear resistance, case depth, local heat-treatment uniformity, or a production-control value, hardness may be the appropriate direct property. If the requirement is yield strength, ultimate tensile strength, elongation, fracture behavior, or material certification, hardness is only a possible screening measurement. A tensile test is the direct method for tensile properties.
Identify the steel grade and product condition as precisely as the records allow. “Carbon steel” is not enough. Record the designation, such as ASTM A36, SAE J403 1045, AISI 4140, ASTM A681 O1, or EN 1.2379, together with product form, section size, heat treatment, temper, cold work, and surface treatment. A 4140 specimen quenched and tempered at 540 °C does not have the same hardness–strength relationship as annealed 4140, even if both are called 4140. A carburized surface, decarburized layer, weld heat-affected zone, and normalized plate may each require a different measurement plan.
Select the scale from geometry and expected hardness, not from convenience. Brinell is useful for many larger, relatively uniform sections, but the ball impression needs sufficient thickness and spacing from edges or neighboring impressions. Rockwell is faster and leaves a smaller impression, while superficial Rockwell scales suit thinner sections or shallow hardened layers. Vickers and Knoop microhardness can resolve small regions, gradients, and individual phases, but surface preparation and operator technique become more important. Leeb and Scleroscope methods are portable and useful in suitable field conditions, yet their readings depend strongly on mass, support, orientation, surface condition, and instrument setup.
Read the applicable test standard before making the impression. ASTM E10 governs Brinell hardness testing, ASTM E18 Rockwell hardness testing, and ASTM E384 microindentation hardness testing; the relevant ISO method may also be specified by the drawing or material standard. ASTM E140-12, Standard Hardness Conversion Tables for Metals, contains approximate relationships among Brinell, Vickers, Rockwell, superficial Rockwell, Knoop, Scleroscope, and Leeb values for specified metals, including homogeneous carbon, alloy, and tool steels. It does not make one scale a universal substitute for another.
Plan the specimen preparation. Remove scale, rust, paint, and burrs without changing the heat-treated layer through grinding or excessive polishing. The test surface should be flat, clean, and sufficiently smooth for the selected method. Support the specimen firmly. A thin plate that flexes under the indenter can produce a misleadingly low reading, while a curved or poorly supported part can shift the result in either direction.
During measurement
Confirm the instrument with the required reference blocks or verification procedure, and record the machine identification, indenter type, force, dwell time, temperature, and test location. Do not silently mix scales or loads. “HRC” and “HRB” are different Rockwell scales, not interchangeable labels; “HV10” and “HV0.2” use different test forces and may sample different microstructural volumes.
Place impressions away from edges, holes, weld boundaries, and previous impressions by the distances required by the test standard. On a case-hardened component, map the distance from the surface rather than taking one convenient reading. On a segregated, banded, or multiphase steel, several impressions may be needed to distinguish actual variation from measurement scatter.
Repeat measurements. Three readings may be adequate for a uniform laboratory coupon, while a welded joint, thin coating, gradient, or large forging may require a larger grid. Rejecting an inconvenient reading without a documented rule is poor practice. Report the individual values, mean, range or standard deviation, and any exclusions with their reasons. If repeat impressions vary materially, investigate surface condition, support, scale selection, microstructure, and operator technique before converting anything.
The measured result should retain its original identity: for example, 22 HRC, 235 HBW 2.5/187.5, or 310 HV10. A conversion should be written separately, such as “approximately 22 HRC, converted from 235 HBW using ASTM E140-12.” This prevents a table output from being mistaken for a second measurement.
After conversion
Use a conversion table that matches the steel family and the measured range. ASTM E140-12 states that “the conversions are affected by alloy, grain structure, and heat treatment” (ASTM International, 2012). ISO 18265:2013 specifies principles for converting hardness values between scales and for estimating tensile strength, but states that converted values are directly applicable only to the exact material tested; it also identifies tensile-strength estimates as the least reliable conversions (ISO, 2013). A table value outside its stated range is not rescued by extra decimal places.
Treat tensile-strength estimates as screening results. A 1929 NIST study reported that steel tensile strength can often be estimated from Brinell hardness for commercial purposes, based on empirical Rockwell–Brinell relationships (NIST, 1929). That finding supports practical correlation, not a universal law. SAE’s 1967 report, Hardness Tests and Hardness Number Conversions, likewise explains that precise conversions must be developed for the particular steel composition, heat treatment, and part because size, mass, composition, and processing affect the relationship.
The approximate relation has been reported for some high-strength, ductile metallic materials, but the 2012 Materials Science and Engineering: A study connected hardness-to-strength ratios to material class, microstructure, and indentation morphology (Materials Science and Engineering: A, 2012). It must not be applied automatically to ferritic–pearlitic plate, martensitic tool steel, precipitation-hardened stainless steel, or a surface case. Similarly, a 2023 study found a generally linear Brinell hardness–tensile-strength relationship for historical and contemporary unalloyed structural steels in raw or normalized conditions, not for every alloy or heat-treatment state (Materials Today: Proceedings, 2023).
Record the source table, edition, original scale, converted scale, steel designation, condition, test location, number of readings, and uncertainty. State whether the value is measured, converted, or estimated. Include limitations such as thin-section effects, surface gradients, unknown heat treatment, calibration status, and whether the steel falls outside the source data.
Practical conversion workflow
- Define Identify whether the requirement is hardness, case depth, tensile strength, or another property.
- Identify Record grade, product form, section size, heat treatment, and surface condition.
- Select Choose a valid direct hardness method and scale for the geometry and expected hardness.
- Measure Verify the instrument, prepare the surface, control spacing, and repeat readings.
- Convert Use a matching table or qualified model only within its stated scope and range.
- Report Separate measured, converted, and estimated values and state uncertainty.
- Escalate Use direct tensile testing when design, certification, or acceptance depends on tensile properties.
The engineering workflow is therefore: define the required property; select a valid direct test where possible; verify the steel grade and condition; prepare and support the specimen; perform repeat measurements; consult the relevant conversion standard; record uncertainty and limitations; and escalate to direct tensile testing when the result affects design, certification, or material acceptance.
References
- [1] Standard Hardness Conversion Tables for Metals. ASTM International standard, 2012. https://store.astm.org/e0140-12.html
- [2] Metallic materials—Conversion of hardness values. ISO standard, 2013. https://www.iso.org/standard/53810.html
- [3] Empirical Rockwell–Brinell relationships. NIST Journal of Research, 1929. https://nvlpubs.nist.gov/nistpubs/jres/5/jresv5n1p19_A2b.pdf
- [4] Hardness Tests and Hardness Number Conversions. SAE technical report, 1967. https://books.google.com/books/about/Hardness_Tests_and_Hardness_Number_Conve.html?id=hRW4zwEACAAJ
- [5] Brinell hardness and tensile-strength relationship in unalloyed structural steels. Materials Today: Proceedings, 2023. https://www.sciencedirect.com/science/article/pii/S2352012423017897