



Hardenability Is Not Hardness
A steel can be hard at its surface without hardening deeply. That statement is the key to reading a Jominy result correctly. Hardness is the resistance of a material to indentation or another specified form of deformation, measured by a method such as Rockwell, Brinell, or Vickers. Hardenability is different: it describes how far, and how evenly, a steel develops hardness when a defined austenitizing and quenching treatment produces a defined cooling history.
The distinction matters because hardness is a measured condition at a particular location, while hardenability describes a material response through a section. A single Rockwell C value taken from a surface does not identify the cooling rate that produced it, the microstructure below it, or the hardness that remains at the center of a part. Calling a steel simply “hard” leaves those questions unanswered. This article therefore uses the terminology of ASTM A255 and ASM International rather than treating hardness and hardenability as interchangeable properties.
Definitions used by ASTM A255 and ASM International
ASTM A255-20 defines hardenability as “the depth to which steel hardens when quenched.” The definition is short, but its important word is depth. Hardenability is not a second name for the hardness number on a test certificate. It concerns the penetration of hardening from the surface toward the interior during quenching.
| Standard | Specimen geometry | Test principle |
|---|---|---|
| ASTM A255-20 | Cylindrical bar, 1 inch in diameter | One end is quenched and hardness is measured at increasing distances |
| ISO 642:2024 | 25 mm diameter; at least 100 mm long | Steel end-quench test with distance-based hardness measurements |
Jominy hardenability curve A graph showing measured hardness as a function of distance from the water-quenched end of a standardized specimen.
The same standard specifies the quantitative end-quench, or Jominy, test. Its test specimen is a cylindrical bar 1 inch in diameter. After heating to the prescribed austenitizing condition, one end is quenched by a controlled water jet. Hardness measurements are then taken at increasing distances from that quenched end. The resulting hardness-versus-distance plot is the Jominy hardenability curve.
ISO 642:2024 specifies the steel end-quench hardenability test with a test piece 25 mm in diameter and at least 100 mm long. The dimensions are close to, but not simply a casual restatement of, the ASTM specification. A result must be tied to the standard and edition that defined the specimen, heating practice, quench arrangement, measurement locations, and reporting method. Otherwise, “Jominy hardness” may describe a number without identifying a reproducible test.
ASM International gives the broader metallurgical meaning. Its 1990 chapter on carbon and low-alloy steels describes hardenability as the property governing the depth and distribution of hardness produced by quenching. ASM also identifies steel composition and austenite grain size as primary factors affecting hardenability. Carbon content affects the hardness available from martensite, while alloying additions can delay transformations that compete with martensite formation during cooling. Austenite grain size changes transformation behavior as well. These factors act through the thermal history; they do not turn hardenability into a fixed hardness value.
Why a hard steel may have limited hardenability
Consider two specimens whose quenched surfaces show the same high hardness. That observation establishes only that the surface regions reached a microstructure and condition capable of producing those readings. It does not establish that both specimens hardened to the same depth.
The surface cools fastest during a conventional quench. If the steel has limited hardenability, the surface may transform largely to martensite while regions farther inward cool more slowly and form mixtures such as bainite, pearlite, or other transformation products. Those regions can have much lower hardness than the surface. A small laboratory coupon may therefore appear fully hard, whereas a larger component made from the same heat develops a softer core because heat escapes less rapidly from its interior.
This is why hardness and hardenability answer different engineering questions. A hardness test asks, “How resistant is this location to the specified indenter?” A hardenability test asks, “How does hardness change with distance from a quenched surface under this defined cooling arrangement?” The first can be satisfied at one point while the second remains poor.
Steel chemistry illustrates the difference. Carbon strongly influences the maximum hardness of martensite, but a high potential surface hardness does not guarantee deep hardening. Conversely, alloying elements that delay diffusional transformations may allow a steel to form martensite farther from the quenched surface, even when the hardness at any particular location depends on carbon content and the local microstructure. Grain size, prior thermal treatment, specimen size, and quench severity also affect the observed result. Hardenability is thus a response of steel under conditions, not an isolated label attached to a grade.
A surface hardness reading can also conceal nonuniformity caused by decarburization, scale, grinding damage, retained austenite, or an unsuitable measurement location. Such a reading may be valid for that surface and still be useless as evidence of the hardness distribution through the section.
Depth and distribution of hardness after quenching
The Jominy test creates a controlled range of cooling rates in one specimen. The University of Illinois procedure heats a cylindrical specimen to its austenitizing temperature, quenches one end with a water jet, and measures hardness at increasing distances from that end. The University of Cambridge explains the physical basis: the quenched end cools directly in water, while the remainder cools in air, producing a continuous range of cooling rates along the bar.
A gradual decline and a steep decline represent different hardenability responses even when the specimens have similar near-end hardness. Strong evidence
Distance from the quenched end therefore acts as a practical way to sample different cooling histories. Near the end, the cooling rate is severe and the hardness may be high. Farther away, cooling is slower and the curve may fall as transformation products other than martensite become more prominent. The shape and position of the curve describe the distribution of hardness under the test conditions. A gradual decline indicates a different response from a steep decline, even if both specimens have similar hardness at the first measurement point.
A Jominy curve does not directly reproduce the hardness profile of every real component. The component may have a different diameter, geometry, surface condition, austenitizing cycle, agitation level, or quenchant. Heat extraction from a cylinder in an end-quench fixture is not identical to heat extraction from a gear tooth, shaft, plate, or corner. The curve is a standardized comparison and process-design input, not a universal promise about every section size.
The curve also does not measure hardness at every possible cooling rate with unlimited precision. Its meaning depends on the test procedure and on accurate hardness measurements at specified distances. The Materials Education Foundation accordingly describes the Jominy test as measuring hardness at increasing distances from a quenched end to determine steel hardenability.
Hardness and hardenability are different properties, and surface hardness alone cannot replace a hardenability curve. Strong evidence
[1] Standard Test Methods for Determining Hardenability of Steel. ASTM International. ASTM International standard, 2020.The correct conclusion is specific: hardness reports resistance at a tested location; hardenability reports the depth and distribution of hardness produced by a defined quench. ASTM A255-20, ISO 642:2024, and ASM International preserve that distinction. Surface hardness alone cannot replace a hardenability curve.
What the Jominy End-Quench Test Measures
A Jominy test does not assign one hardness number to a steel and call that number its hardenability. It measures how hardness changes along a specimen that has experienced a controlled range of cooling conditions. The result is a hardenability curve: hardness plotted against distance from the quenched end.
That distinction matters. Hardness is the resistance of a particular location to indentation or deformation. Hardenability is the capacity of the steel to develop hardness to a given depth during quenching. ASTM A255-20 defines hardenability as “the depth to which steel hardens when quenched” and specifies the quantitative end-quench, or Jominy, test using a cylindrical specimen 1 inch in diameter. ISO 642:2024 specifies a steel end-quench test piece 25 mm in diameter and at least 100 mm long. The small dimensional difference reflects the stated requirements of two standards, not two different meanings of hardenability.
The test creates different cooling histories in one piece of steel. Its quenched end cools most severely, while locations farther away cool at progressively lower rates. If the steel forms martensite readily under those conditions, high hardness extends farther along the bar. If transformation begins before the more distant regions can form much martensite, hardness falls more quickly with distance. The curve therefore shows both the hardness developed under a severe quench and the distance over which the steel can retain that response.

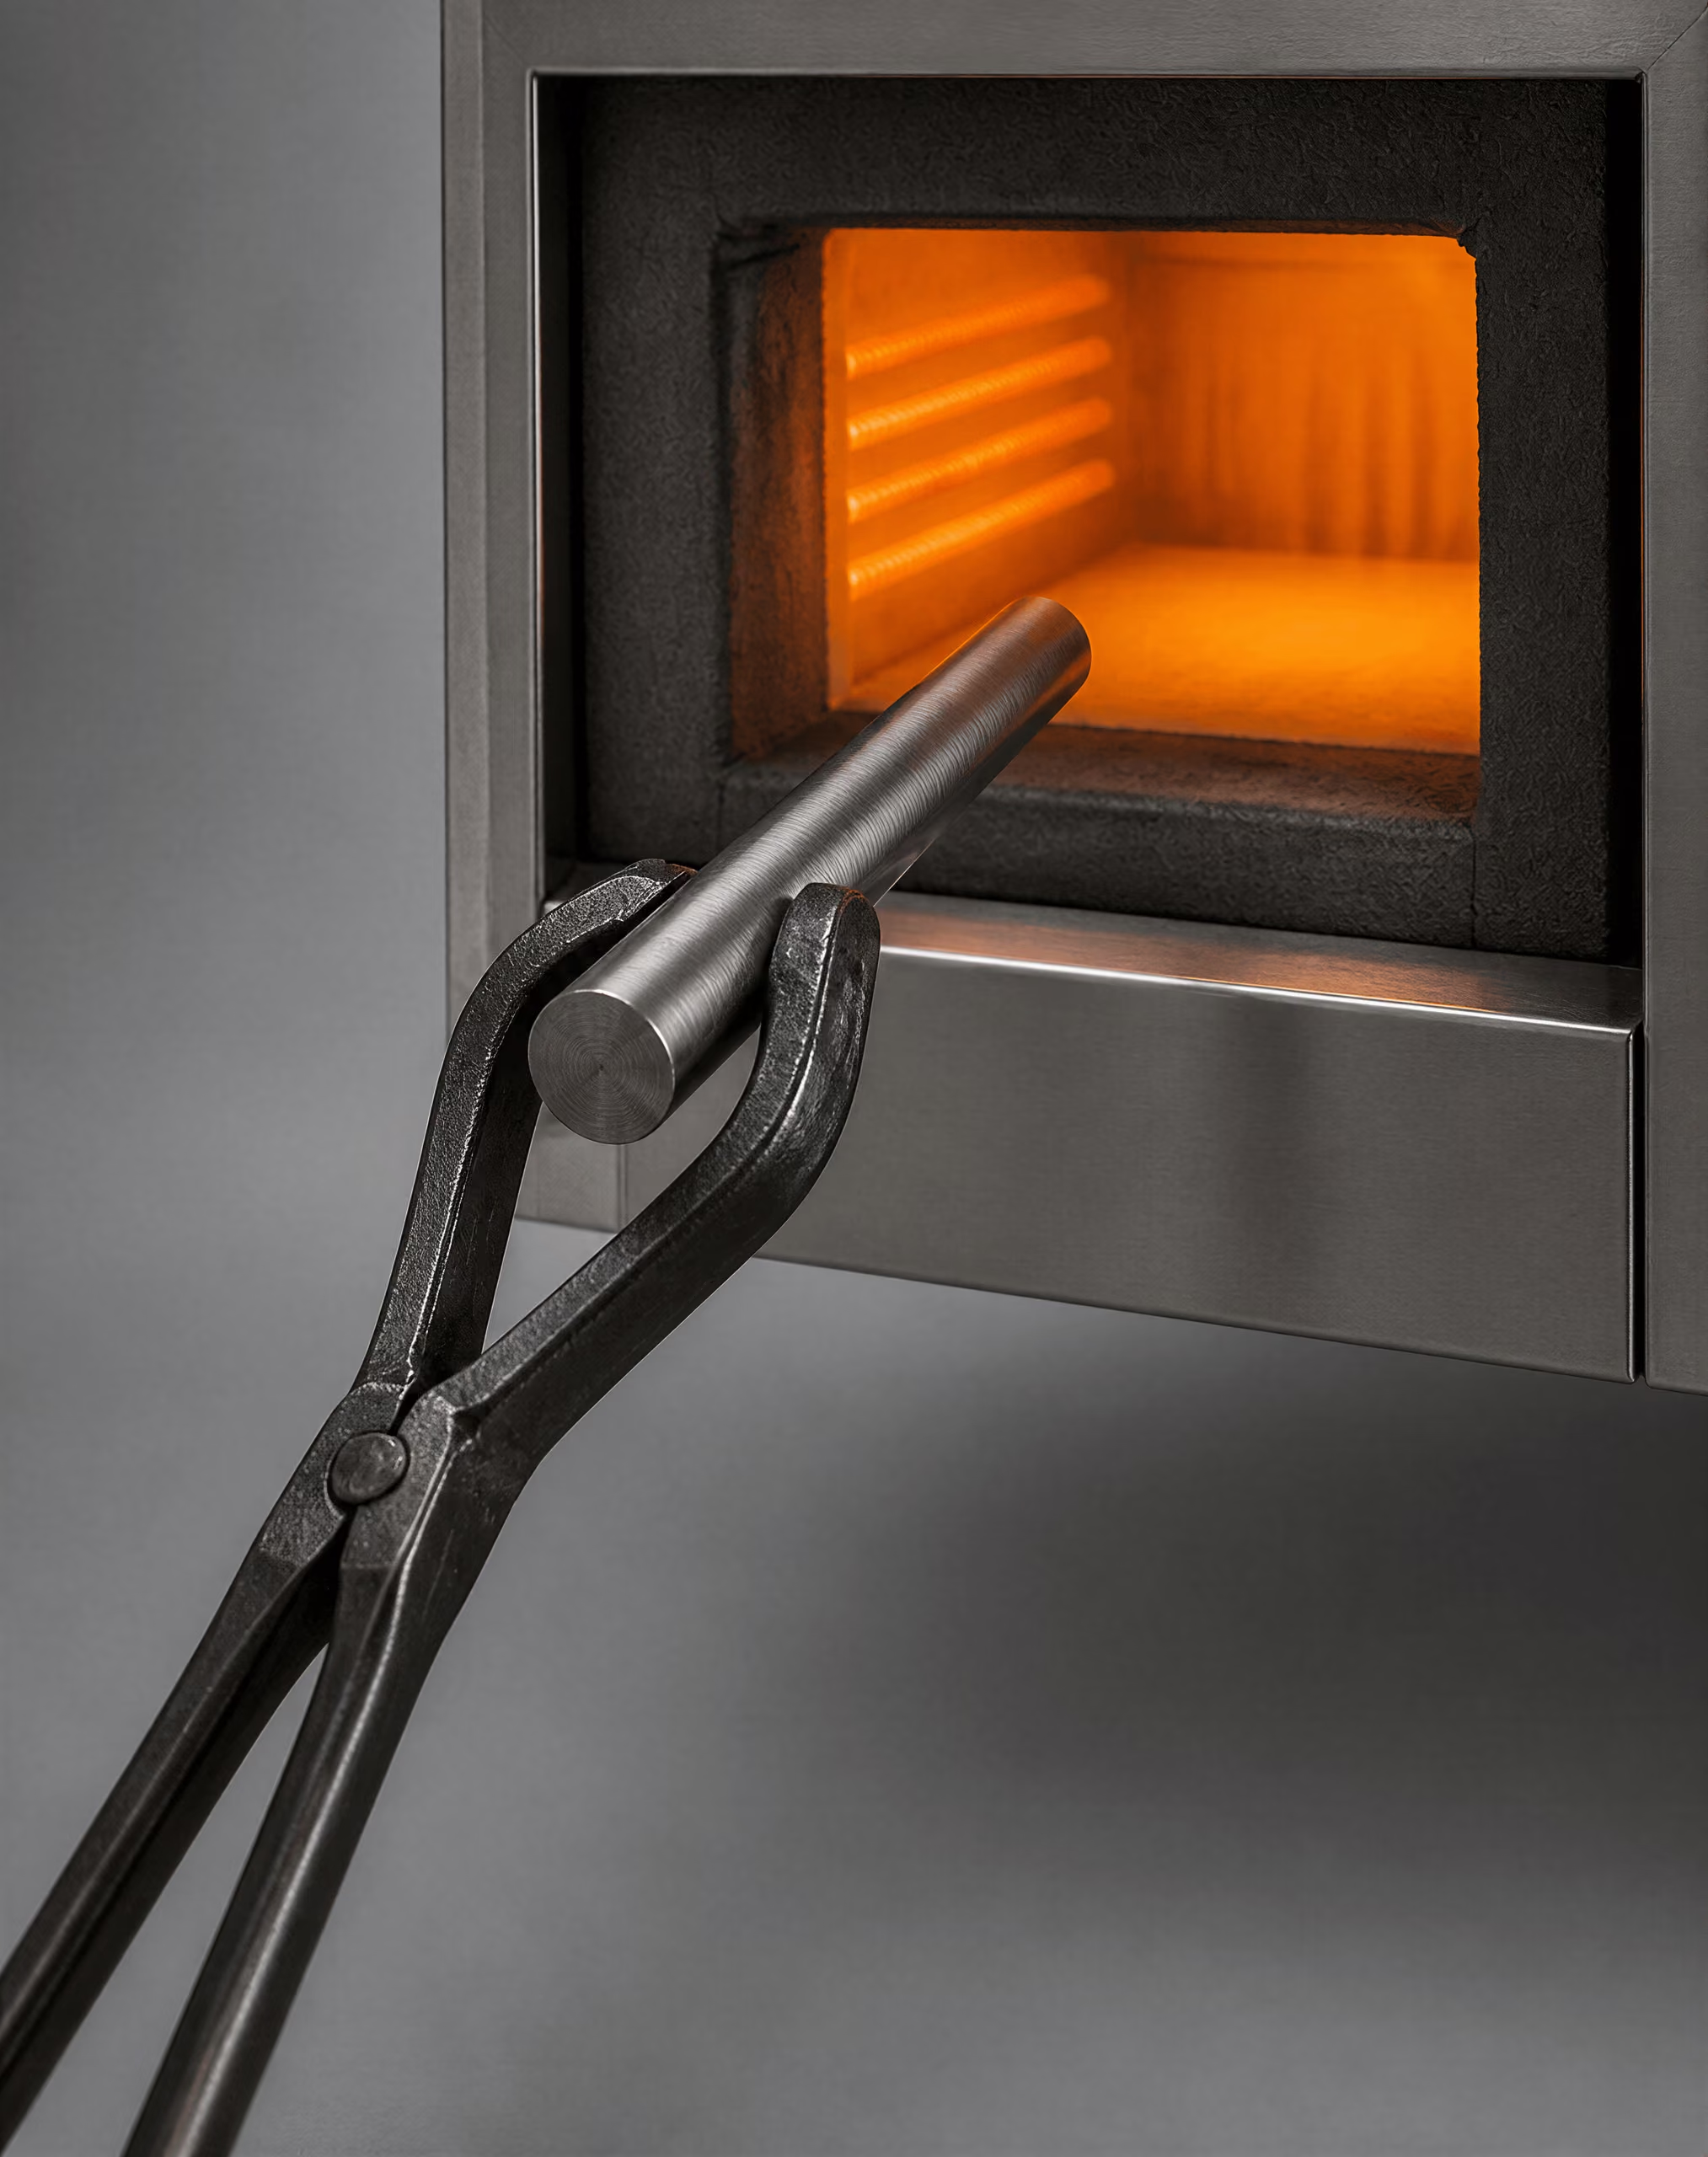
Austenitizing the cylindrical specimen
Jominy test sequence
- Austenitize Heat the cylindrical specimen to the prescribed austenitizing condition.
- Position Place the specimen in the end-quench fixture.
- Quench Apply a controlled water jet to one end while the remainder cools in air.
- Measure Record hardness at increasing distances from the quenched end.
- Plot Plot hardness against distance to obtain the hardenability curve.
| Stage | Thermal or physical condition | Purpose in the test |
|---|---|---|
| Austenitizing | Specimen is heated into the austenitic condition | Establish a defined starting structure |
| End quenching | One end receives a controlled water jet | Create the most severe cooling condition |
| Air cooling | The remainder cools without direct water spray | Create progressively slower cooling with distance |
| Hardness measurement | Readings are taken along the prepared track | Record the response to the cooling gradient |
Austenitizing Heating steel to a prescribed temperature range so that the starting structure becomes austenite before quenching.
The procedure begins with a machined cylindrical test piece. The University of Illinois Materials Technology and Innovation Laboratory describes the sequence as heating the specimen to its austenitizing temperature, applying a water jet to one end, measuring hardness at increasing distances from that end, and plotting hardness against distance. Austenitizing changes the starting structure into austenite, the high-temperature phase from which the quenched products form. The heating temperature and holding time are selected for the steel and procedure; they are not interchangeable details.
This preparation stage establishes the condition from which the cooling response will be measured. Carbon content, alloying additions, prior microstructure, and austenite grain size can all affect what happens after the specimen leaves the furnace. ASM International identified steel composition and austenite grain size as primary influences on hardenability in its 1990 treatment of hardness and hardenability of steels. A test performed after an unsuitable austenitizing treatment may produce a valid hardness reading from that specimen, but it does not necessarily represent the grade’s specified hardenability.
The specimen must also be handled so that its thermal history is controlled before the water jet is applied. The purpose is not to reproduce every industrial quench geometry. It is to create a repeatable comparison in which the specimen begins from a defined austenitic condition and then encounters a known end-quench arrangement. This is why a Jominy result belongs with its test conditions, material designation, and standard. A curve without that context is incomplete evidence.
The test piece is cylindrical because a repeatable shape makes the temperature and transformation response easier to compare from one test to another. ASTM A255-20 states the specimen diameter as 1 inch, while ISO 642:2024 states 25 mm diameter and at least 100 mm length. Those dimensions should be reported as used; they should not be silently blended into a generic “standard Jominy bar.”

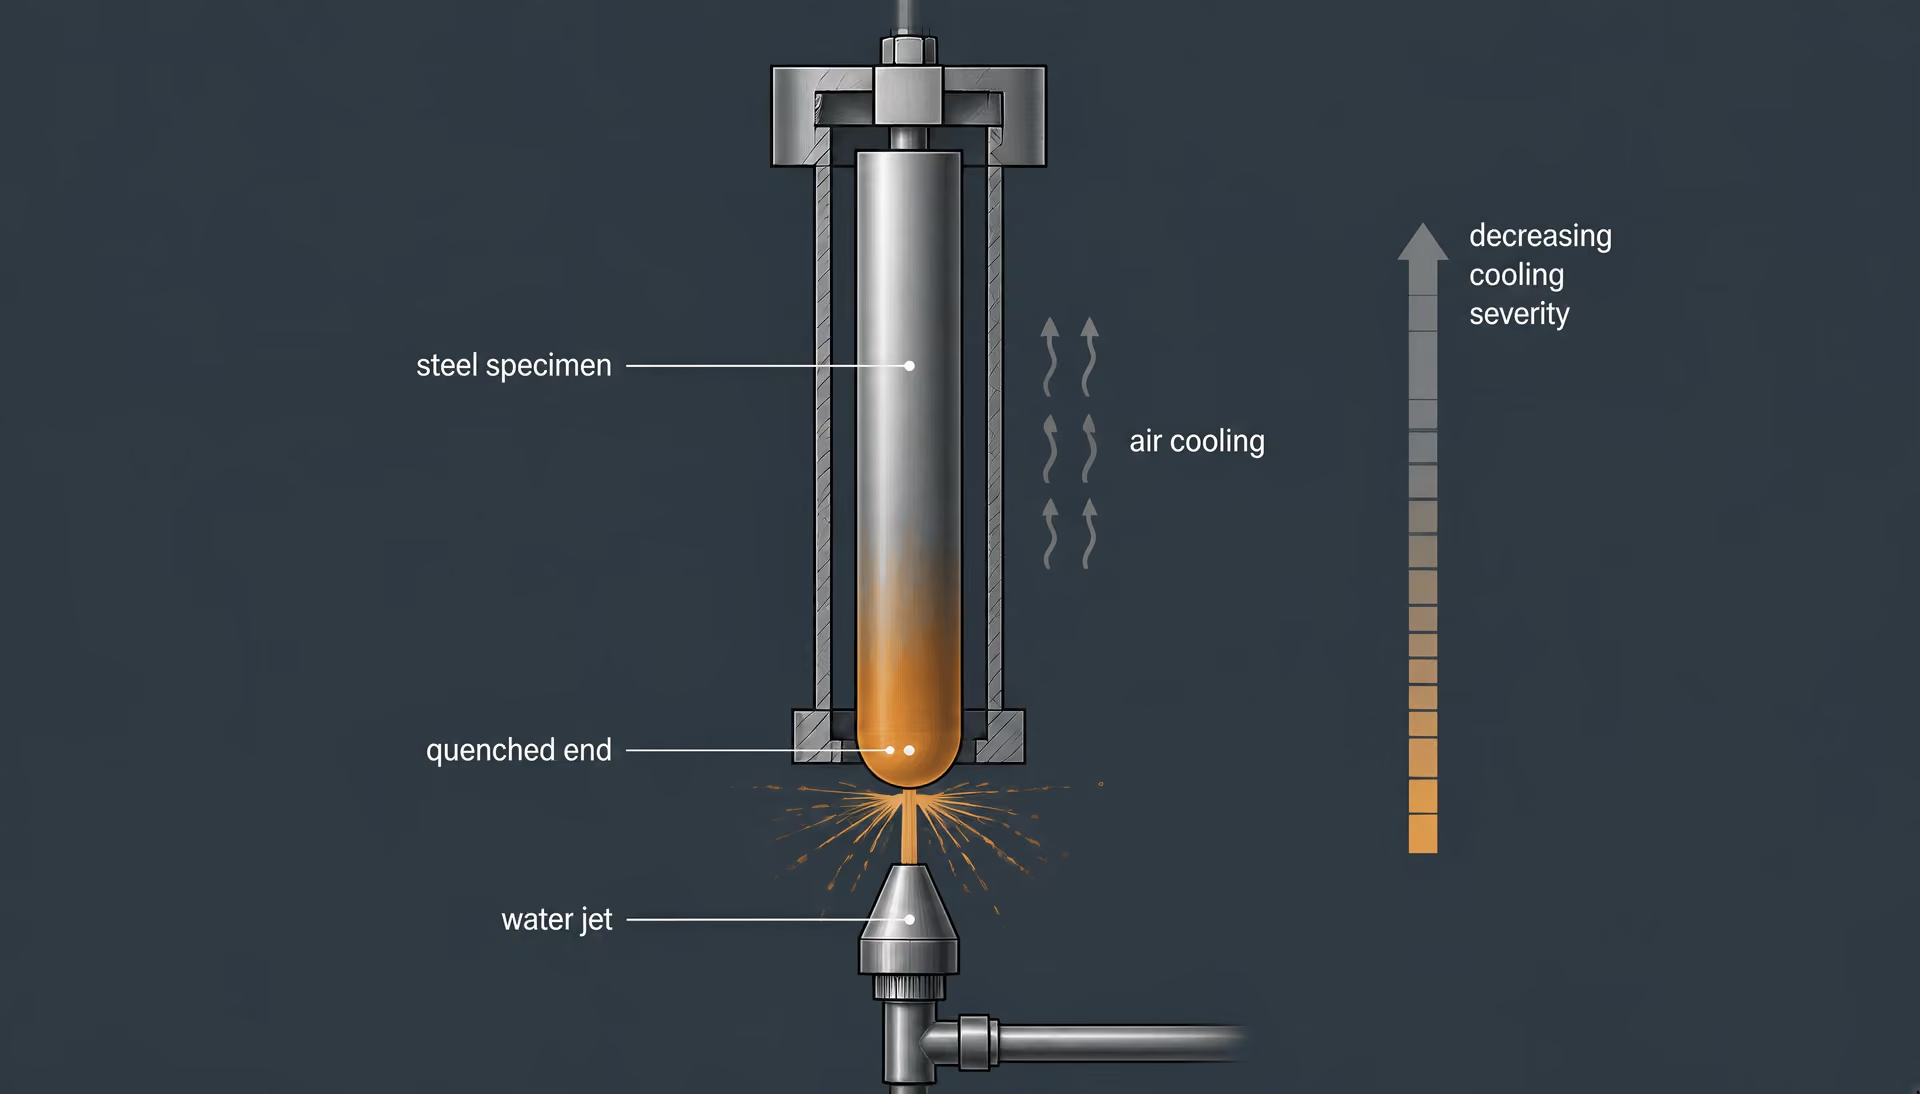
Water-quenching one end
Once the austenitized specimen is positioned in the apparatus, water strikes one end as a controlled jet. The University of Illinois description identifies this water jet as the defining quench action. The Cambridge materials science teaching resource, published in 2012, explains the physical result: one end is water-quenched while the rest of the bar cools in air.
The end under the jet experiences the most severe cooling. Heat leaves that region rapidly, reducing the time available for austenite to transform into ferrite, pearlite, or other slower-forming products before the temperature reaches the martensitic range. A greater fraction of martensite can therefore form at the quenched end, subject to the steel’s composition and prior austenitic condition. Its measured hardness may be high, but that single value is only the response at one location under the most severe part of this particular cooling history.
The rest of the specimen is not directly sprayed. It loses heat through its exposed surfaces and through conduction toward the quenched end, while also exchanging heat with the surrounding air. Consequently, its cooling rate is lower than that at the end, although the exact rate depends on position, specimen geometry, water conditions, temperature, surface state, and the thermal properties of the steel. The test does not impose one uniform cooling rate on the entire cylinder.
This arrangement also explains why the Jominy test is not simply a hardness test with a special fixture. A conventional hardness test might report one value from a selected location. The end-quench test intentionally produces a series of locations with different thermal histories, then compares their hardness responses. The Materials Education Foundation describes the method in those terms: hardness is measured at increasing distances from the quenched end to determine steel hardenability.
Creating a cooling-rate gradient along the test piece
The key measurement is distance from the water-quenched end. Immediately at that end, the cooling is most severe. Moving away from it, cooling becomes progressively less severe, producing a continuous range of cooling rates along the bar, as Cambridge explains. One specimen thus represents many quenching conditions, from a severe water-quench response near the end to slower air-cooled responses farther away.
After cooling, hardness measurements are taken at increasing distances from the quenched end. Those readings are plotted against distance, producing the Jominy hardenability curve. A slowly declining curve indicates that substantial hardness persists farther from the end; a steep decline indicates that hardness is confined nearer to the severe-quench region. The curve describes the distribution of hardness produced by this defined cooling arrangement, which matches the ASM chapter on carbon and low-alloy steels’ definition of hardenability as the property governing the depth and distribution of hardness produced by quenching.
The curve does not by itself state the hardness of every possible component. A thick gear, plate, shaft, or bar has its own surface-to-center temperature gradients, and its quench medium and agitation may differ from the Jominy arrangement. Converting a Jominy distance into an expected component response requires appropriate correlations or a separate heat-treatment analysis. Nor does the curve remove the effects of composition or austenite grain size. Those factors help determine the curve in the first place.
A Jominy test can therefore compare steels or heat-treatment conditions when the specimens and procedures are controlled. It can show how far a steel’s hardness response extends under the prescribed end-quench history. It cannot turn one indentation value into a complete description of hardenability. The useful result is the relationship between hardness and distance, tied to the specimen dimensions, austenitizing treatment, water-quench conditions, hardness method, and applicable standard.
Specimen Geometry and Test Standards
A Jominy result is meaningful only when the specimen, heating cycle, quenching arrangement, hardness measurements, and reporting method are known. The test does not produce a material constant detached from its procedure. It records how a particular steel specimen responds to a defined thermal history, with the measured hardness changing as the distance from the quenched end increases.
That distinction matters because hardness and hardenability answer different questions. Hardness is the resistance measured at a particular location under a specified test method. Hardenability is the depth and distribution of hardness produced when steel is quenched. ASTM A255-20 defines it as “the depth to which steel hardens when quenched.” A Jominy curve therefore needs more information than one hardness number: it needs the distance from the quenched end and the conditions that created the cooling gradient.
ASTM A255 and the 1-inch specimen
ASTM A255-20, Standard Test Methods for Determining Hardenability of Steel, specifies the quantitative end-quench, or Jominy, test using a cylindrical specimen with a 1-inch diameter. That dimension is not a casual description of a test bar. It is part of the test method and affects the thermal response of the specimen before, during, and after the end quench.
The usual procedure begins by heating the cylindrical specimen to the required austenitizing temperature. It is then positioned in the test fixture, and a water jet contacts one end. The quenched end cools most rapidly; locations farther away receive less direct cooling and therefore cool under different conditions. After cooling, hardness is measured at increasing distances from the quenched end, and those readings are plotted to form a hardenability curve. The University of Illinois Materials Technology and Innovation Laboratory describes this sequence as heating a cylindrical specimen to the austenitizing temperature, quenching one end with a water jet, and measuring hardness along the specimen.
The geometry creates a controlled range rather than a single cooling rate. As the University of Cambridge explains, one end is water-quenched while the remainder cools in air, producing a continuous range of cooling rates along the bar. The curve consequently shows how far the steel retains its ability to form hard transformation products as the cooling severity decreases with distance.
A steep fall in hardness may indicate that the steel hardens strongly only near the quenched end. A flatter curve indicates that hardness is retained farther from that end under the test conditions. Neither observation should be converted into a universal statement about every possible component. Actual parts have different diameters, shapes, furnace histories, transfer times, and quench media. A Jominy curve is a standardized comparison of response, not a direct hardness map for every geometry.
ASTM A255 also matters when the material is identified by a grade designation. A reported result for a carbon or low-alloy steel should identify the grade, heat or sample identity where applicable, specimen orientation if relevant to the test record, and the governing edition of the method. Steel composition and austenite grain size are primary influences on hardenability, as ASM International notes. The curve is therefore tied both to the tested material and to its prior thermal condition.
ISO 642:2024 and the 25 mm by at least 100 mm test piece
ISO 642:2024, Steel—Hardenability test by end quenching (Jominy test), specifies a test piece 25 mm in diameter and at least 100 mm long. This geometry resembles the ASTM arrangement, but “similar” does not mean “identical.” A 25 mm diameter is approximately 0.4 mm smaller than 1 inch, or 25.4 mm. That difference may appear minor, yet a standards-based test is defined by its stated dimensions and procedures, not by visual resemblance.
The ISO designation also establishes a minimum length: the test piece must be at least 100 mm long. The diameter and length are read together with the requirements for heating, positioning, end quenching, surface preparation, hardness testing, and result presentation. A laboratory cannot establish conformity to ISO 642:2024 merely by placing any bar under a water jet and plotting hardness. The full method governs the result.
This is particularly important when data are transferred between laboratories or compared with published curves. Two records might both use the word “Jominy,” yet one may identify ISO 642:2024 and the other ASTM A255-20. Their nominal test principle is the same: a heated steel piece is quenched at one end and hardness is measured at progressively greater distances. Their dimensional and procedural requirements must still be checked before the curves are treated as directly equivalent.
The ISO test piece’s minimum length also illustrates why a specimen dimension is not an isolated number. There must be enough material beyond the quenched end to provide the intended range of cooling response and measurement locations. Changing the length, end condition, fixture, water delivery, or timing can alter the thermal history. The measured curve then describes the altered test, not necessarily the response specified by ISO 642:2024.
Why standards and specimen dimensions must not be conflated
ASTM A255 and ISO 642:2024 describe closely related end-quench tests, but the standards should be named rather than collapsed into an undefined “Jominy value.” The ASTM method specifies a 1-inch-diameter cylindrical specimen. ISO 642:2024 specifies a 25 mm diameter test piece at least 100 mm long. Those are grounded dimensional requirements, not interchangeable labels.
| Report field | Information to record |
|---|---|
| Material identity | Grade, governing specification, heat or cast number, product form, and specimen identification |
| Thermal cycle | Heating method, austenitizing temperature, holding time, atmosphere, and transfer time |
| Specimen and standard | Named standard and edition, measured dimensions, end preparation, and deviations |
| Quench | Quenched end, water condition, nozzle or jet details, alignment, and duration |
| Hardness data | Scale, instrument, surface preparation, measurement distances, raw readings, and curve |
| Acceptance basis | Applicable drawing, product specification, customer requirement, or descriptive-only status |
A sound report should therefore state the standard and edition, specimen dimensions, steel identification, austenitizing conditions, quenching details, hardness scale, measurement distances, and the resulting curve or data table. If a laboratory modifies a required dimension or procedure, the report should identify the test as modified rather than implying exact compliance.
This reporting discipline prevents a common error: assigning a single hardness value to hardenability. A hardness reading at 10 mm, 20 mm, or another distance describes one point on a response curve. It does not establish the whole depth or distribution of hardening. The Materials Education Foundation describes the Jominy test as measuring hardness at increasing distances from a quenched end to determine steel hardenability; the plural measurement locations are central to the method.
The standard is part of the result. Without it, “Jominy hardness” leaves unanswered which specimen geometry, cooling arrangement, preparation, and measurement rules were used. With the standard identified, the curve has a defined meaning and can be compared with appropriate caution.
From Quench Distance to a Hardenability Curve
A Jominy test turns one quenched specimen into a range of hardness observations. The key variable is not simply how hard the steel is at one location. It is how the measured hardness changes as the local cooling rate becomes slower with increasing distance from the quenched end.
ASTM A255-20 defines hardenability as the depth to which steel hardens when quenched. Its quantitative end-quench method uses a cylindrical specimen 1 inch in diameter (ASTM International, 2020). ISO 642:2024 specifies a steel test piece 25 mm in diameter and at least 100 mm long for the end-quench test (International Organization for Standardization, 2024). These dimensions are close, but they should not be treated as interchangeable descriptions of every test. The applicable standard controls the specimen, heating, quenching, hardness method, and reporting requirements.
The test begins by heating the cylindrical piece to the specified austenitizing temperature. One end is then exposed to a water jet, while the rest of the bar cools in air. The University of Illinois describes this sequence as the basis of the Jominy procedure (University of Illinois Materials Technology and Innovation Laboratory, 2024). Because the quenched end loses heat fastest, it experiences the most severe cooling. Cooling becomes progressively less severe farther along the bar. The University of Cambridge describes this arrangement as producing a continuous range of cooling rates along the specimen (University of Cambridge, 2012).

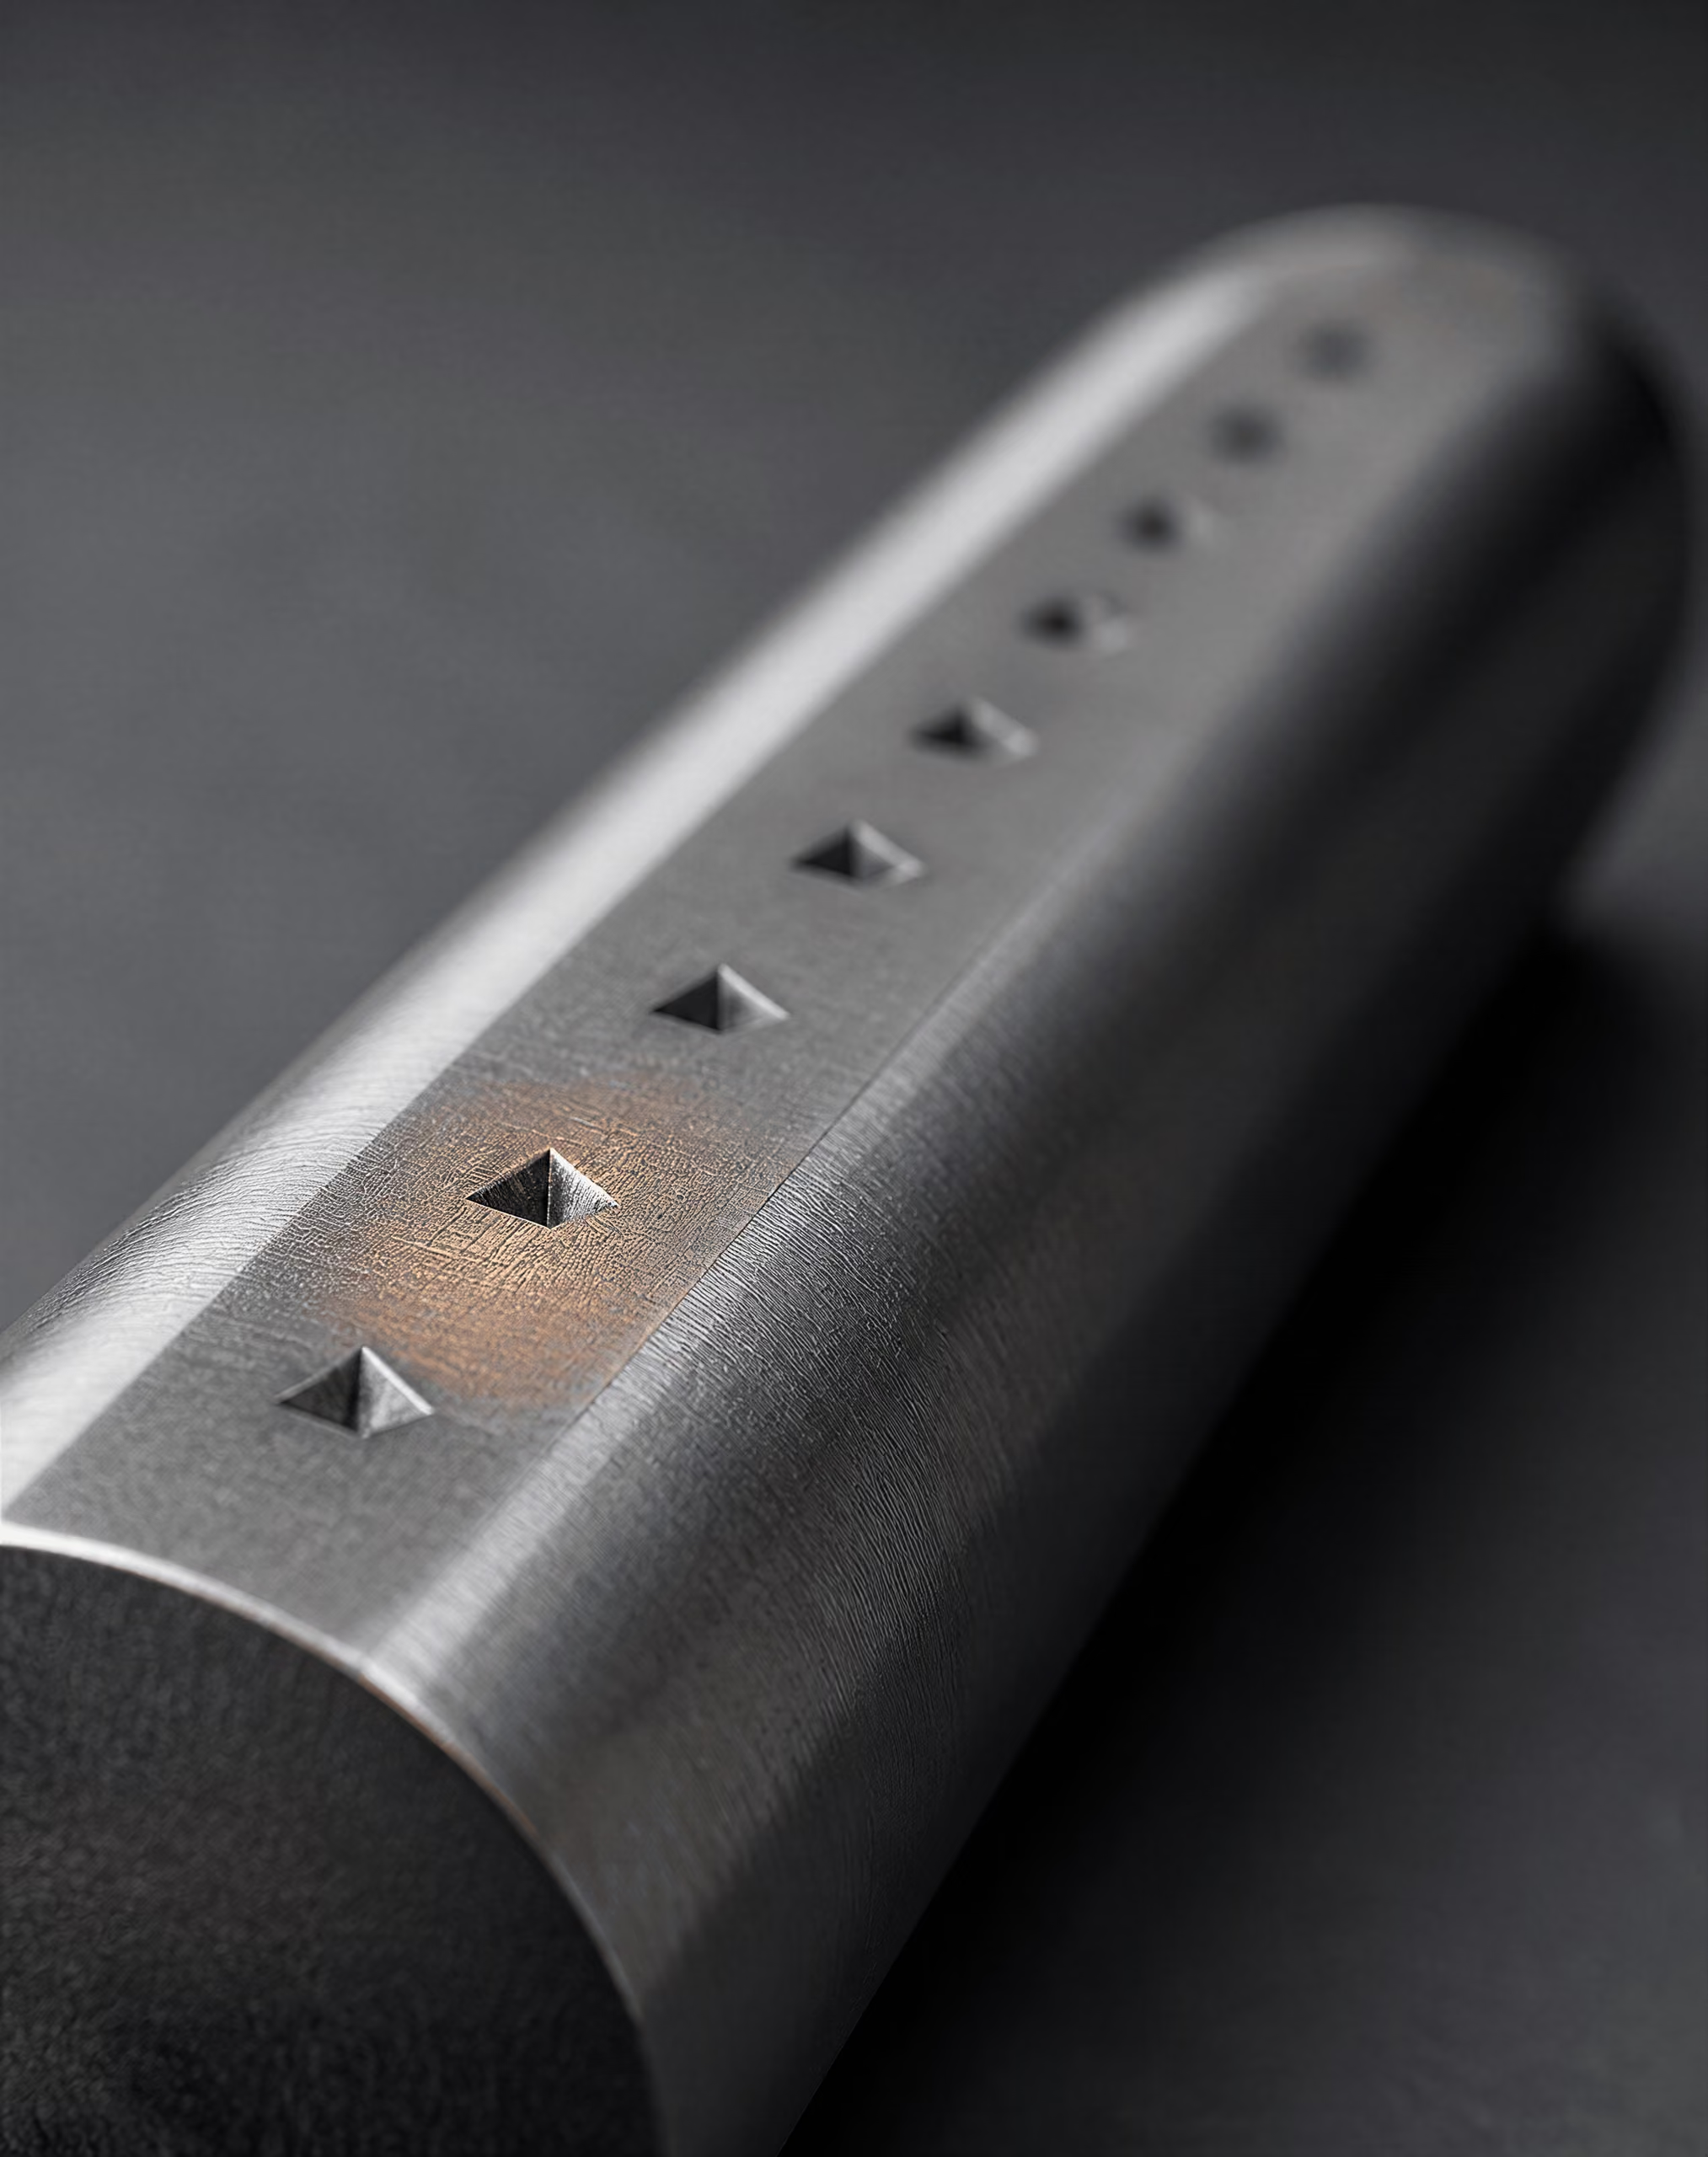
Preparing the hardness measurement surfaces
Hardness cannot be measured reliably on a surface covered by scale, decarburized material, rough machining marks, or an uneven oxide layer. After the specimen has completed the prescribed quench and has cooled sufficiently for handling, the surface used for readings is prepared so that the indenter encounters sound steel rather than altered or damaged material.
The quenched end itself is not the only relevant location. The measurement surface runs lengthwise from that end, allowing hardness readings to be taken at known distances. Surface preparation must therefore produce a reasonably flat, clean strip along the bar. Grinding or machining removes scale and the near-surface layer affected by heating, while controlled finishing limits errors caused by grooves, waviness, or excessive grinding heat. The preparation should not introduce a new thermal effect or remove so much material that the intended specimen geometry and measurement locations are changed.
The exact finishing practice, hardness scale, spacing, and reporting format belong to the selected test standard. ASTM A255-20 and ISO 642:2024 should not be mixed casually: a laboratory following ASTM requirements should prepare and measure the specimen as ASTM specifies, while an ISO test should follow ISO 642. The point is procedural, not cosmetic. A hardness impression made on scale or decarburized steel may report the condition of that surface rather than the quenched steel beneath it.
The surface also needs enough width and separation between impressions for the hardness readings to remain independent. Indentations placed too close together, too near an edge, or on a visibly defective area can distort the result. If the surface is curved or poorly finished, the indenter may not seat correctly. These are reasons a Jominy result is a controlled measurement sequence rather than an informal hardness check made anywhere on the bar.
Measuring hardness at increasing distances
Once the measurement surface is ready, hardness is recorded at a series of increasing distances from the water-quenched end. The first reading represents steel that cooled under the severest condition in the test. Later readings represent locations that cooled more slowly. The distance is measured from the quenched end along the specimen, and each reading is paired with its exact position.
The Materials Education Foundation describes the Jominy test as measuring hardness at increasing distances from a quenched end to determine steel hardenability (Materials Education Foundation, 2024). That wording captures the essential distinction: the test does not ask only, “How hard is this steel?” It asks, “How does the steel’s hardness response change as the cooling condition changes along a defined specimen?”
The hardness scale must be identified. For many steel Jominy results, hardness is reported using Rockwell C where the material is sufficiently hard for that scale, but the selected standard and the measured range determine the permitted method. A value without its scale is incomplete. “52” could refer to HRC, another Rockwell scale, or a different hardness method, and those values cannot be compared as though they describe the same property.
A single reading near the quenched end may show the hardness achieved under one severe cooling condition. It does not establish how far that hardness extends. Likewise, a hardness reading taken farther from the end may reflect slower cooling, but it cannot by itself describe the full transition from high to low hardness. Hardenability is a distribution of response, not a single hardness number.
Steel chemistry and austenite grain size are primary influences on this response, according to ASM International (1990). Carbon affects the attainable hardness of the transformed structure, while alloying elements and grain size affect the cooling conditions required for competing transformations. The Jominy curve records the combined result of those factors under the specified test history. It does not isolate composition or grain size on its own.
Plotting hardness against distance from the quenched end
The readings become a hardenability curve when hardness is plotted on the vertical axis against distance from the quenched end on the horizontal axis. The vertical axis must state the hardness scale, such as HRC where applicable. The horizontal axis must state the distance units and the reference point: zero is the water-quenched end, and increasing distance means progressively less severe cooling.
How to read a Jominy curve
- Curve height Shows hardness produced near a specified cooling condition.
- Curve slope Shows how quickly hardness declines as cooling becomes less severe.
- Curve persistence Shows how far hardness remains elevated from the quenched end.
- Curve scatter May indicate measurement variation, preparation issues, or material variability.
The curve normally starts with the hardness measured nearest the quenched end and then traces the hardness response along the bar. A steep decline means hardness falls substantially over a short distance. In practical terms, the steel retains its high quenched hardness only over a relatively limited part of this test specimen. A more gradual decline means the measured hardness remains higher farther from the quenched end, indicating greater hardening depth under the Jominy cooling gradient. The shape matters as much as the first point.
The curve should be drawn from the measured observations, not replaced by one selected value. Replicate tests, permitted fitting methods, measurement uncertainty, and the reporting rules of ASTM A255-20 or ISO 642:2024 determine how the final result is presented. A smooth line can help show the trend, but it must not conceal scattered readings or suggest precision the measurements do not support.
A Jominy curve is a response to a defined end-quench history. It can compare steels tested under the same requirements and show how hardness changes with distance. It cannot, by itself, predict the exact hardness profile in a thick gear, plate, shaft, or casting quenched in a particular tank. Component geometry, agitation, quenchant, transfer time, austenitizing practice, and initial microstructure alter the cooling history. The curve is therefore evidence of hardenability under the specified test conditions—not a substitute for a single-component heat-treatment analysis.
Cooling Rate, Transformation, and the Meaning of the Curve
Continuous cooling conditions along the bar
A Jominy specimen does not experience one quench severity from end to end. It experiences a gradient. In the standardized test, a cylindrical steel specimen is first heated to its austenitizing temperature, then one end is exposed to a water jet while the rest of the specimen cools in air. The University of Illinois Materials Technology and Innovation Laboratory describes this sequence as the basic Jominy procedure (2024). The water-cooled end loses heat rapidly; positions farther away receive less direct cooling and exchange heat mainly through the specimen and surrounding air.
That arrangement creates a continuous range of cooling conditions along the bar, as the University of Cambridge explains in its account of the test (2012). The exact cooling history is not determined by distance alone. It also depends on specimen geometry, the initial temperature, the water-jet arrangement, the condition of the quench, the exposed surfaces, and the thermal properties of the steel. Distance is therefore a controlled location in the test, not a universal conversion into one cooling rate that applies to every specimen or every production component.
The dimensions are part of the method, not incidental details. ASTM A255-20 specifies the quantitative end-quench test with a cylindrical specimen 1 inch in diameter. ISO 642:2024 specifies a test piece 25 mm in diameter and at least 100 mm long. Those designations and dimensions should not be casually mixed when comparing results, because a change in geometry or procedure can alter heat flow and thus the transformation response. A Jominy curve has meaning only in relation to the standard and test conditions under which it was produced.
The bar is also not a miniature component with a simple “surface versus center” cooling pattern. A component quenched in oil, water, polymer solution, or gas develops a spatial cooling field governed by its shape and by heat transfer at its surfaces. The Jominy specimen supplies a repeatable laboratory gradient instead. It samples many cooling severities in one test, but it does not reproduce every component geometry.
This distinction matters because hardenability is a response to a defined thermal history. ASTM A255-20 defines it as the depth to which steel hardens when quenched. The ASM chapter on carbon and low-alloy steels describes the same property as governing the depth and distribution of hardness produced by quenching (ASM International, 1990). Neither definition says that hardenability is the hardness number of the steel before or after quenching.
Austenite transformation during quenching
Heating converts the starting structure into austenite, provided the selected austenitizing treatment is appropriate for the grade and condition. Quenching then removes heat quickly enough, or slowly enough at a given position, to determine which transformations can occur as the austenite cools. The critical question is not simply how cold the specimen becomes. It is how long the austenite remains within temperature ranges where diffusional products can form before the material reaches lower-temperature transformation conditions.
At the water-quenched end, the cooling history may suppress transformations that would otherwise produce ferrite, pearlite, or bainitic constituents, allowing a greater proportion of the austenite to transform to martensite on further cooling. Farther from the quenched end, the less severe thermal path gives competing transformations more opportunity to begin. The final structure can then contain a different mixture of transformation products, and its hardness can fall accordingly. The curve records this change, but it does not by itself identify every constituent or give a phase fraction.
That restraint is essential. A hardness reading cannot establish a complete transformation diagram, and a Jominy curve cannot be read as a direct list of cooling rates unless those rates have been separately determined for the same apparatus and conditions. The curve is an indirect record: each distance corresponds to a particular thermal response in that test, and the measured hardness reflects the microstructure produced by that response.
Composition controls how readily transformations are delayed or permitted during cooling. Carbon strongly affects the hardness that martensite can attain, while alloying elements can shift transformation behavior and increase the depth over which a quench produces a hard martensitic structure. Austenite grain size is also important. ASM identifies steel composition and austenite grain size as primary factors affecting hardenability (ASM International, 1990). A larger prior-austenite grain size can alter nucleation conditions and transformation kinetics, so two specimens of nominally the same grade can produce different curves if their thermal histories or grain structures differ.
The test therefore measures the response of a particular material condition, not an abstract grade label. Austenitizing temperature, holding time, prior processing, grain size, surface condition, and quenching details all influence what the austenite becomes. A result from one condition should not be treated as proof that every heat treatment of that designation will produce the same curve.
Why hardness changes with distance
Hardness changes with distance because distance changes the cooling history, and the cooling history changes the resulting microstructure. Near the quenched end, the specimen loses heat most severely. Farther away, heat remains in the bar longer and escapes under different conditions. The resulting structures can therefore range from predominantly martensitic material near the end to mixtures containing softer transformation products at locations that cooled less severely. The precise transition is grade- and condition-dependent; it should be measured, not invented from a generic diagram.
| Factor | Main influence | Interpretive caution |
|---|---|---|
| Carbon content | Strongly affects attainable martensitic hardness | Higher hardness potential does not guarantee deeper hardening |
| Alloying additions | Can delay ferrite, pearlite, or bainite transformations | Effect depends on the complete composition and condition |
| Austenite grain size | Changes transformation nucleation and kinetics | Coarse grains may increase hardenability but can reduce toughness |
| Section size and geometry | Change local cooling rates in a component | A Jominy distance is not a direct component location |
Carbon content contributes to the measured value, but it does not explain the whole curve. Martensite hardness depends strongly on carbon, so two steels with different carbon contents may show different hardness levels even if their hardening response is otherwise similar. Conversely, steels with comparable carbon content can show different hardness at the same Jominy distance when alloying, grain size, cleanliness, or austenitizing practice changes the transformation behavior.
The measured value also depends on the hardness method and test preparation. Surface decarburization, roughness, alignment, spacing between indentations, measurement scale, and local defects can distort the result. The test is normally made at successive distances from the quenched end after preparing a longitudinal flat or otherwise specified measuring surface, then plotting hardness against distance. The Materials Education Foundation describes this basic interpretation: hardness is measured at increasing distances from the quenched end to determine hardenability (2024).
The plotted line is thus not a direct hardness rating for the entire steel. It is a map of hardness response under the Jominy thermal gradient. A relatively high value far from the quenched end indicates that the steel retained a hardening response under a less severe cooling condition than the end experienced. A rapid decline indicates that the microstructure becomes softer as cooling becomes less severe. Those statements concern the shape and position of the response curve, not a universal ranking based on one isolated hardness number.
A component engineer can use the curve to compare the cooling response of a steel with the cooling conditions expected in a part, but only after accounting for section size, geometry, quench medium, and heat-treatment practice. The Jominy result does not prove that a component will have identical hardness at every corresponding location. It supplies controlled evidence about how the steel transforms as cooling severity decreases. That is the meaning of the curve, and it is why hardenability must remain separate from hardness.
Composition and Austenite Grain Size
Hardenability is not a synonym for hardness. ASTM A255-20 defines hardenability as the depth to which steel hardens when quenched, while the ASM Handbook describes it as the property governing the depth and distribution of hardness produced by quenching. A steel may reach a high hardness near a quenched surface yet lose hardness rapidly toward the interior. Another steel may show a similar surface hardness while retaining martensite, and therefore useful hardness, farther from the quenched surface.
The distinction becomes clear in the Jominy end-quench test. ASTM A255-20 specifies a 1-inch-diameter cylindrical specimen; ISO 642:2024 specifies a test piece 25 mm in diameter and at least 100 mm long. The dimensions are not interchangeable details when results are compared. The specimen is heated to its specified austenitizing condition, suspended vertically, and quenched at one end by a water jet. The University of Illinois describes hardness measurements taken at increasing distances from that quenched end, while the University of Cambridge explains that the water-cooled end and the air-cooled remainder create a continuous range of cooling rates along the bar. A graph of hardness against distance is the Jominy hardenability curve.
The curve is a response to composition, prior thermal history, specimen geometry, austenitizing treatment, and the imposed cooling pattern. It is not a single material constant detached from test conditions. ASM International identifies steel composition and austenite grain size as primary factors affecting hardenability. Those factors act through different mechanisms and should not be collapsed into the one question, “How hard is the steel?”
The role of steel composition
Hardenability The ability of steel to develop and retain hardness to a greater depth during a defined quench; it is distinct from maximum hardness.
Composition affects hardenability mainly by changing the temperatures and rates at which austenite transforms during cooling. Alloying elements such as manganese, chromium, nickel, and molybdenum can delay transformations from austenite to ferrite, pearlite, or bainite. With those transformations shifted to longer times, a greater portion of a section can avoid them during quenching and form martensite instead. The result is a deeper hardness profile, provided the cooling rate and the steel’s carbon content allow martensite to form.
Carbon participates in this picture, but its roles must be separated. It contributes strongly to the hardness that martensite can attain. Alloying additions, by contrast, are especially important in changing transformation kinetics and therefore the cooling rate required to suppress diffusional products through the section. Carbon also changes transformation behavior, so the division is not absolute; it is a distinction of emphasis. Saying that “more alloy means harder steel” is too crude. A more accurate statement is that alloy content can make a given cooling history more capable of producing martensite at depth, whereas carbon largely sets the attainable hardness of that martensite, along with factors such as tempering and microstructure.
Composition must therefore be identified by exact grade, specification, and applicable designation. “4140,” for example, refers to a chromium-molybdenum alloy steel designation, but a reported result still requires the relevant product specification, chemistry limits, heat treatment, and test method. A grade name does not erase allowed composition ranges. Two heats within the same designation can occupy different positions within those limits, and small changes in carbon or alloy content can alter transformation behavior. “Low-alloy steel” is a useful family description, not a sufficient chemical definition for comparing two Jominy curves.
The same caution applies to carbon steels and case-hardening grades. A plain-carbon steel and a nickel-chromium-molybdenum steel can have similar hardness at the quenched end but different slopes and different distances over which hardness is retained. Conversely, a high-carbon composition may produce high near-surface hardness without hardening deeply in a large section. The curve supplies the evidence for the cooling condition tested; the nominal grade alone does not.
The Jominy result also cannot be transferred directly to every component shape. A cylindrical bar, a plate, and a complex forging lose heat differently. Section size, surface condition, quenchant agitation, and the presence of corners change the local cooling history. Grossman hardenability analysis and other engineering methods can relate material response to severity of quenching and section geometry, but a Jominy curve by itself does not state the hardness at every location in an arbitrary part.
Carbon content and attainable martensitic hardness
Martensite forms when austenite is cooled sufficiently rapidly to prevent or limit diffusional transformation, but the hardness of that martensite depends strongly on carbon dissolved in the austenite before quenching. Increasing carbon generally raises attainable untempered martensitic hardness over the useful carbon range because carbon distorts the martensitic lattice and increases resistance to deformation. This is a hardness effect, not a license to use carbon content as a complete measure of hardenability.
A low-carbon steel can harden through a section under a suitable cooling history and still show a lower maximum hardness than a higher-carbon steel. The higher-carbon steel may show a very hard Jominy end yet have a steep drop in hardness with distance if its composition does not sufficiently delay pearlite, ferrite, or bainite formation. The low-carbon alloy steel may show a lower hardness ceiling but maintain that hardness farther from the quenched end. Those are different outcomes: attainable martensitic hardness versus depth of hardening.
Carbon also affects the amount and stability of austenite during austenitizing. If carbon is not adequately dissolved, the austenite composition differs from the nominal bulk composition; if excessive dissolution occurs, grain growth and other changes may follow. The measured curve consequently reflects the selected austenitizing temperature and holding practice, not chemistry alone. After quenching, tempering further changes hardness, so a tempered hardness profile should not be compared with an as-quenched Jominy curve as if both represented the same condition.
A hardness number at the water-quenched end is therefore incomplete evidence. It may indicate the hardness available from the local martensitic composition, but it does not show how quickly hardness declines, where mixed microstructures begin, or how much of a larger section can harden. The distance-dependent curve is the relevant measurement.
Austenite grain size as an influence on hardenability
Prior-austenite grain size affects hardenability because transformation products such as ferrite and pearlite commonly nucleate at austenite grain boundaries. Coarser austenite grains provide less grain-boundary area per unit volume, reducing the number of potential nucleation sites and tending to delay diffusional transformation during cooling. That delay can allow martensite to form at a lower cooling rate, so a coarser prior-austenite grain size can increase the measured hardenability.
The effect is not a free improvement. Grain growth can reduce toughness and alter dimensional behavior, and excessive grain size may be unacceptable even when it raises the apparent depth of hardening. Fine grains usually promote earlier diffusional transformation but can provide better toughness and more stable mechanical performance. The useful choice depends on the component, heat treatment, and required properties rather than on maximizing one Jominy distance.
Grain size also explains why curves cannot be compared without their prior heat-treatment histories. Two specimens cut from the same specification may produce different results if one was normalized, another was held longer at a higher austenitizing temperature, or the heating and cooling practice produced different prior-austenite grain sizes. Carbides, undissolved alloy-rich particles, and segregation can further affect the austenite composition available during quenching. The test report should therefore identify the austenitizing temperature, holding time, specimen condition, and measurement procedure alongside the chemistry.
A Jominy curve is meaningful when those variables are controlled. Composition determines, among other things, how transformation kinetics respond to cooling; carbon helps set the hardness of the martensite that forms; and austenite grain size changes the ease with which competing transformations begin. Together they explain why hardenability is a measured response rather than a hardness label. When grade, grain size, prior treatment, specimen dimensions, and test standard are held clear, the curve can support a defensible comparison. Without them, a hardness value or an unlabeled curve invites the exact confusion that the test is meant to prevent.
Carbon Steels, Low-Alloy Steels, and Grade Comparisons
Carbon-steel response to quenching
Carbon steel does not have one fixed hardenability response. Its behavior depends on carbon content, prior austenite grain size, section size, austenitizing practice, and the severity of the quench. Carbon content strongly affects the hardness that martensite can reach, but that fact alone does not establish how far a given steel will harden from a quenched surface. A small specimen may develop high surface hardness while a larger section retains ferrite, pearlite, or bainite toward its center because the interior cools more slowly.
This distinction is central to the ASM chapter Hardenability of Carbon and Low-Alloy Steels, published in 1990. The chapter defines hardenability as the property governing the depth and distribution of hardness produced by quenching, rather than the maximum hardness measured at one location. ASTM A255-20 uses closely related language, defining hardenability as “the depth to which steel hardens when quenched” (ASTM International, 2020). Hardness is therefore an observed value at a specified point; hardenability describes the pattern of response through the material.
In a plain-carbon steel, increasing carbon generally raises the attainable hardness of fully martensitic regions, subject to the steel’s microstructure and heat treatment. It does not follow that every higher-carbon grade will produce a deeper or more uniform hardened zone under every quench. Carbon also affects the transformation behavior of austenite, while manganese and residual elements may shift the response even when the designation is described broadly as “carbon steel.” The actual chemistry range matters.
The Jominy end-quench test makes this spatial response visible. As described by the University of Illinois Materials Technology and Innovation Laboratory, a cylindrical specimen is heated to its specified austenitizing temperature and one end is quenched with a water jet (University of Illinois, 2024). Hardness is then measured at increasing distances from the quenched end. The resulting hardness-versus-distance plot is the Jominy curve.
The curve exists because the specimen does not cool at one uniform rate. The Cambridge materials-transformation resource explains that water cooling at one end and air cooling over the remainder produces a continuous range of cooling rates along the bar (University of Cambridge, 2012). Near the jet, austenite experiences the most severe cooling; farther away, the cooling rate decreases. A carbon steel whose hardness falls sharply with distance has a different hardenability response from one that maintains a similar hardness farther along the specimen, even if both show the same hardness at the quenched end.
Test geometry and procedure must remain attached to the result. ASTM A255-20 specifies a 1-inch-diameter cylindrical specimen for the quantitative end-quench test. ISO 642:2024 specifies a test piece 25 mm in diameter and at least 100 mm long for the steel end-quench test. Those dimensions are close but should not be silently treated as interchangeable specifications. Austenitizing temperature, holding time, furnace atmosphere, transfer time, water temperature, jet condition, hardness scale, measurement spacing, and surface preparation can all affect the reported curve.
Low-alloy additions and through-hardening response
Low-alloy additions change hardenability mainly by delaying transformations that compete with martensite formation during cooling. Manganese, chromium, molybdenum, and nickel can alter the temperature and timing of ferrite, pearlite, and bainite formation. With those transformations postponed, a slower-cooling interior may still reach the martensitic range. That is the metallurgical basis for a greater through-hardening response in many alloy steels.
The effect is not a simple “more alloy equals more hardness” rule. Alloying elements can influence hardenability, carbide formation, tempering response, retained austenite, and the hardness of the final microstructure through different mechanisms. Chromium and molybdenum, for example, may participate in carbide populations and affect transformation kinetics; nickel changes transformation behavior without acting in exactly the same way as a strong carbide-forming element. Manganese can increase hardenability, but its effect must be considered with carbon, sulfur control, prior processing, and the rest of the composition. Small additions of boron can have a substantial hardenability effect when present in the correct metallurgical condition, but its result depends on carbon, nitrogen, titanium or aluminum practice, and processing history.
ASM identifies steel composition and austenite grain size as primary factors affecting hardenability (ASM International, 1990). Grain size matters because larger prior-austenite grains provide less grain-boundary area for some diffusional transformation products to nucleate. However, grain coarsening is not a free improvement: it can impair toughness and dimensional behavior, so a comparison based only on a measured curve may still be incomplete if the intended heat treatment differs.
The term “through-hardening” needs the same care. It does not mean that every cross section of a steel part will become uniformly martensitic. A Jominy curve supplies a standardized response to a gradient of cooling rates, not a direct prediction for every diameter, geometry, agitation condition, or quenchant. Engineering methods may use Jominy data with section-size and cooling relationships, but the predicted result remains tied to the assumptions behind those methods. A water-quenched bar, an oil-quenched gear, and a polymer-quenched plate do not share one universal cooling history.
Nor does a high hardness value at the Jominy end prove deep hardening. The end is exposed to the most severe cooling and may form martensite even in a steel whose hardness decreases rapidly a short distance away. Conversely, a lower measured hardness can reflect carbon content, tempering, retained austenite, or a mixture of phases rather than poor hardenability alone. The measurement must be interpreted with the heat treatment and microstructure.
Why grade labels do not replace test data
A designation identifies a specification, nominal composition, or chemical range; it does not supply a measured Jominy curve. Comparing “carbon steel” with “low-alloy steel” is too broad to support a hardenability claim. Even comparisons between named grades require the actual designation exactly as specified, its applicable standard, the heat or product chemistry, and the condition of the test material.
A defensible comparison should identify at least five items: the steel designation and governing standard; the measured chemistry range, including relevant alloy and residual elements; the austenitizing temperature and holding treatment; the quench equipment and medium; and the measurement method and hardness scale. It should also state whether the result comes from ASTM A255, ISO 642, another defined procedure, or a plant-specific test. A curve from a 1-inch ASTM specimen should not be presented as though it were automatically an ISO 642 result, despite the similar nominal test-piece dimensions.
Production variation further limits what a label can establish. Two heats sold under the same designation may differ within the permitted chemistry range. Differences in grain size, forging reduction, normalizing history, decarburization, and austenitizing practice can change the measured response. A published nominal composition therefore provides context, not proof of a particular hardenability curve.
The Materials Education Foundation describes the Jominy method as measuring hardness at increasing distances from a quenched end to determine steel hardenability (Materials Education Foundation, 2024). That wording captures the proper limit of the test: it measures a hardness response generated by a defined cooling gradient. It does not turn a grade name into a universal performance ranking, and it does not replace section-specific validation where cooling conditions or geometry differ.
A sound grade comparison therefore asks, “What response was measured, under which conditions?” It does not ask only which designation is supposedly harder. Only the first question addresses hardenability.
Reading and Comparing Jominy Curves
A Jominy curve is a plot of measured hardness against distance from the quenched end of a steel specimen. The horizontal axis normally begins at the water-cooled end and moves toward the air-cooled end; the vertical axis gives hardness on a specified scale, such as Rockwell C (HRC), Rockwell B (HRB), or Vickers hardness (HV). Read the curve as a record of the steel’s response to a controlled range of cooling conditions, not as a single hardness rating.
ASTM A255-20 defines hardenability as the depth to which steel hardens when quenched and specifies the quantitative end-quench test with a 1-inch-diameter cylindrical specimen. ISO 642:2024 specifies a test piece 25 mm in diameter and at least 100 mm long. Those dimensions are close, but the standards are not interchangeable by assumption. The applicable document controls the test.
Curve height near the quenched end
The left-hand, or quenched-end, portion of the curve shows the hardness produced under the most severe cooling condition in the test. A high value there indicates that the tested material formed a hard transformation product near the surface under that particular austenitizing and water-quenching practice. It does not, by itself, establish high hardenability.
This distinction matters because carbon content has a strong effect on the hardness of martensite, while hardenability also depends on how readily transformations such as pearlite or bainite are suppressed during cooling. Two steels may reach similar hardness close to the quenched end yet diverge substantially farther along the specimen. The steel whose hardness falls slowly has retained a hard microstructure under slower cooling and therefore shows greater hardening depth in this test.
The quenched-end value can also be affected by conditions that are not simply a grade property. Austenitizing temperature and holding time influence the austenite condition. Austenite grain size is a primary factor affecting hardenability, as ASM International reported in its 1990 treatment of steel hardness and hardenability, and excessive grain growth can change the curve. Surface decarburization, oxidation, grinding damage, incorrect water-jet alignment, or a hardness impression placed too close to an edge can distort the first readings.
For that reason, a curve that starts higher should not automatically be described as “more hardenable.” It may have greater as-quenched hardness at the end, greater hardenability, or both. The rest of the profile supplies the evidence needed to separate those effects.
A curve height can still be useful when the question is local hardness response. For example, a specification may require a minimum hardness at a stated Jominy distance. That requirement is an acceptance criterion, not a general definition of what the curve means. Whether a measured value passes must come from the applicable material or product specification.
Curve shape and hardness retention with distance
The central feature of a Jominy curve is its rate of hardness loss as distance increases. The procedure described by the University of Illinois Materials Technology and Innovation Laboratory heats a cylindrical specimen to its austenitizing temperature, quenches one end with a water jet, measures hardness at increasing distances, and plots the results. The University of Cambridge explains why this produces a profile: the quenched end cools rapidly, while locations farther away cool progressively more slowly in air.
A steep downward slope means hardness is lost over a short distance. That steel responds strongly to the change from rapid to slower cooling. A flatter curve means hardness is retained farther from the quenched end. In practical metallurgical terms, the latter response indicates that a larger depth of the specimen can transform to a hard structure under less severe cooling than exists at the end.
The curve need not be a straight line. It may drop sharply near the end, flatten through a middle region, or show a change in slope associated with transformations occurring at different cooling rates. A short plateau followed by a decline and a second flattening should be read as a sequence of responses, not reduced to one “average hardenability” number. The shape reflects composition, austenite grain size, prior microstructure, and the thermal history used for the test. ASM’s 1990 chapter on carbon and low-alloy steels describes hardenability as governing the depth and distribution of hardness produced by quenching, which is why the whole profile matters.
A curve that remains higher at a given distance has retained more hardness under that test condition. It does not prove that every section of a production component will have that hardness. A real component has a different geometry, mass, surface condition, and cooling path. Conversion from a Jominy result to a predicted component response requires a defined cooling model or a method such as Grossman analysis; visual comparison alone cannot supply that conversion.
Nor does a higher curve make a grade universally preferable. A design may require a particular combination of hardness, toughness, distortion control, weldability, and tempering response. The Jominy test addresses one response to one defined quench history. It does not replace mechanical testing or a specification governing the finished part.
When comparing curves, compare corresponding distances and corresponding hardness scales. A curve plotted in HRC cannot be ranked numerically against one plotted in HV without an appropriate, stated conversion method. Hardness conversions are not exact physical identities, especially across different microstructures. The plotted reporting convention also matters: points connected by straight lines, a fitted curve, and an interpolated table can present the same measurements differently.
Scatter, repeatability, and comparison conditions
Real Jominy data contain scatter. Some variation comes from hardness measurement, but larger differences can arise from specimen preparation and thermal practice. The end face must receive the intended water jet, the specimen must be centered correctly, and the hardness track must be prepared without leaving decarburized material or a rough surface. Measurements must be spaced and reported according to the governing procedure.
A single irregular point should not be treated as a metallurgical discovery. First check whether the point lies outside the expected measurement repeatability, whether the indentation spacing was adequate, and whether the specimen surface or hardness scale was correct. Repeated tests that show the same change in curve shape carry more weight than one isolated high or low reading.
Meaningful comparison requires more than testing specimens with the same nominal grade designation. Use the same standard, specimen dimensions, surface preparation, austenitizing temperature, holding practice, transfer time, quench arrangement, hardness scale, measurement locations, and reporting convention. ASTM A255-20 specifies a 1-inch-diameter specimen, while ISO 642:2024 specifies a 25 mm diameter and minimum length of 100 mm; results generated under those standards should be labeled accordingly rather than silently combined.
The steel’s prior condition must also be considered. Composition is important, but so is the austenite grain size established during heating. A laboratory curve from one heat treatment cannot be assumed to represent every heat of the same designation if the austenitizing practice differs. This is one reason a curve should carry its test conditions wherever it is reproduced.
Finally, separate interpretation from compliance. Reading the curve can show that hardness declines rapidly, that hardness is retained farther from the quenched end, or that repeat tests scatter. Only the applicable specification can state the permitted range, minimum value, sampling requirement, and acceptance decision. A Jominy curve is evidence of hardenability under defined conditions—not a standalone product recommendation, grade ranking, or substitute for the acceptance requirements attached to the material.
Jominy, Grossman, and Air-Hardenability Tests
Hardenability is not the same property as hardness. ASTM A255-20 defines hardenability as “the depth to which steel will harden when quenched,” while hardness is the resistance measured at a particular location under a particular test method. A steel may show a high surface hardness yet harden only a short distance below the surface. Another steel may reach a similar hardness at the surface and retain that hardness much farther into a section.
| Method | Thermal history | Primary use | What it does not provide |
|---|---|---|---|
| Jominy end quench | Water-quenched end; remainder cools in air | Hardness-versus-distance response | Exact hardness profile of every component |
| Grossman analysis | Defined quench severity combined with section size | Relate material response to geometry and quench severity | A direct hardness measurement along a test bar |
| Air-hardenability test | Specified air-cooling condition | Assess response under air cooling | A substitute for a water end-quench curve |
The ASM Handbook treats Jominy, Grossman, and air-hardenability tests as related methods for examining this response, not as interchangeable tests. Each imposes a different thermal history. Jominy creates a controlled range of cooling rates along one specimen; Grossman analysis connects a steel’s response with quench severity and component size; an air-hardenability test asks what happens when the specified cooling medium is air. The result from one method cannot be substituted for the result from another without a defined conversion or model.
The Jominy end-quench method
The Jominy end-quench test is a standardized way to obtain a hardenability curve from one cylindrical specimen. ASTM A255-20 specifies a 1-inch-diameter cylindrical specimen for the quantitative end-quench test. ISO 642:2024 specifies a steel test piece 25 mm in diameter and at least 100 mm long. Those dimensions are close in practical terms, but the standards remain separate documents with their own requirements for preparation, heating, quenching, hardness measurement, and reporting.
The basic sequence is straightforward. A machined specimen is heated to the specified austenitizing temperature, held long enough for the prescribed thermal condition, and transferred to a fixture. A water jet strikes one end. The University of Illinois Materials Technology and Innovation Laboratory describes this heating and one-end water-quenching sequence in its 2024 Jominy procedure. After cooling, a flat is commonly prepared along the specimen, and hardness readings are taken at increasing distances from the quenched end.
The physics gives the test its value. The quenched end experiences the most severe cooling, while locations farther away receive progressively less rapid cooling because they are cooled indirectly and partly by air. The University of Cambridge explains that this arrangement produces a continuous range of cooling rates along the bar. A plot of hardness against distance therefore shows how the steel’s measured hardness response changes as the cooling rate decreases.
Near the quenched end, hardness depends strongly on carbon content and on whether the austenite transforms to martensite rather than to softer products such as pearlite or bainite. Farther from the end, alloying elements and austenite grain size become important because they delay diffusional transformations during slower cooling. ASM International identified steel composition and austenite grain size as primary influences on hardenability in its 1990 treatment of hardness and hardenability.
The curve is the result, not a single hardness number. Its shape can indicate how far a steel maintains a given hardness response, but it does not directly state the hardness distribution in every real component. A bar, gear, plate, or forging has its own diameter, geometry, surface condition, austenitizing history, and cooling path. The Jominy specimen also has a special one-dimensional thermal gradient that is not reproduced everywhere in a thick part.
A Jominy curve cannot, by itself, establish that a part will fully harden to its center in oil, water, polymer, or air. Nor can a hardness value taken from the quenched end describe the steel’s complete hardenability. The curve must be interpreted with the intended section size and quench history in mind.
Grossman critical-diameter analysis
Grossman analysis addresses a different engineering question: how do the steel’s transformation response, the size of the section, and the severity of the quench combine to determine hardening depth? It separates two ideas that are often confused. The steel has an intrinsic hardening response, while the quenchant and part geometry control how rapidly heat is removed.
Grossman H factor A parameter used to represent quench severity, linking surface heat transfer with section size and steel hardening response.
The method uses quench severity, commonly represented by the Grossman factor, to describe the effectiveness of heat transfer at the surface. A more severe quench extracts heat more rapidly than a less severe one, although the actual result also depends on agitation, temperature, vapor-film behavior, surface condition, and the shape of the part. Grossman analysis then relates this severity to section size and to a limiting hardening condition.
The ideal critical diameter is the diameter of a hypothetical round bar that would reach a specified center condition under an idealized quench. The actual critical diameter applies the selected quench severity to the part. These terms are not alternative names for the Jominy distance. A Jominy distance is a position along a test bar; a critical diameter is a section-size result generated through an analysis of quench severity and steel response.
Jominy data can provide the steel-response input for Grossman calculations or charts, but the calculation adds assumptions about geometry and heat transfer. Consequently, two components made from the same heat of steel can harden to different depths if their sizes or quenches differ. The same steel can also produce different critical diameters under different values. Grossman analysis is thus a bridge between laboratory response and a defined quenching situation, not an independent hardness test.
Air-hardenability testing
Air-hardenability testing examines a steel under air cooling rather than imposing the Jominy water jet or assigning a Grossman quench-severity value. The specimen is austenitized under the specified procedure, removed from the furnace, and cooled in air under the test conditions. Hardness, microstructure, or hardness variation through the section is then measured as required by the method.
This distinction matters because “air hardening” does not mean that the steel has a fixed hardness independent of size. Cooling in still air, forced air, and a controlled atmosphere produces different heat-transfer conditions. A small specimen may cool rapidly enough to form substantial martensite, while the center of a larger section cools more slowly and forms a different mixture of transformation products. Furnace temperature, specimen dimensions, supports, airflow, and surface condition can all affect the measured response.
An air-hardenability result therefore describes behavior under the stated air-cooling history. It does not replace a Jominy curve, because it does not create the same continuous end-to-end cooling gradient. It does not replace Grossman analysis, because it does not by itself express the relationship between quench severity and a range of section sizes. The three methods answer neighboring questions, but their outputs retain different meanings.
ASM’s 1990 chapter on carbon and low-alloy steels defines hardenability as the property governing the depth and distribution of hardness produced by quenching. That wording is the practical test: ask how hardness is distributed after a specified thermal history, not merely how hard one point becomes.
From a Jominy Curve to a Real Component
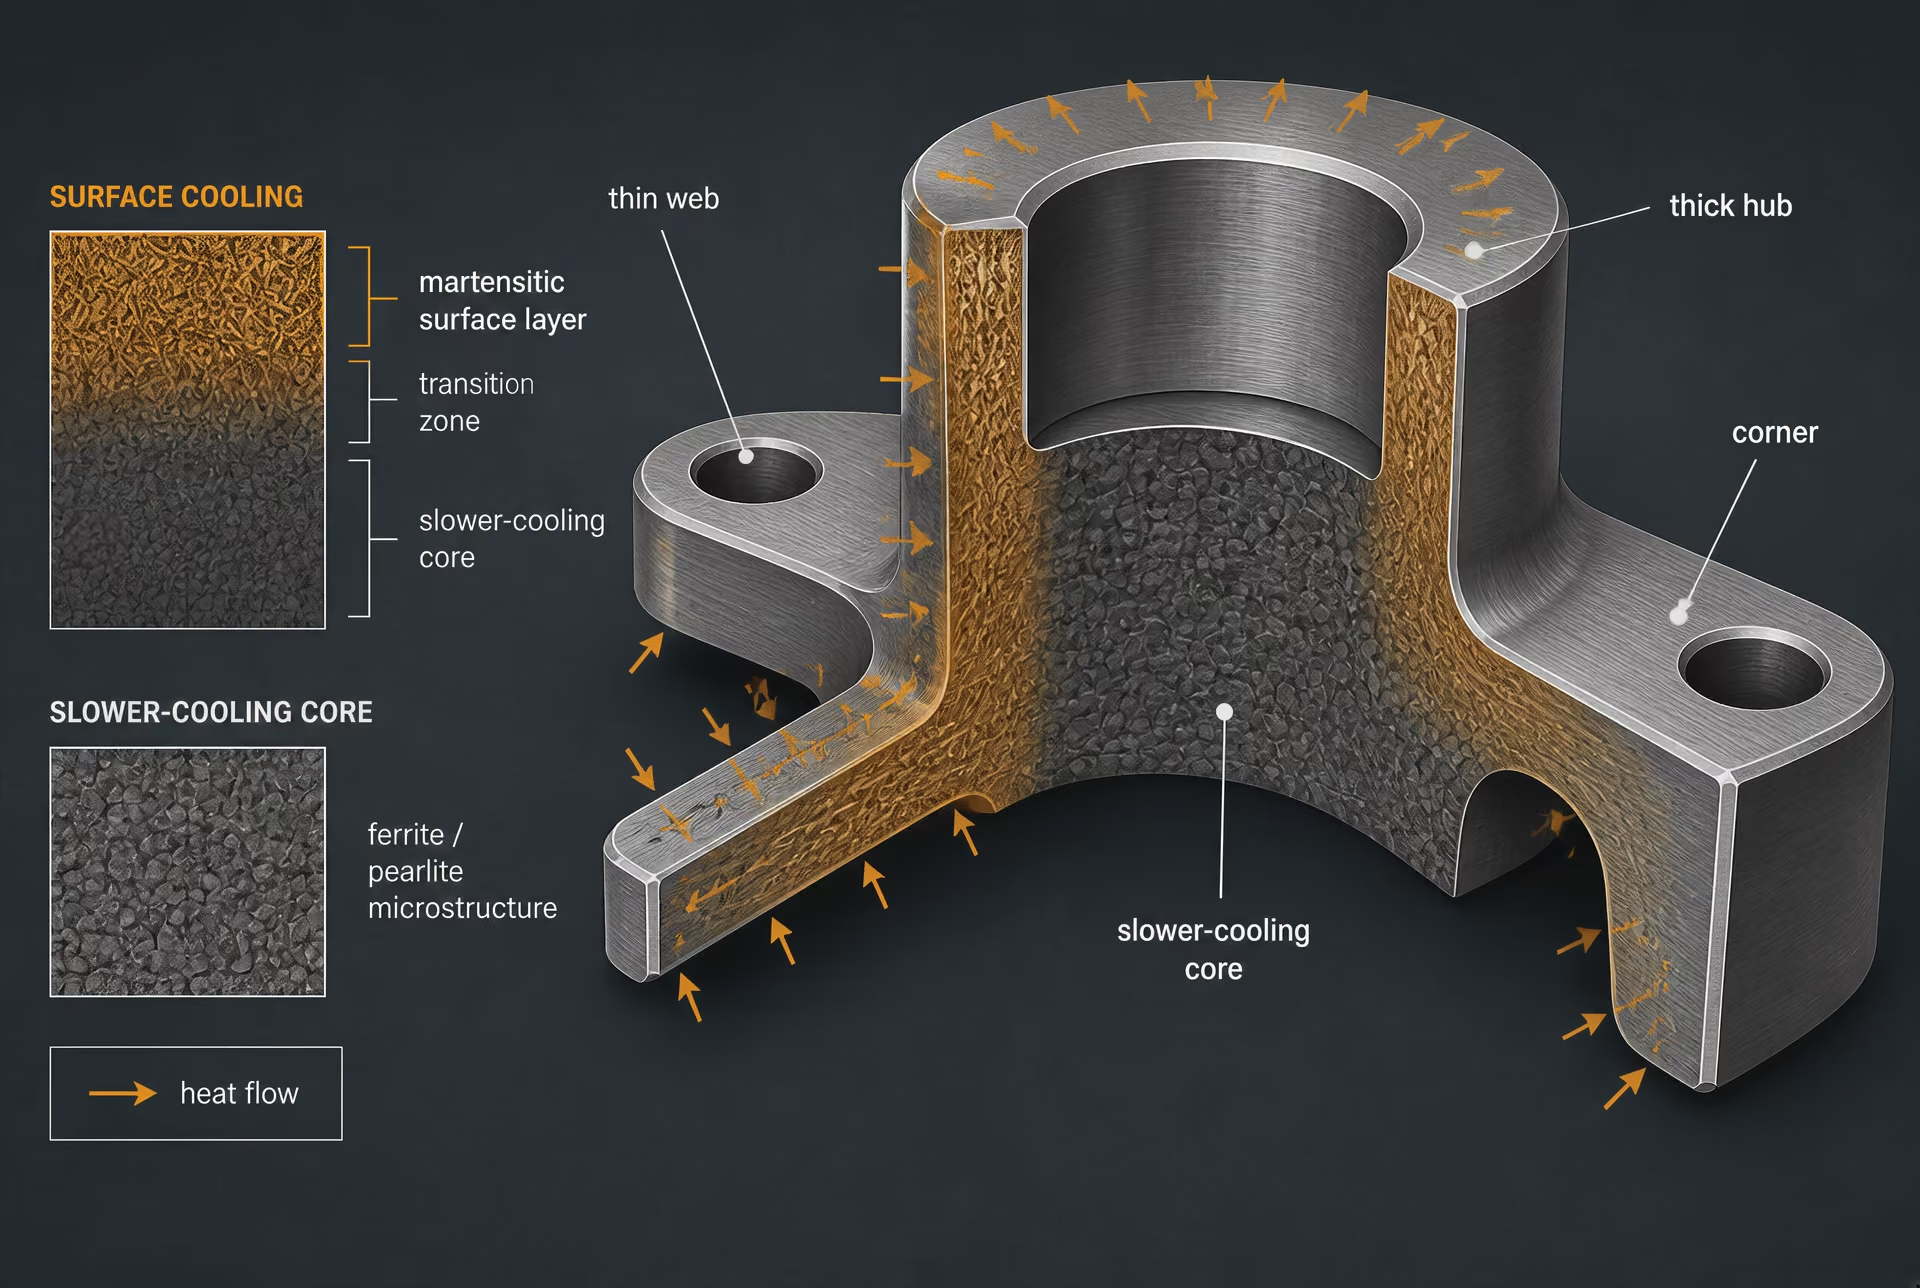
A Jominy curve describes a steel’s response to one controlled cooling arrangement. It does not predict the hardness at every point in a finished component without additional analysis. The distinction matters because a standard test piece is small, simple, and cooled in a prescribed way, whereas a component may contain thin edges, thick hubs, holes, corners, changing surface conditions, and regions that cool at very different rates.
ASTM A255-20 defines hardenability as the depth to which steel hardens when quenched. Its quantitative end-quench procedure uses a cylindrical specimen 1 inch in diameter. ISO 642:2024 specifies a steel end-quench test piece 25 mm in diameter and at least 100 mm long. These dimensions and the prescribed test conditions create a repeatable comparison between heats, grades, or processing conditions; they do not make the specimen a scale model of a machine part.
In the procedure described by the University of Illinois Materials Technology and Innovation Laboratory, the specimen is heated to its austenitizing temperature and one end is quenched with a water jet. Hardness is then measured at increasing distances from the quenched end. The resulting hardness-versus-distance plot is the Jominy curve. As the University of Cambridge explains, the water-cooled end and the air-cooled remainder produce a continuous range of cooling rates along the bar. Each position therefore represents a different thermal response within the same specimen.
That response is useful, but it must be translated carefully.

Section thickness and thermal gradients
A component’s section thickness controls how much heat must leave its interior before transformation begins. A thin wall has a short path to the surface and can cool rapidly through much of its section. A thick boss, shaft, flange, or gear blank retains heat at its center; the surface may pass through the martensitic transformation range while the core cools slowly enough for bainite, pearlite, or ferrite to form, depending on composition and the actual thermal cycle.
The Jominy bar also has a thermal gradient, but it is a deliberately arranged longitudinal gradient. The quenched end receives the strongest direct cooling, while positions farther away cool progressively more slowly. A real component usually has gradients in more than one direction. Heat can flow radially from a core to a surface, axially toward an end, and through neighboring features. A corner may lose heat through several faces. A bore can alter the cooling path from the inside, while a contact with a fixture can locally restrict heat flow or provide another heat sink.
This difference makes section size more than a simple dimensional correction. Two locations with the same distance from an external surface can experience different cooling histories if one lies near a corner and the other lies at the center of a thick section. The center of a cylindrical bar, for example, is not equivalent to a point near the surface merely because both are in the same steel grade. Nor is the center of a large component automatically represented by the far end of a Jominy curve. The component’s geometry determines the heat-flow field, and the quench determines how quickly that field loses heat.
Composition and austenite grain size remain important starting variables. ASM International identifies both as primary influences on hardenability. Austenitizing temperature, holding time, prior microstructure, and grain growth can also alter the transformation response presented to the quench. Consequently, a Jominy result from one heat-treatment condition should not be separated from that condition when it is applied to a component.
Surface condition adds another complication. Scale, decarburization, machining marks, coatings, and residues can change contact between the steel and the quenchant. A decarburized surface may show lower measured hardness even when the underlying steel has a substantially different response. A rough or contaminated surface can retain vapor or reduce liquid contact during quenching. The hardness measured after machining away such a layer may therefore differ from the hardness measured directly on the as-quenched surface.
Quench medium and quench severity
Water in the Jominy apparatus is not a generic symbol for “fast quenching.” The jet’s flow, temperature, pressure, alignment, and exposed area are controlled because they affect heat transfer at the quenched end. The specimen’s opposite portions cool in air. A production component may instead be immersed in agitated water, polymer solution, oil, molten salt, or another medium, each producing a different cooling path.
Quench severity describes the ability of a quenching system to extract heat relative to a reference condition. It depends on the medium, but also on agitation, fluid temperature, circulation, part orientation, vapor-film behavior, and the ratio of exposed surface to volume. A stationary liquid around a large part may remove heat much less effectively than a moving liquid around a small part. Even in one tank, surfaces facing a strong flow can cool differently from shielded surfaces.
Agitation is especially important during the early stage of quenching, when a vapor blanket may form around hot steel. Movement can break up that blanket and renew contact with cooler liquid. If the part is transferred slowly from the furnace, however, it begins cooling before the intended quench starts. Transfer time is therefore part of the thermal history, not merely a handling detail. A delay of unknown duration makes a nominally identical quench difficult to compare with the Jominy condition.
The medium can also create local differences within one part. A vertical shaft may drain fluid differently from a horizontal one. A blind hole may trap vapor. Narrow channels can restrict flow, while large flat faces can generate persistent vapor films. These effects may cause hardness scatter that a single Jominy curve cannot reveal.
For this reason, a steel with a particular Jominy hardness at a selected distance cannot be assigned a guaranteed component hardness by distance alone. The curve indicates how the material responds to a known range of cooling conditions. It does not specify the cooling rate at a component location, nor does it establish that the location will form the same microstructure as the corresponding Jominy position.
Relating laboratory response to component locations
The practical question is not “What hardness does this grade have?” It is “What cooling history will this location receive, and what hardness and microstructure does the steel produce under that history?” A Jominy curve supplies part of the answer. A component assessment must supply the rest.
Engineers commonly estimate local cooling conditions from section geometry and quench practice, then compare those conditions with standardized hardenability data or use a section-size method such as the Grossman approach. The comparison must preserve the distinction between material response and process result. Jominy data describe the former; the calculated or measured cooling path connects it to the latter.
Component locations requiring separate attention
- Thick hubs and shafts May retain heat at the center and develop softer transformation products.
- Thin webs May cool rapidly enough to harden through the section.
- Corners and fillets Can lose heat through multiple surfaces and cool differently from adjacent material.
- Blind holes and recesses May restrict fluid movement and reduce local quench severity.
Locations should be considered individually. The surface of a thick shaft may cool rapidly enough to become mostly martensitic, while its center develops a mixed structure and lower hardness. A thin web may harden through its section, yet a nearby hub may not. A fillet can cool faster than the adjacent body, while a threaded recess or blind hole can cool more slowly because fluid movement is restricted. Hardness traverses, metallographic samples, thermocouples, or validated heat-transfer calculations may be needed to check these predictions.
The relevant location is also defined by the specification. A drawing may require hardness at a surface, at a stated depth, or at the center of a reference section. Those are different acceptance points. Measuring only the easiest exposed face can miss a soft core or a locally over-hard edge.
The Jominy curve is therefore a comparative material-response tool, not a guarantee that every location in a part reaches a particular hardness. ASTM A255-20 and ISO 642:2024 make the test repeatable by controlling specimen geometry and cooling conditions. Applying its result responsibly requires matching those data to the component’s section thickness, geometry, surface state, transfer time, quench medium, agitation, and local thermal history. A hardness number becomes meaningful only when the cooling path that produced it is also understood.
Common Misinterpretations and Reporting Errors
Calling hardenability the same as hardness
Hardness and hardenability are related, but they are not the same property. Hardness is the resistance of a material to indentation, commonly reported from a Rockwell, Brinell, or Vickers measurement. Hardenability describes how far, and how consistently, steel can develop martensitic or otherwise hard transformed structures during a specified quench. ASTM A255-20 defines hardenability as “the depth to which steel will harden when quenched” (ASTM International, 2020). The definition concerns the response through the section, not one hardness number taken from one location.
This distinction matters because carbon content strongly affects the hardness that martensite can reach, while alloying and austenite grain size strongly affect the cooling severity required to form that martensite. ASM International identifies steel composition and austenite grain size as primary influences on hardenability (ASM International, 1990). A high-carbon steel may show a very high hardness close to the quenched end yet lose hardness rapidly a short distance away. A lower-carbon alloy steel may show a lower maximum hardness but retain a useful hardness farther from the quenched surface. Calling the first steel “more hardenable” solely because its end hardness is higher confuses hardness potential with hardening depth.
The same error appears when a report gives only a maximum value. “Jominy hardness: 62 HRC” does not describe a hardenability result unless the distance from the quenched end is stated. Even then, the number is only one point on a response curve. The Jominy test measures hardness at increasing distances from the quenched end, and the resulting hardness-versus-distance plot is the hardenability curve, as described by the Materials Education Foundation (2024). The curve shows how the steel responds as the local cooling rate becomes less severe.
Carbon content must therefore be considered when interpreting a low value farther from the end. A decline from 60 HRC near the end to 35 HRC at a specified distance does not carry the same meaning for a medium-carbon steel as it does for a low-carbon steel. The interpretation also depends on whether the measured region contains martensite, bainite, pearlite, or a mixture, and on the hardness scale used. A single hardness value cannot identify the transformed microstructure or establish the depth at which a required hardness is maintained.
Assuming the quenched end represents the whole steel
The quenched end is the most rapidly cooled part of a Jominy specimen, not a representative average of the entire bar. In the standard arrangement, one end is exposed to a water jet while the remainder cools in air. This creates a continuous range of cooling rates along the specimen, from severe cooling at the end to progressively slower cooling with increasing distance. The University of Cambridge describes this gradient as the physical basis of the test (2012), while the University of Illinois procedure specifies heating a cylindrical specimen to its austenitizing temperature, quenching one end with a water jet, and measuring hardness at increasing distances (2024).
That arrangement makes the end useful, but limited. It provides a reference point for the highest cooling severity in the test and commonly produces the highest hardness along the prepared measurement track. It does not prove that a large production section will harden to the same depth. Section size, part geometry, surface condition, furnace practice, transfer time, quenchant agitation, and actual cooling history can all differ from the Jominy setup. A Jominy curve is a controlled material response, not a direct hardness map for every possible component.
Nor does a high end hardness prove deep hardenability. The end may cool rapidly enough to form a hard structure even in a steel whose interior would transform to softer products during slower cooling. Evidence for deep hardenability comes from the shape and persistence of the curve: hardness that remains at a specified distance as cooling becomes less severe. The relevant distance must be identified, and the required hardness criterion must be defined.
The opposite mistake is also common. A low hardness farther from the end is not automatically evidence of poor steel quality or a failed test. It may reflect the steel’s carbon level, austenite grain size, alloy content, austenitizing treatment, or the formation of a softer mixture at that location. ASM’s treatment of carbon and low-alloy steels defines hardenability as governing the depth and distribution of hardness produced by quenching (ASM International, 1990). “Distribution” is the important word: the change along the specimen is the result, not an unwanted complication to be ignored.
A Jominy curve can support component estimates only when combined with an appropriate cooling model, section-size method, or validated correlation. Limited evidence
A Jominy curve can establish comparative hardening response under the test procedure. It cannot, by itself, establish the final hardness profile of a part quenched in oil, polymer, gas, or another medium. Converting a Jominy result into an estimated component hardness requires a stated method and assumptions about geometry and cooling.
Reporting a result without the standard and test conditions
A Jominy result without its test standard and conditions is incomplete. The designation “Jominy hardness at 10 mm” lacks enough information for a reliable comparison unless the report also identifies specimen geometry, austenitizing treatment, quenching arrangement, hardness method, and distance convention.
ASTM A255-20 specifies the end-quench test with a 1-inch-diameter cylindrical specimen (ASTM International, 2020). ISO 642:2024 specifies a steel end-quench test piece 25 mm in diameter and at least 100 mm long (International Organization for Standardization, 2024). Those dimensions are close in diameter but are not interchangeable merely because both procedures are called Jominy tests. A report should name the governing standard, such as ASTM A255-20 or ISO 642:2024, rather than use “standard Jominy” as if only one procedure existed.
The heat treatment must be reported as well. This includes the steel designation, specimen condition, austenitizing temperature, holding time, furnace atmosphere where relevant, and transfer time to the quench. The water-jet arrangement, water temperature or specified range, nozzle condition, and quenching duration may affect the cooling history. If the test departs from the named standard, that departure belongs in the result.
Hardness data require equal precision. State whether measurements are HRC, HRB, HBW, HV, or another scale; identify the instrument or method where required; and record the spacing and preparation of the hardness track. “10 mm from the end” should mean distance measured from the quenched face along the specified surface, not an unspecified position on the specimen. If a standard defines a particular grinding allowance, flat, or measurement line, that detail should be retained.
Finally, report the complete curve or the individual distance–hardness pairs, not only the highest reading. Include the specimen identification and steel chemistry or grade designation when available. A defensible statement might read: “Jominy end-quench hardenability tested to ASTM A255-20 on a 1-inch-diameter specimen, austenitized at the specified temperature, water-quenched at one end, and measured in HRC at the standard distances.” Without those conditions, the number is a hardness observation detached from the cooling history that gives hardenability its meaning.
How to Specify and Document a Hardenability Result
A hardenability result is only meaningful when the steel, specimen, thermal cycle, quench, measurement method, and reporting format are identified together. A hardness number without that information describes one measured condition; it does not establish how deeply or uniformly the steel can harden. ASTM A255-20 defines hardenability as the depth to which steel hardens when quenched, while the ASM chapter on carbon and low-alloy steels describes it as the property governing the depth and distribution of hardness produced by quenching. The record should therefore preserve the complete test history, not just the highest value obtained near the quenched end.
Required material and heat-treatment identity
Documenting a result
- Identify the material Record grade, governing standard, heat or cast number, product form, and specimen identity.
- Record prior condition State forging, rolling, normalizing, annealing, or other prior processing.
- Record austenitizing Capture furnace method, target temperature, actual range, soak time, and atmosphere.
- Record the quench Document specimen dimensions, water-jet arrangement, transfer time, and any deviation.
- Record hardness data List every distance–hardness pair with units, scale, instrument, and preparation details.
- State acceptance Separate measured results from the applicable specification or drawing requirement.
Begin with the material designation exactly as it appears on the purchase document, material certificate, or governing specification. Record the grade, standard, heat or cast number, product form, and specimen identification. For example, “AISI 4140” alone may be insufficient if the controlling requirement is written as ASTM A193/A193M Grade B7, EN 10083-3:2006 42CrMo4, or another specified designation. Do not replace the formal designation with a shop abbreviation. If the material has been normalized, annealed, forged, rolled, or otherwise processed before testing, state that condition and identify any relevant prior heat treatment.
The heat number is particularly important because hardenability depends on composition and prior metallurgical history. ASM International identifies steel composition and austenite grain size as primary factors affecting hardenability. The report should therefore link the Jominy specimen to the chemical analysis or certified heat record where available, including carbon and alloying elements that the governing specification controls. If grain size was measured, record the method and result; if it was not measured, do not imply that the austenite grain structure is known.
Identify the specimen’s orientation and location within the product when those details affect interpretation. A bar center, surface sample, forged section, and rolled section may not represent the same thermal or deformation history. Record whether the specimen was machined directly from the supplied product or produced separately from the same heat.
The austenitizing record must state the furnace or heating method, target temperature, actual temperature range, soak time, and basis for the soak time, such as time after the specimen reached temperature. Include the furnace atmosphere or protection used, because oxidation, decarburization, and carburization can alter the hardness profile. Record whether the specimen was loaded into a preheated furnace or heated with the furnace, and note any visible scale or surface damage. These details matter at the quenched end, where a small decarburized layer can distort the first hardness readings.
Standard, geometry, and quenching details
Name the test standard and edition on every report. ASTM A255-20 specifies the quantitative end-quench, or Jominy, test using a 1-inch-diameter cylindrical specimen. ISO 642:2024 specifies a steel end-quench test piece 25 mm in diameter and at least 100 mm long. Those designations are close in practical size but are not interchangeable instructions. A report should state whether the work followed ASTM A255-20, ISO 642:2024, or a customer or national procedure derived from one of them.
Record the specimen dimensions as actually measured, including diameter, length, end preparation, chamfers, and the condition of the quenched face. If dimensions differ from the named standard, document the deviation before presenting the result as standard-compliant. The report should also identify the specimen number and, where several pieces were tested, distinguish each curve rather than silently averaging them.
The quenching arrangement must be described sufficiently to reconstruct the cooling history. The University of Illinois procedure heats a cylindrical specimen to the austenitizing temperature and quenches one end with a water jet. The University of Cambridge explains why the arrangement produces a useful profile: the quenched end cools rapidly while the remainder cools in air, creating a continuous range of cooling rates along the bar. State which end was quenched, how the specimen was supported, and the water source and condition. Record jet temperature, nozzle or orifice information, water pressure or flow where specified, jet alignment, and the distance between the nozzle and specimen end. Also record the time between furnace removal and the start of the water quench.
Do not describe the result merely as “water quenched.” Water temperature, flow stability, jet shape, specimen position, and transfer delay can change the cooling response. The report should identify whether the arrangement was checked before testing and whether any interruption, splashing, misalignment, or abnormal cooling event occurred. A deviation is not automatically a failed test, but it must be visible to anyone assessing the result.
The thermal cycle and quench record should be connected to the material identity through a unique test number. That link prevents a curve from being separated from its heat-treatment conditions when results are copied into a spreadsheet or certificate.
Hardness data, curve presentation, and traceability
After quenching, identify the hardness method, scale, instrument, indenter, load, calibration status, and test surface preparation. The report must state whether readings were taken in Rockwell C, Rockwell B, Vickers, or another permitted scale; “hardness” by itself is incomplete. Record the instrument identification and verification status, especially when results are used for acceptance.
The Jominy method measures hardness at increasing distances from the quenched end. The Materials Education Foundation describes this distance-dependent response as the basis for determining steel hardenability. State the reference point for distance zero, the measurement-side preparation, and every measurement location. Distances should include units and should be reported as measured, not inferred from a generic template. If the surface was ground or machined before testing, record the amount removed and the direction of preparation.
Present the raw readings in a table before any smoothed or fitted curve. A useful table includes specimen number, distance from quenched end, hardness value, hardness scale, replicate readings, mean where calculated, and remarks. If opposing sides or multiple tracks were measured, identify each track. Do not conceal scatter by reporting only an average. A curve should plot hardness on the vertical axis and distance from the quenched end on the horizontal axis, with units, scale, specimen identity, test standard, and hardness scale in the caption. If interpolation, curve fitting, or conversion between hardness scales was used, state the method and retain the original readings.
The curve shows the hardness response produced by the documented end-quench history. It does not by itself establish hardness in a particular production component, guarantee a microstructure, or predict performance after a different quench, section size, or tempering treatment. Composition, austenite grain size, specimen geometry, transfer time, and quench conditions all affect interpretation. A single hardness value, even one taken at the quenched end, cannot replace the distance-versus-hardness record.
Finally, identify the acceptance criterion separately from the measured result. ASTM A255-20 and ISO 642:2024 provide test frameworks; the governing material specification, drawing, purchase requirement, or customer document determines whether a curve or tabulated value passes. The report must quote that requirement and its revision when applicable. If no acceptance limit is specified, state that the result is descriptive and do not invent a minimum hardness, maximum distance, grade ranking, or pass/fail conclusion. Retain the original instrument file, calibration record, heat-treatment log, specimen photographs when relevant, raw table, plotted curve, operator identity, test date, and deviations under the same traceable test number.
Limits of the Jominy Method
The Jominy end-quench test is a controlled comparison, not a miniature version of every quench operation. ASTM A255-20 defines hardenability as “the depth to which steel hardens when quenched” and specifies a 1-inch-diameter cylindrical specimen for the quantitative end-quench test (ASTM International, 2020). ISO 642:2024 specifies a test piece 25 mm in diameter and at least 100 mm long (International Organization for Standardization, 2024). Those dimensions, the austenitizing treatment, the water-jet arrangement, and the hardness measurement procedure are part of the result. Change them, and the response may change.
A Jominy curve therefore answers a defined question: how does hardness vary with distance from one end of a standard specimen after a specified thermal history? It does not provide a single, geometry-free number for “how hard” a steel is. Nor does it guarantee that a production part will develop the same hardness profile.
What one-dimensional cooling can represent
The test begins by heating the cylindrical specimen to its specified austenitizing temperature. One end is then quenched by a water jet while the rest of the bar cools in air. The University of Illinois describes this sequence as the basis of the test (University of Illinois Materials Technology and Innovation Laboratory, 2024); the University of Cambridge explains that it creates a continuous range of cooling rates along the bar (University of Cambridge, 2012). Near the quenched end, heat is removed quickly. Farther away, heat must conduct toward the cooled end and escape from the exposed surface, so the cooling rate decreases progressively.
That arrangement is useful because a single specimen samples many cooling severities. The resulting hardness-versus-distance curve can show whether a grade retains martensitic hardness farther from the quenched end, where transformation products such as bainite or ferrite and pearlite become more likely. It also shows the distribution of response rather than one hardness reading. This is why a low hardness at a distant position cannot be interpreted as proof that the steel was “soft” before quenching; it may indicate that the local cooling rate was insufficient to suppress diffusional transformation.
The one-dimensional thermal field is an approximation. A real component cools through several surfaces, may contain corners, holes, shoulders, keyways, or contact interfaces, and may experience agitation that varies with orientation. Its center can remain hot while its surface is already transforming. Heat flow may be radial, axial, or strongly three-dimensional. A Jominy bar has none of those component-specific boundary conditions.
The test also does not reproduce the exact cooling history of an oil, polymer, brine, gas, or interrupted quench. A water jet directed at one end imposes a particular boundary condition; it is not a universal substitute for a tank, spray, pressurized gas, or staged quench. The curve can compare heats, compositions, and austenite grain conditions when the procedure is held constant, but converting distance along the bar directly into a component location requires a thermal analysis or validated correlation.
Composition and austenite grain size matter strongly. ASM identifies both as primary influences on hardenability (ASM International, 1990). Consequently, a Jominy result is also sensitive to the specimen’s prior processing, grain growth during austenitizing, and the steel’s actual chemistry. A grade designation alone does not erase those variables.
Sensitivity to preparation and measurement
The Jominy method compresses many metallurgical decisions into a test that looks simple. The specimen must have the specified dimensions and surface condition, be heated uniformly, reach the intended austenitic state, and transfer promptly to the quench fixture. Delays, decarburization, oxidation, incorrect furnace temperature, or a changed holding time can alter the transformation response before the water jet even starts.
Surface preparation after quenching is equally important. Hardness readings are normally taken at increasing distances from the quenched end on a prepared flat or machined track. If grinding overheats the surface, if scale remains, or if the indentation is placed too close to an earlier impression or an edge, the measured value may not represent the underlying steel. The reading method also matters: Rockwell, Vickers, or another scale cannot be exchanged casually without regard to the standard’s requirements and the applicable conversion limits.
Small errors become especially visible near a steep part of the curve. A slight distance error can associate a hardness value with the wrong cooling position, while scatter in indentation measurements can make a nearly flat region appear to slope. Reporting only the highest hardness, or only the value at one distance, discards the distribution that makes the method useful. The Materials Education Foundation describes the test as measuring hardness at increasing distances from the quenched end to determine hardenability (Materials Education Foundation, 2024). The plural readings are not optional decoration; they are the evidence.
A curve also needs context. The report should identify the standard used, specimen dimensions, austenitizing conditions, quench medium and arrangement, hardness scale, measurement positions, and any departures from the procedure. Comparing a curve produced under ASTM A255-20 with one produced under ISO 642:2024 may be reasonable only after confirming that the relevant conditions and reporting conventions are equivalent. “Jominy value” without that information is incomplete.
When another evaluation method is needed
Grossman analysis is appropriate when the engineering question concerns the interaction between steel hardenability and quench severity. It combines a steel’s intrinsic response with the cooling severity of a specified quenching environment, often expressed through an factor, to estimate hardness or transformed depth in a particular geometry. A Jominy curve describes response along its own specimen; Grossman analysis adds a model of the quench and geometry. It does not turn the Jominy result into a direct measurement of a production part.
Air-hardenability testing addresses a different problem. For steels intended to harden in still or forced air, an air-cooling test can show the hardness and microstructure produced by that cooling path. Its output is not interchangeable with a water end-quench curve, because the specimen experiences a different thermal history and surface heat-transfer condition. The choice should follow the actual process.
Process trials become necessary when furnace loading, transfer time, agitation, masking, fixtures, distortion control, or quench interruption can affect the result. A trial using representative parts can reveal effects that a standard bar cannot. Even then, hardness should be measured at locations tied to the design requirement, and metallographic examination may be needed to distinguish martensite from bainite, ferrite, pearlite, or tempered structures.
For critical components, qualification should be component-specific. A crankshaft, gear, shaft, or thick plate may require thermocouples, hardness traverses, microstructure checks, residual-stress or distortion measurements, and repeated production-representative quenches. The Jominy test remains valuable for comparing steels under a common procedure, but it is evidence about a standardized response—not a waiver of validation.
References
- [1] Standard Test Methods for Determining Hardenability of Steel. ASTM International standard, 2020. https://store.astm.org/a0255-20.html