




What Steel Grain Size Means

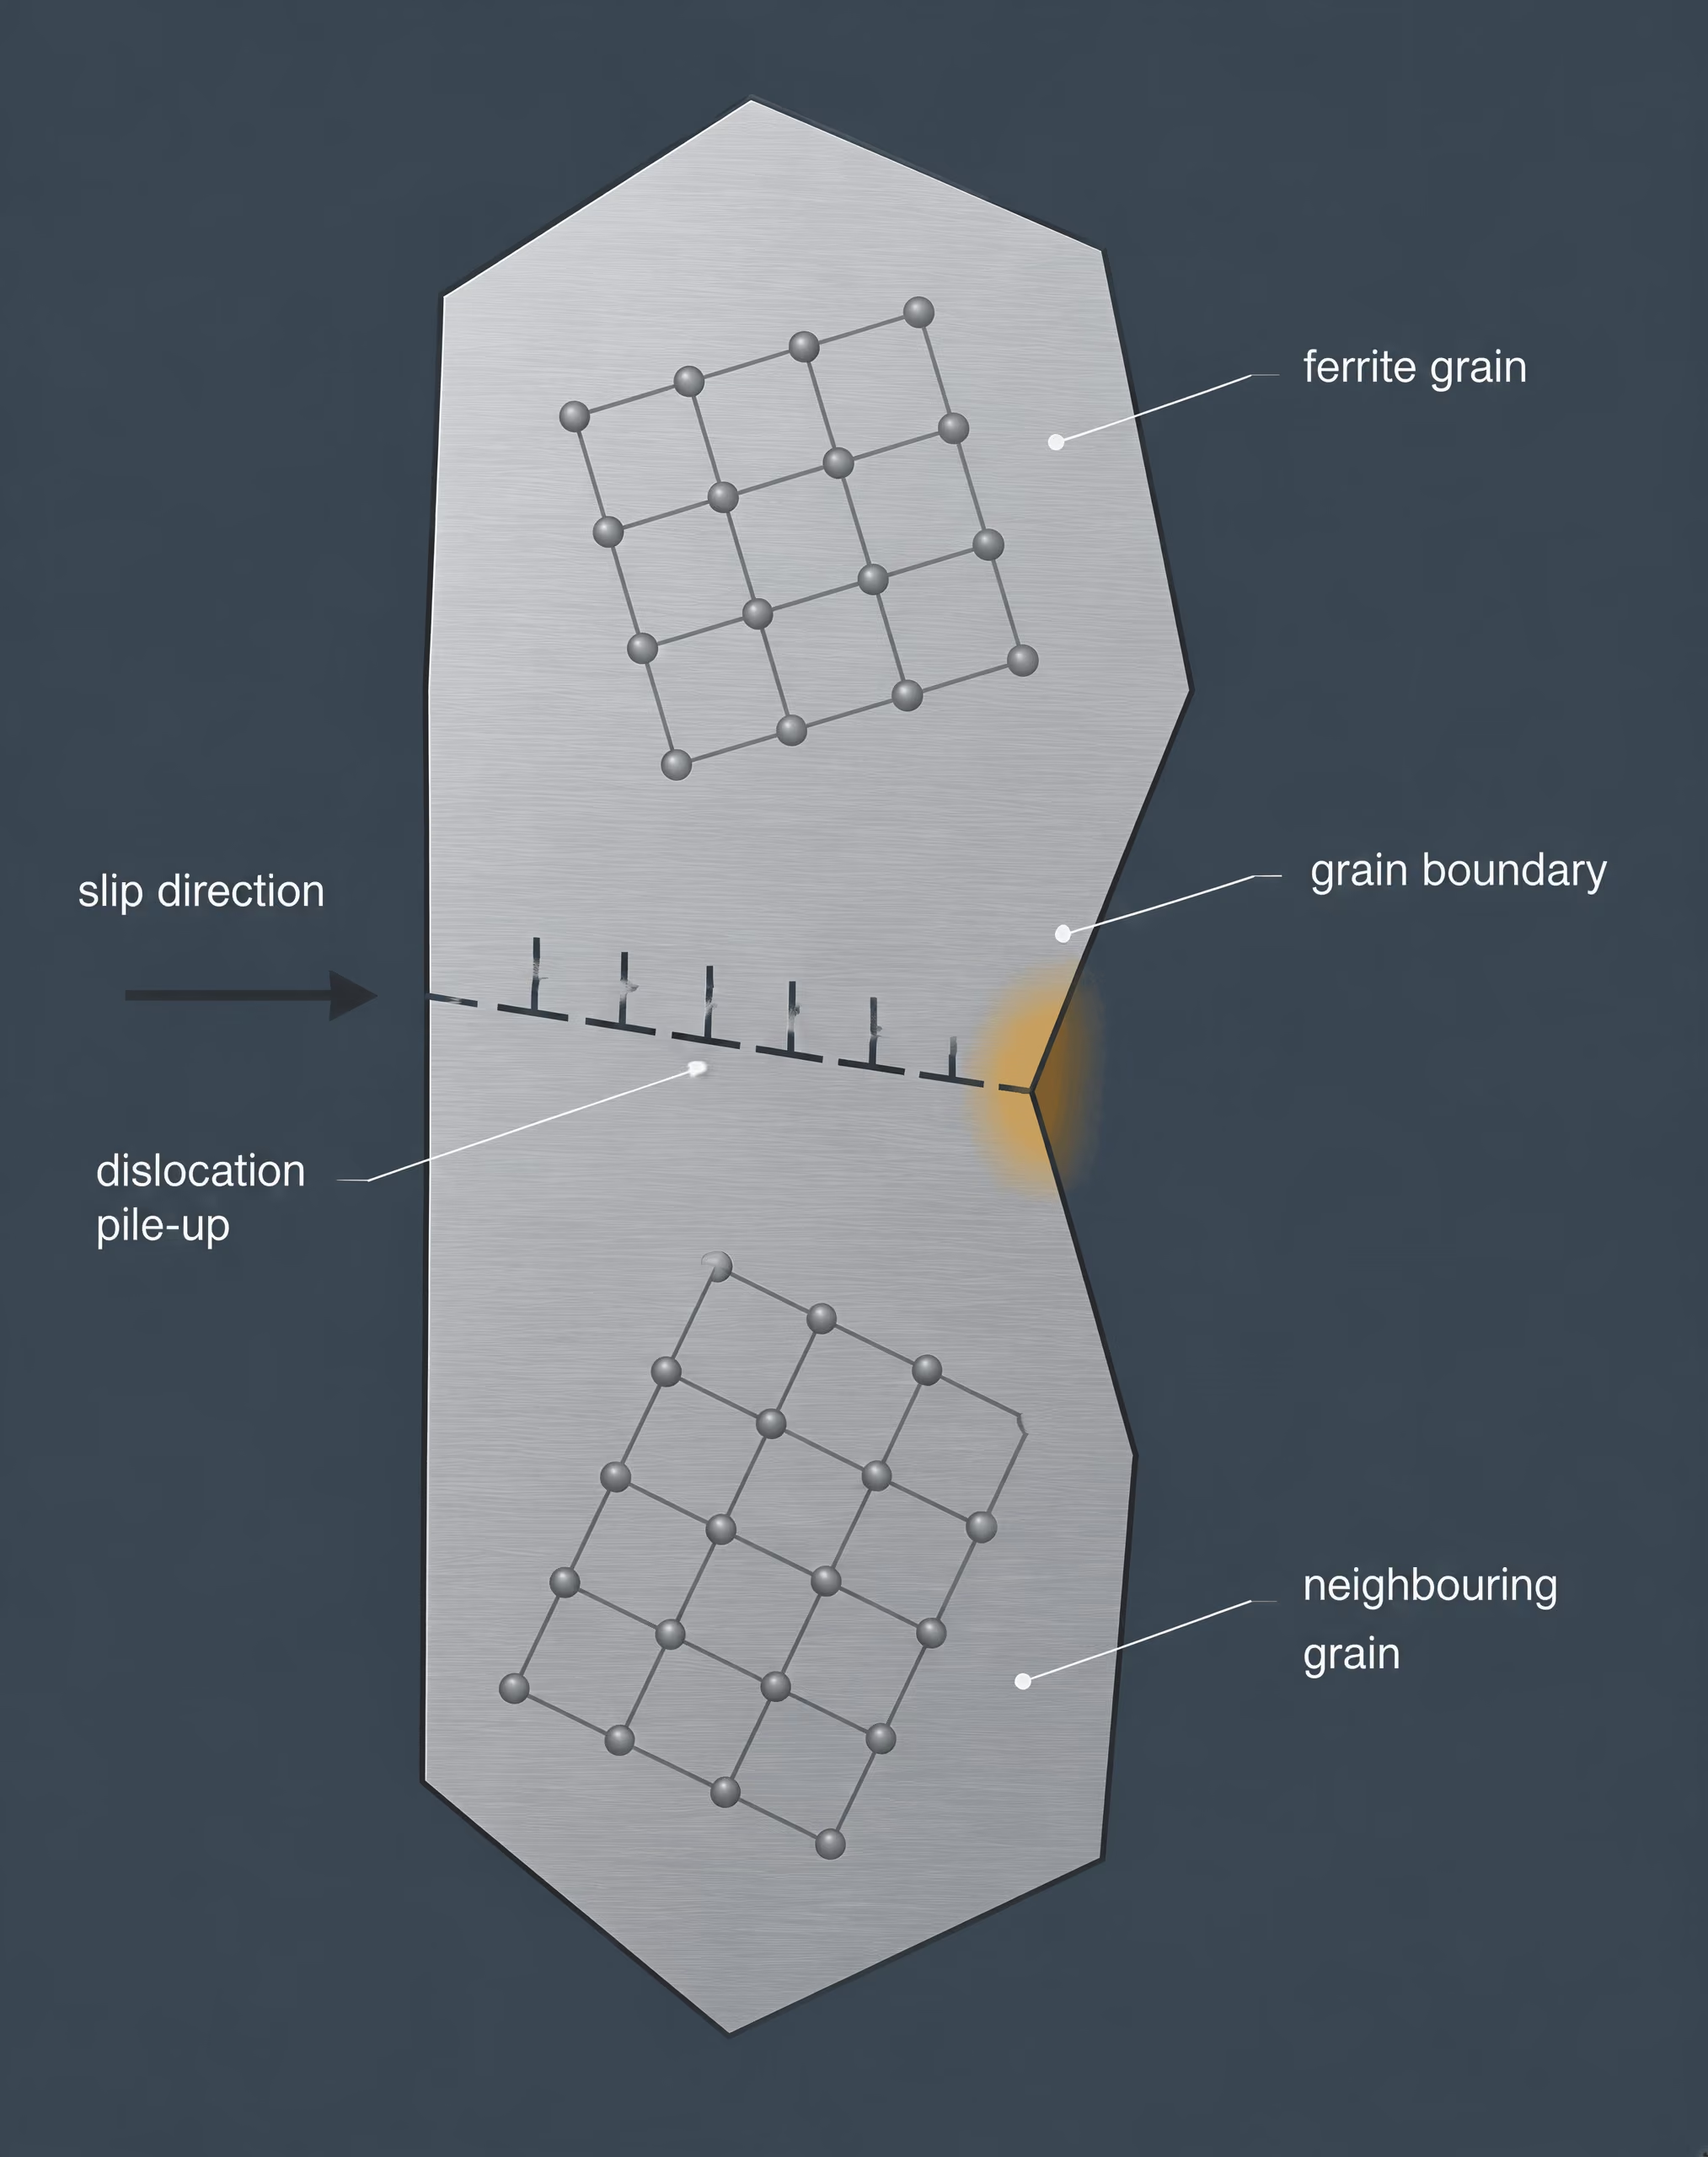
Grains, grain boundaries, and crystallographic orientation
Grain boundary The transition region between adjoining crystals with different orientations, where atomic arrangement, chemistry, energy, and resistance to dislocation motion may differ.
A steel grain is a region within which the crystal lattice has a common crystallographic orientation. The atoms remain arranged according to the structure of the phase—body-centred cubic ferrite, face-centred cubic austenite, or another phase—but the lattice orientation changes from one grain to the next. A grain boundary is the interface between regions with different orientations. It is not simply a visible line; it is a transition zone with different atomic arrangement, energy, chemistry, and resistance to dislocation motion.
This distinction matters because plastic deformation is crystallographically directional. Dislocations move most readily on particular slip systems, and neighbouring grains generally do not present those systems in the same direction. A boundary therefore interrupts slip, forces dislocations to pile up or change direction, and can raise the stress required for further yielding. The classical Hall–Petch relationship expresses this contribution approximately as
where is yield stress, represents other strengthening contributions, is a material-dependent constant, and is a characteristic grain dimension. The University of Cambridge’s 2005 treatment describes the same dependence using mean linear intercept rather than a visually estimated diameter.
The relationship is useful, but it is not a law that makes every smaller grain structure stronger without limit. At very small dimensions, dislocation storage, grain-boundary-mediated deformation, solute segregation, phase transformation, and texture can alter or replace the classical mechanism. A material containing 1 micrometre grains is not described adequately by saying only that it is “fine grained.”
Which structural unit is being measured?
- Ferrite grain size
- The size of ferrite grains, often relevant to yielding in ferritic-pearlitic steels.
- Austenite grain size
- The size of grains present while the steel is in the austenitic phase.
- Prior-austenite grain size
- The inferred size of austenite grains reconstructed after transformation.
- Packet or block size
- A substructure scale in martensitic or bainitic steel that may control fracture more directly than the prior-austenite grain.
- Pearlite colony size
- The size of ferrite–cementite colonies, which may influence fracture and deformation.
Ferrite grain size is often the quantity used in conventional ferritic-pearlitic steels because ferrite carries much of the plastic strain and its boundaries strongly affect yielding. Austenite grain size refers to the grains present while steel is in the austenitic phase, usually at an elevated temperature. If those grains transform during cooling, they may no longer be directly visible. Metallographers then reconstruct or infer the prior-austenite grain size from features left by the transformation. Prior-austenite boundaries can influence the arrangement of bainite, martensite, ferrite, and pearlite, even though the original austenite itself has disappeared.
These are different measurements. A ferrite grain diameter cannot be substituted for a prior-austenite grain diameter, and neither necessarily equals the size of the unit controlling fracture. In martensitic steel, for example, a prior-austenite grain contains packets, blocks, and laths with different orientations. The effective cleavage or crack-arrest unit may be a block or packet rather than the whole prior-austenite grain. In bainite, packet and subunit dimensions may govern crack propagation. In pearlitic steel, ferrite–cementite colony size and interlamellar spacing may matter as much as ferrite grain size.
Average size versus size distribution and morphology
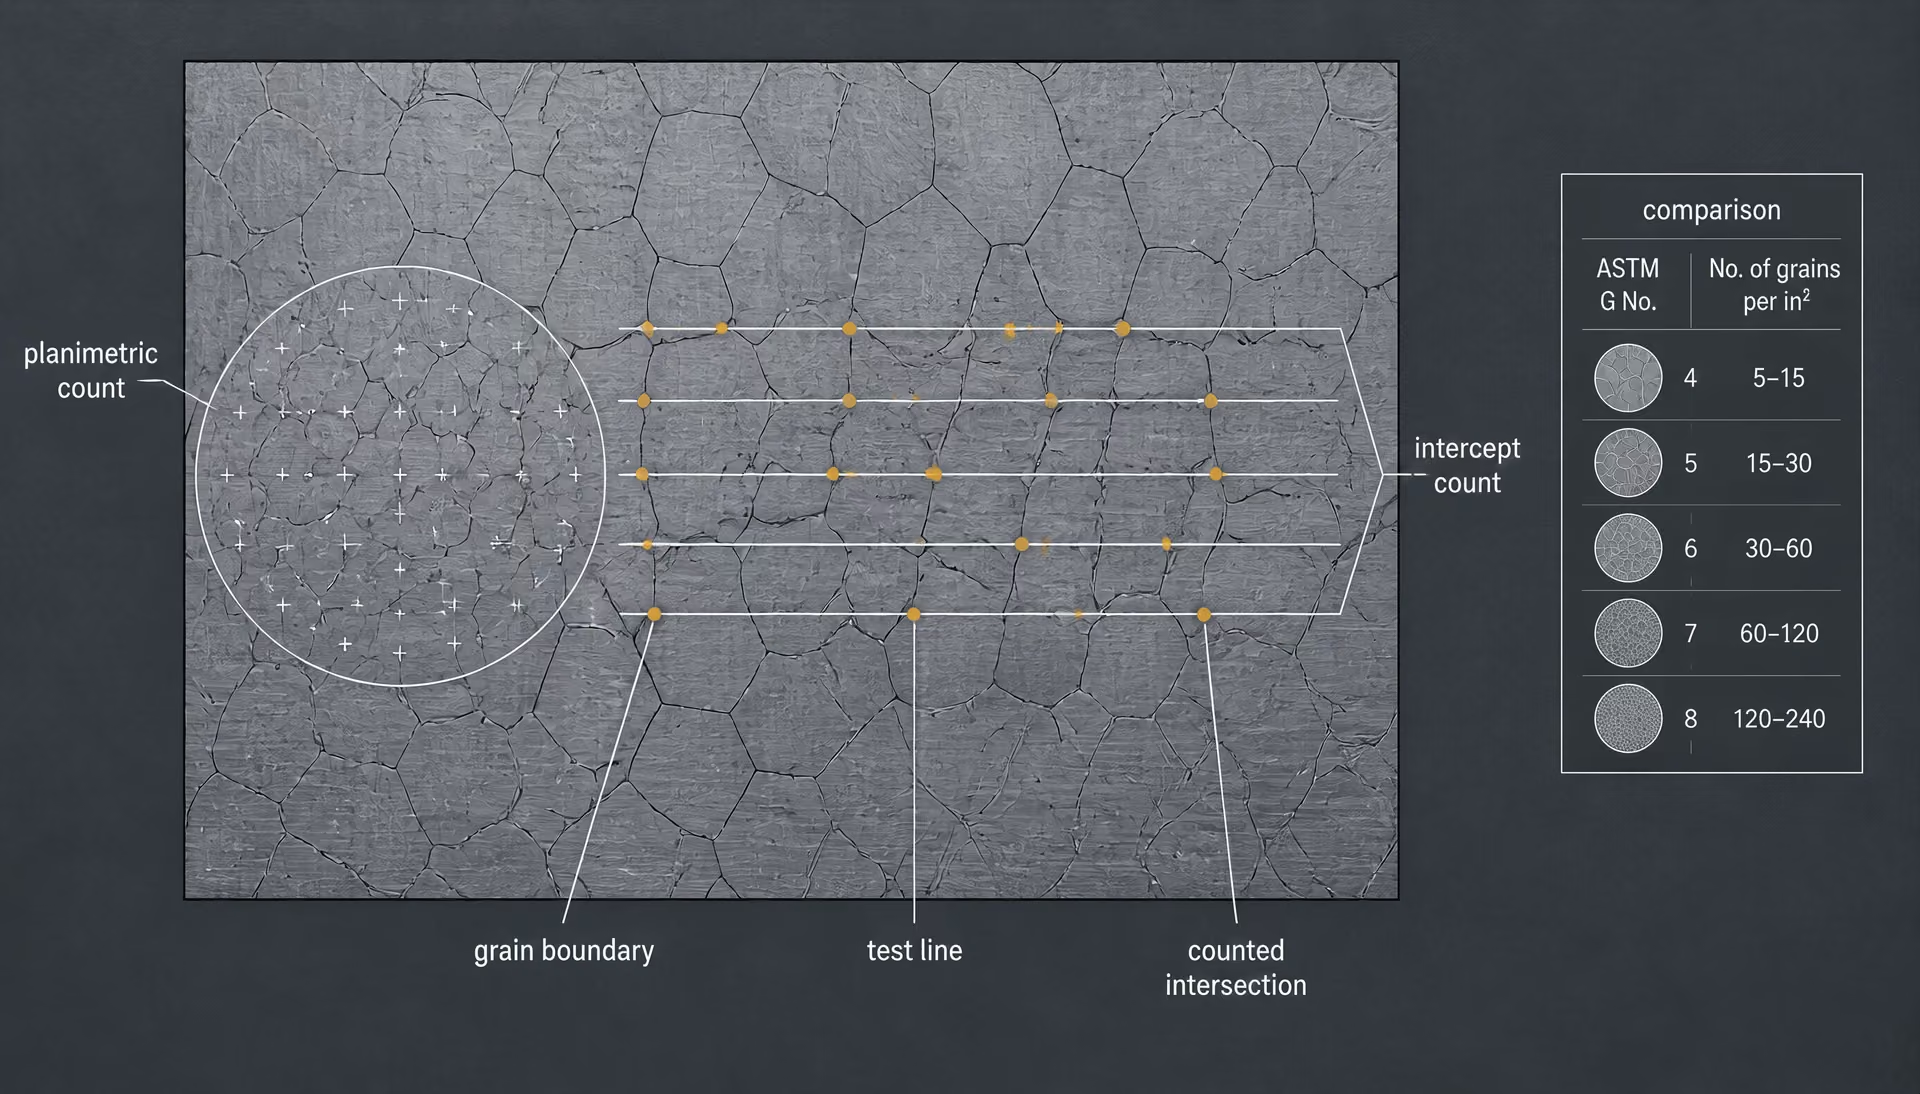
“Grain size” is therefore a statistical description of a polycrystalline structure, not a single visible feature. ASTM E112, Standard Test Methods for Determining Average Grain Size, provides comparison, planimetric, and intercept procedures for determining average planar grain size. The planimetric method counts grains within a known area; the intercept method counts intersections between test lines and grain boundaries. The ASTM grain size number is derived from grain counts per unit area or grain-boundary intercepts.
An average conceals variation. A section may contain many 10 micrometre grains and a smaller population of 100 micrometre grains, yet report an average that appears acceptable. Those coarse grains can dominate crack initiation, local strain concentration, or cleavage behaviour. A distribution, including its spread, upper tail, and spatial location, can be more informative than the arithmetic mean.
Shape is equally important. Equiaxed grains have similar dimensions in different directions and commonly form after recrystallization or substantial annealing. Elongated grains develop when rolling, drawing, forging, or other deformation stretches the structure in a processing direction. Columnar grains grow preferentially along a thermal gradient, as in castings and some weld metal. Duplex structures contain two distinct grain-size populations or morphologies, such as coarse and fine ferrite, and cannot be represented faithfully by one average. Banded structures contain alternating regions enriched in particular phases or alloying elements, often aligned with the rolling direction. The “grain size” measured on a transverse section may then differ markedly from that measured longitudinally.
This directional dependence is not a minor measurement detail. An elongated grain with a 1 micrometre transverse dimension may be several times longer in the rolling direction. In a 2018 study reported by the Japan Society of Mechanical Engineers, low-carbon steel containing ultrafine elongated grains showed a transverse grain size of about 1.0 micrometre at the condition giving the reported best balance among strength, ductility, and toughness. Calling that structure simply “1 micrometre grain steel” omits the geometry that helped determine its behaviour.
The same caution applies to ultrafine transformed structures. A 2014 study from Yonsei University examined a metastable austenitic alloy with grain sizes from 0.3 to 2 micrometres. Tensile strengths near 900 MPa and elongations near 40% were reported when strain-induced martensitic transformation supplied additional strain hardening. That ductility did not arise from grain refinement alone. It depended on phase stability and the transformation mechanism during deformation.
Why a grain-size number is not a complete microstructural description
A grain-size number says little unless the measured phase, section orientation, test method, and morphology are stated. ASTM grain size numbers should not be treated as interchangeable with micrometre values without that information. Two laboratories can report the same nominal ASTM number while examining different phases, using different intercept directions, or excluding boundaries that one laboratory counts and the other does not. ASTM E2627, published for electron backscatter diffraction measurements, addresses average grain size, grain-size distributions, and statistical information in fully recrystallized polycrystalline materials. EBSD can also expose orientation relationships, subgrains, and texture that optical images miss, although its boundary-definition criteria must still be specified.
The number also does not identify the steel’s phase constitution or processing history. A ferritic-pearlitic steel, a quenched-and-tempered martensitic steel, and a bainitic steel may have similar measured intercepts but very different strength, toughness, and fracture paths. Cold deformation can elongate grains and create stored energy without producing a refined recrystallized structure. A reheating treatment can coarsen austenite before transformation, while a later transformation can produce fine packets or laths that make the final structure appear fine by another measurement.
In ferritic-pearlitic steels, yield strength and transition temperature vary approximately with the inverse square root of ferrite grain diameter. Strong evidence
[1] NIST Special Publication 596. National Institute of Standards and Technology. NIST Special Publication, 1996.Hall–Petch behaviour is strongest as a guide for yield strength and transition behaviour in ordinary ferritic steels. NIST Special Publication 596, published in 1996, reports that yield strength and ductile-to-brittle transition temperature in ferritic-pearlitic steels vary approximately with the inverse square root of ferrite grain diameter. Tensile strength is less consistently grain-size-sensitive, while elongation is comparatively insensitive. The European Structural Engineering Design Programme likewise reports that reducing grain size raises yield strength and substantially lowers the ductile-to-brittle transition temperature. These trends support refinement, but they do not justify ranking microstructures by grain size alone.
Fracture may follow ferrite boundaries, pearlite colonies, martensite blocks, inclusions, segregation bands, or prior-austenite boundaries, depending on temperature and loading. Slip may be controlled by ferrite grains in one steel and by lath or packet boundaries in another. Measurement must therefore answer a specific question: which structural unit is being quantified, and which mechanism is expected to control the property?[2] Assessing the Quality of Received 4340 Steel for Production of NIST Charpy Reference Specimens. National Institute of Standards and Technology. NIST assessment report, 2001.
NIST’s 2001 assessment of 4340 steel makes the practical consequence clear. Acceptable heats used for Charpy reference specimens had grain sizes of approximately 30–40 micrometres, whereas unacceptable heats were approximately 60–70 micrometres. The measurement served as a quality-assessment signal, not a complete explanation by itself. Grain size identified a meaningful processing difference, but its significance came from the associated toughness response and heat-treatment history. A defensible description of steel grain size must do the same: report the statistic, then identify the phase, morphology, orientation, distribution, and fracture or deformation mechanism behind it.

How ASTM E112 Measures Grain Size
ASTM E112, Standard Test Methods for Determining Average Grain Size, measures average planar grain size in metallic materials by three principal approaches: comparison, planimetric counting, and intercept measurement. The standard does not assign a single physical diameter to every grain. It provides procedures for obtaining a statistical average from a prepared metallographic image, then expressing that result as an ASTM grain size number, a mean intercept length, or another permitted form.
That distinction matters because real grains are not identical circles or cubes. They may be elongated by rolling, flattened near a surface, distorted by forging, or mixed with several phases. A ferrite grain, a prior-austenite grain, and a martensite packet are different structural features, even when an image makes their boundaries appear similar. The report therefore needs to state what boundary was measured, which phase was assessed, the specimen orientation, the magnification, and the ASTM E112 procedure used.
| Sampling factor | Why it matters | Report |
|---|---|---|
| Section plane | Grain shape and intercepts vary with direction | Longitudinal, transverse, or through-thickness plane |
| Field selection | Coarse or fine regions can bias the average | Number and locations of fields |
| Magnification | The represented specimen area changes | Magnification or calibrated scan dimensions |
| Boundary definition | Different features may be counted as grains | Phase and qualifying boundary |
The examination begins with representative sampling. The section is mounted, ground, polished, and etched so that the boundaries being measured are visible without excessive staining, pull-out, scratches, or deformation. The image must contain enough grains for a meaningful average and must not be selected solely because it shows an unusually coarse or fine region. For rolled plate, for example, images commonly come from longitudinal, transverse, and through-thickness planes because grain shape can differ strongly between them. If a heat-treated steel contains ferrite and pearlite, the analyst must decide whether the measurement concerns ferrite grains, prior-austenite grains, or another defined population.
Magnification is part of the measurement, not a decorative image-setting choice. A field that is too small gives poor statistics; one that is too low in magnification may hide boundaries. Boundaries must be visible at the selected magnification, and the test should cover several fields where the structure is representative. ASTM E112 also requires attention to grains intersecting the test border. In a planimetric count, partial grains are handled by a specified border rule rather than simply ignored. In an intercept count, a boundary intersection is counted according to the procedure, while the ends of the test line require consistent treatment.
Comparison method and ASTM grain size number
The comparison method places the test micrograph beside standardized ASTM comparison charts at a stated magnification. The operator selects the chart field that most closely resembles the specimen and assigns the corresponding ASTM grain size number, conventionally written as . The comparison method is quick and useful for routine inspection, but it is a visual estimate. It becomes less reliable when grains are strongly elongated, when the image contains mixed grain sizes, or when phase contrast makes some boundaries more apparent than others.
The ASTM grain size number is logarithmic. It is not a micrometre label. Under the conventional relationship used by ASTM E112, the number of grains per square inch at 100×, , is related to by:
Thus, increasing by one doubles the counted number of grains in the specified comparison area. A higher ASTM number therefore indicates a finer statistical grain structure, while a lower number indicates coarser grains. The number does not mean that each grain has a diameter of micrometres, and it cannot be converted to a unique micrometre value without specifying the measurement convention and assuming a particular morphology.
For example, two steels may both be reported as ASTM grain size No. 8 by comparison, while their actual grain shapes differ because one has equiaxed ferrite and the other has elongated grains produced by rolling. Their mean linear intercepts, mechanical anisotropy, and fracture paths may not be the same. Conversely, an intercept result expressed in micrometres should not be relabeled as an ASTM number unless the applicable conversion and assumptions are stated.
The comparison method also has a practical limitation: the chart match depends on etching quality and boundary visibility. A dark constituent at a grain boundary can make grains appear smaller; faint boundaries can make them appear larger. When the result affects acceptance, failure analysis, or a process decision, a counted method generally gives a more traceable result.
Planimetric or Jeffries procedure
Planimetric counting sequence
- Define the field Superimpose a test circle, rectangle, or other known region.
- Count interior grains Record grains fully contained within the test area.
- Apply the border rule Include boundary-intersected grains using the prescribed correction.
- Correct for magnification Convert image area to the actual specimen area represented.
- Report the result Give the phase, fields, magnification, procedure, and calculated grain population.
The planimetric procedure, often called the Jeffries method, counts grains within a known test area. A test circle, rectangle, or other defined region is superimposed on the micrograph. The analyst counts grains entirely inside the region and applies the prescribed treatment to grains intersected by the border. The result is a grain count per unit area, , after correction for the microscope magnification and the physical area represented by the test field.
Conceptually, the calculation is simple:
The actual area is the image area divided by the square of magnification. If the image is enlarged from 100× to 200×, the same printed or displayed area represents one-quarter as much specimen area, so the magnification correction cannot be omitted. Jeffries counting factors or the equations specified by ASTM E112 provide a convenient way to account for interior and border grains and convert the count to the ASTM grain size number.
The border correction is important. A grain cut by the test boundary is only partly represented in the region, but omitting every partial grain would bias the count low, especially when the test area is small. The Jeffries procedure uses a defined weighting or equivalent counting rule so that the expected contribution of boundary-intersected grains is included. The analyst should not invent a different correction from field to field.
The planimetric result represents an average number of grains per unit area. It does not directly measure grain volume or provide a complete three-dimensional grain-size distribution. A section through a three-dimensional structure can cut large grains near their edges and small grains near their centers, so the measured planar population is a stereological sample. Several fields are required, particularly where recrystallization is incomplete or abnormal grain growth has produced a mixed structure.
Counting is most defensible when the boundaries are continuous and the phase being measured is clearly identified. If pearlite colonies, martensite packets, carbide films, and prior-austenite boundaries are all visible, the operator must define which network qualifies as a grain boundary. Reporting only “ASTM No. 8” conceals that decision. A suitable record identifies ASTM E112, the planimetric or Jeffries procedure, the phase, magnification, section orientation, number of fields, and the calculated result.
Intercept or Heyn procedure
Mean linear intercept The total actual test-line length divided by the number of qualifying grain-boundary intercepts.
The intercept procedure, also called the Heyn method, estimates grain size from the lengths of lines drawn across the microstructure. The test may use straight lines, a circle, or another defined geometry. Every time a test line crosses a qualifying grain boundary, an intercept is recorded. The total test-line length divided by the number of counted intercepts gives the mean lineal intercept:
Here, is the total actual length of test line within the specimen and is the number of grain-boundary intercepts, with endpoint and boundary rules applied as specified by ASTM E112. More boundary crossings per unit length mean a smaller mean intercept and, generally, a finer structure.
The intercept method therefore converts boundary spacing into an average planar length scale. It is often preferable to a visual comparison when grains are elongated, because line direction can reveal anisotropy. A longitudinal line through rolled steel may produce a different mean intercept from a transverse line. For an approximately equiaxed structure, averaging several line directions gives a more representative value. For an elongated structure, the direction should be reported rather than hidden in a single number.
A circular test line can sample several directions in one field, but it does not remove the need for adequate sampling. The analyst should use enough lines and fields to reduce random variation and should avoid placing a line preferentially through an unusually coarse or fine region. When a line meets a triple junction, tangent boundary, indistinct boundary, or inclusion, the counting rule must be applied consistently. A polished image with broken or falsely etched boundaries can produce a precise-looking number that describes the preparation artifact rather than the steel.
ASTM grain size numbers can be derived from intercept measurements through the relationships and tables specified in ASTM E112, but the conversion does not turn the number into a universal grain diameter. Mean intercept length, equivalent grain diameter, and ASTM describe related statistical quantities, not interchangeable physical features. The report should retain the primary result, such as a mean intercept of a stated number of micrometres, along with the derived ASTM number and the method used.
ASTM E112 is directed at average planar grain size. It does not by itself describe the full grain-size distribution, crystallographic texture, phase fraction, or three-dimensional morphology. For fully recrystallized polycrystalline materials examined by electron backscatter diffraction, ASTM E2627 addresses average grain size, distributions, and associated statistical information. That distinction prevents a chart comparison, a Jeffries count, an intercept measurement, and an EBSD boundary map from being treated as though they produced identical measurements.
EBSD, Image Analysis, and Modern Grain-Size Characterization
Grain-size measurement is not simply a matter of counting dark regions in a micrograph. The reported value depends on what constitutes a grain, which phase is being measured, how boundaries are revealed, and how much area is sampled. ASTM E112, revised by ASTM International in 2024, recognizes comparison, planimetric, and intercept procedures for average planar grain size. Its ASTM grain size number is calculated from grain counts per unit area or grain-boundary intercepts, not assigned directly from a universal micrometre conversion. A value such as ASTM grain size number 8 therefore has meaning only with the procedure, specimen orientation, phase, and morphology stated.
Etched optical microscopy remains useful because it is fast, inexpensive, and capable of covering a comparatively large area. It shows the structure that a metallurgist actually prepared for examination: ferrite, pearlite, bainite, martensite, inclusions, deformation bands, and abnormal grains may all affect the contrast. The limitation is that an etched line is not always a crystallographic grain boundary. Some boundaries etch weakly, while phase contrast can create lines that an image-analysis program interprets as boundaries. Over-etching may merge adjacent grains; under-etching may break one grain into several dark regions.
Automated image analysis improves repeatability when the contrast is clear. Thresholding, watershed separation, edge detection, and manual correction can convert an image into grain areas, equivalent diameters, aspect ratios, and size distributions. Yet the software measures the segmentation supplied to it. If pearlite colonies are segmented rather than prior-austenite grains, the resulting “grain size” describes colonies. If elongated ferrite grains are reduced to area-equivalent circles, the value hides the transverse and longitudinal dimensions that control different deformation paths.
| Technique | Primary information | Typical output |
|---|---|---|
| Etched optical microscopy | Visible phase and boundary contrast | Average size, morphology, inclusions, banding |
| Automated image analysis | Segmented image features | Areas, equivalent diameters, aspect ratios, distributions |
| EBSD | Local crystallographic orientation | Grains, misorientation boundaries, texture, phase-specific statistics |
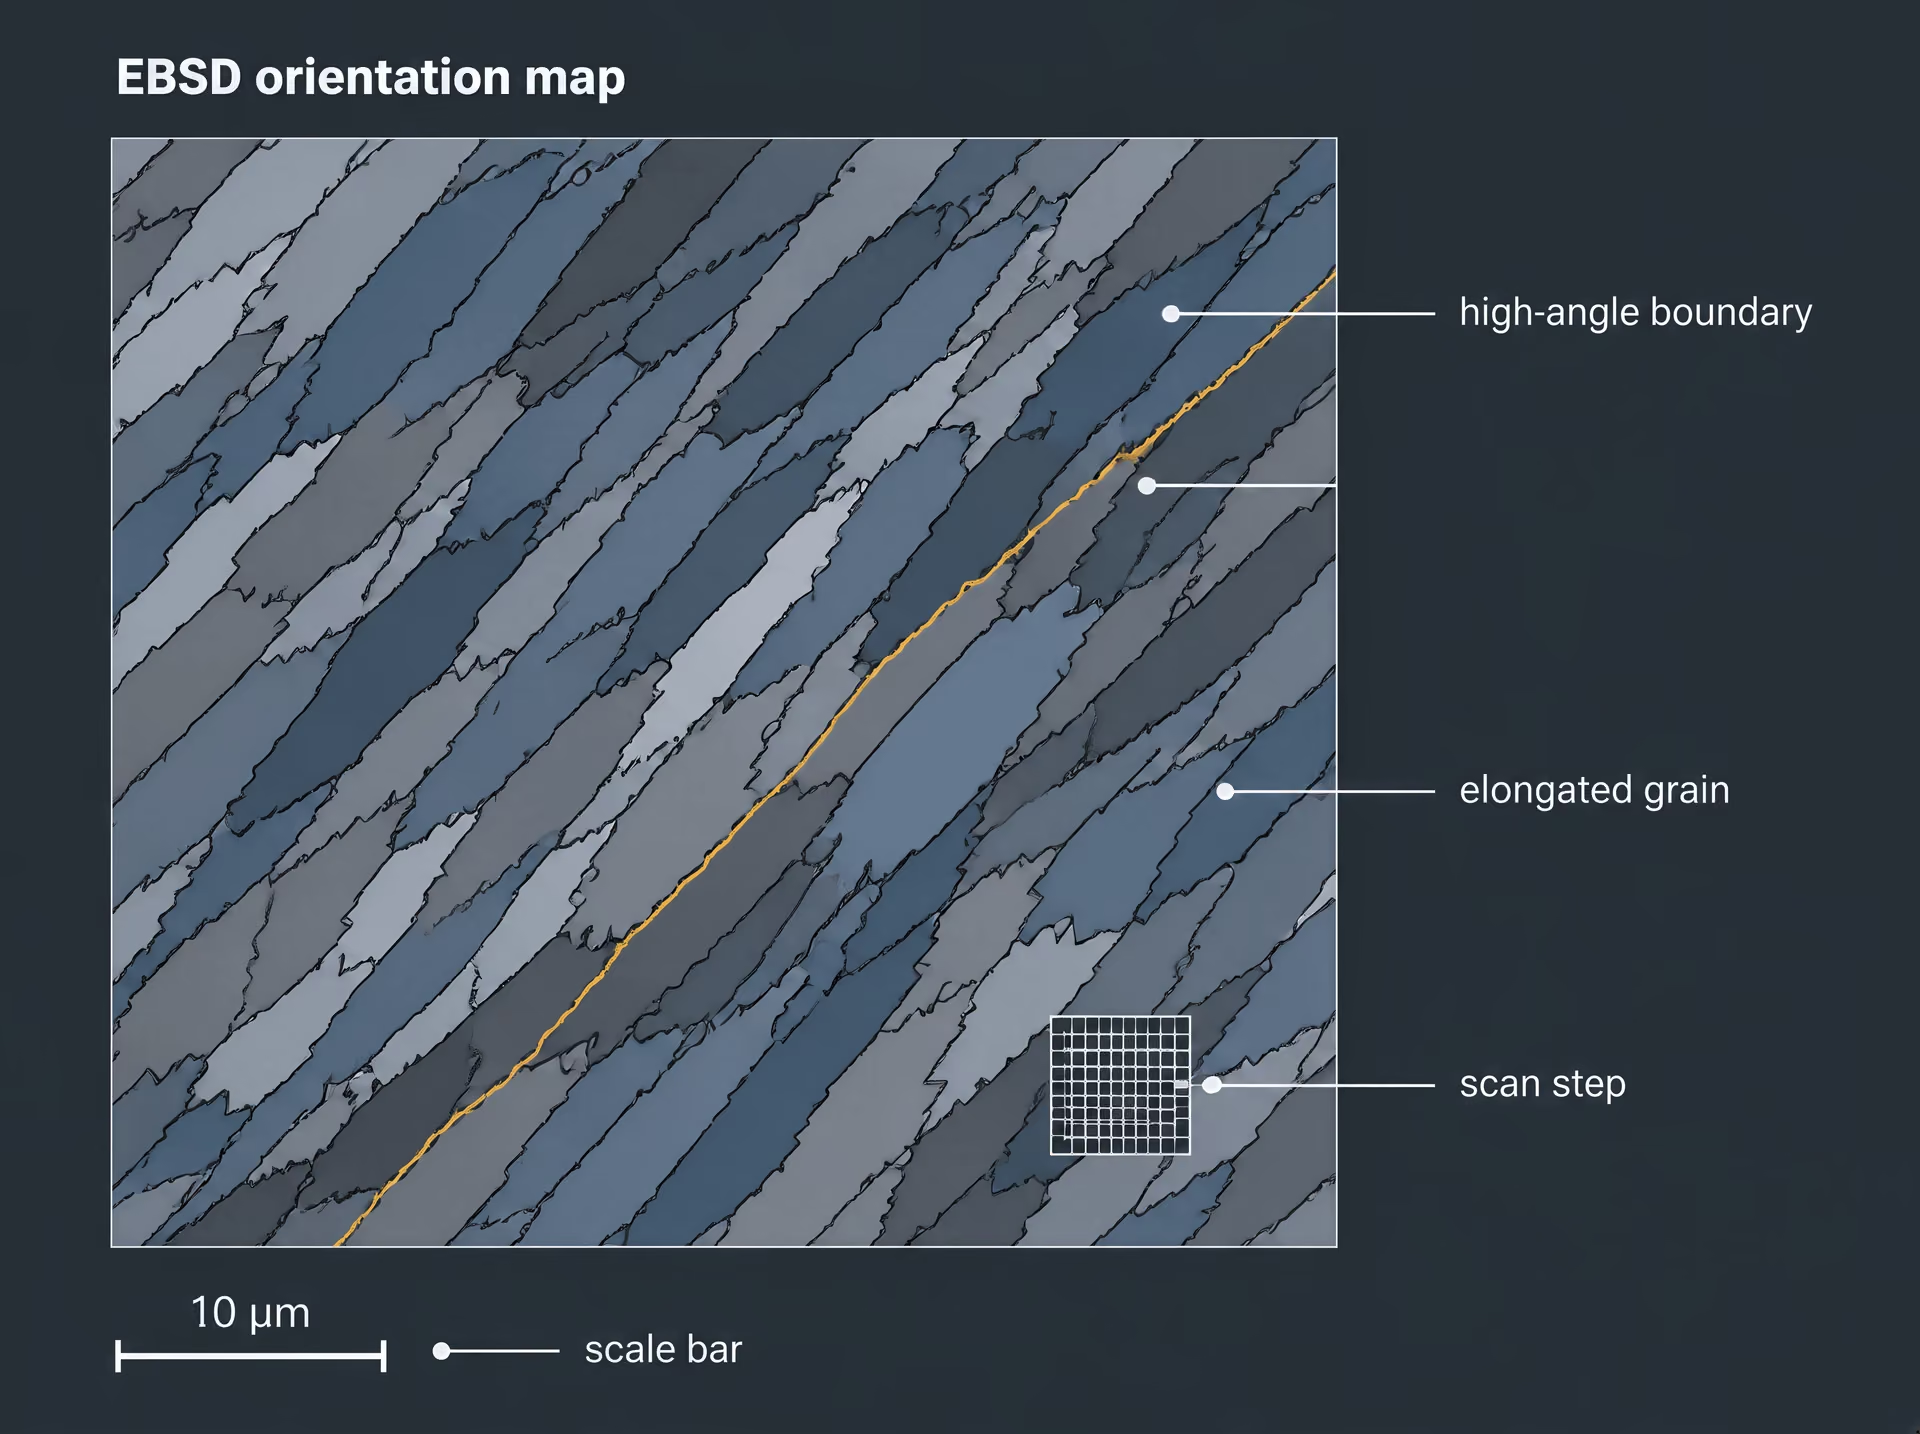
EBSD adds crystallographic information. In electron backscatter diffraction, a focused electron beam scans a polished surface and records diffraction patterns from which the local crystal orientation is indexed. The result is an orientation map rather than a picture based only on etching. Neighboring measurement points can be grouped into grains when their orientations fall within a selected misorientation tolerance. From the same map, analysis can produce mean grain size, grain-size distributions, aspect ratios, orientation distributions, boundary-length fractions, and other statistical measures.

ASTM E2627 and EBSD orientation mapping
ASTM E2627-2017 covers determining average grain size by EBSD in fully recrystallized polycrystalline materials. The practice also addresses grain-size distributions and statistical information. That qualification matters. A recrystallized structure contains grains that can be separated through orientation changes, whereas a heavily deformed structure may contain subgrains, cells, deformation bands, and continuously varying lattice rotation. Applying a single grain-size calculation to both structures can give a misleading comparison.
An EBSD map is built from discrete pixels or measurement points. Step size is therefore a controlling variable. A step size that is too large can miss narrow grains and fail to resolve thin boundary regions; one that is too small increases acquisition time and may cover too little area for a representative distribution. A practical study must resolve the smallest grains of interest with several measurement points across their width and must sample enough fields to include coarse grains, clusters, and rare abnormal regions. Otherwise the calculated mean may be precise to several decimal places but poor as a description of the steel.[3] New ASTM Standard Covers Use of Electron Backscatter Diffraction to Measure Grain Size. ASTM International. ASTM International standard announcement, 2017.
The map also needs cleaning rules. Unindexed pixels may be filled, removed, or assigned through neighboring orientations. Small isolated regions may be eliminated as noise, but that operation can remove genuine ultrafine grains. ASTM E2627 measurements should therefore report the step size, indexing quality, cleanup procedures, grain reconstruction tolerance, analyzed area, and number of grains. Without those details, two EBSD results labeled “average grain size” may not be directly comparable.
EBSD is especially useful where grain morphology makes a single diameter inadequate. An ultrafine elongated grain structure in low-carbon steel, for example, may have a transverse grain size near 1.0 micrometre while extending much farther in the rolling direction. A 2018 study reported that this approximately 1.0 micrometre transverse dimension gave the strongest balance among strength, ductility, and toughness within its tested processing conditions. Reporting only an area-equivalent diameter would conceal the directional structure.
Boundary misorientation and phase-specific measurements
A crystallographic grain boundary is identified through the orientation difference between neighboring points. The boundary misorientation includes both the angular difference and, where relevant, the rotation axis. Analysts commonly classify boundaries below about 15° as low-angle boundaries and those above 15° as high-angle boundaries, but these are analysis conventions rather than laws of nature. A study may use a 2° minimum misorientation to suppress indexing noise and then define reconstructed grains with a 5°, 10°, or 15° threshold. Changing that threshold changes the grain count and mean size.
Low-angle boundaries often separate subgrains formed during recovery or deformation. High-angle boundaries more commonly separate distinct recrystallized grains and are often the boundaries intended in a conventional grain-size measurement. Calling every orientation change a grain boundary would split a recovered ferrite grain into many subgrains. Calling only high-angle interfaces boundaries would combine those subgrains into a larger parent region. Both calculations may be internally consistent while describing different structural levels.
The distinction becomes more important in transformed steels. Martensite packets, blocks, and prior-austenite grains have different crystallographic and mechanical meanings. An EBSD map may identify packet or block boundaries according to their misorientation, while an etched optical image may show a larger martensitic region without resolving either feature. In bainite, carbide-free ferrite, or dual-phase steels, the analyst must state whether the result concerns ferrite grains, austenite, martensitic blocks, or all indexed regions grouped under one tolerance.
Phase identification can be combined with orientation mapping because EBSD patterns contain information about crystal symmetry and lattice structure. With suitable indexing, ferrite, austenite, cementite, and other phases can be separated before grain statistics are calculated. This prevents a phase boundary from being counted as an ordinary grain boundary and permits phase-specific results, such as ferrite grain size in a ferritic-pearlitic steel. Chemical information from energy-dispersive spectroscopy can support phase assignment when crystal structures produce similar or weakly distinct patterns, although EBSD phase identification still depends on pattern quality, surface preparation, and the phase library used.
When conventional metallography and EBSD disagree
Disagreement between an etched image and an EBSD map does not automatically mean that one method is wrong. The methods may be measuring different boundaries. Optical analysis may follow visible etch lines, while EBSD follows an orientation threshold. A phase boundary may be prominent optically but excluded from a single-phase EBSD calculation. Conversely, EBSD may divide a visually uniform region into low-angle subgrains.
Sampling can produce a second disagreement. An optical image may cover several square millimetres, whereas an EBSD scan may cover a few hundred square micrometres. Coarse grains, banding, and local segregation then have a much greater effect on one result than the other. The same problem occurs when one method measures a longitudinal section and the other a transverse section. ASTM E112 intercept measurements and EBSD grain reconstructions should not be compared without matching section orientation and boundary definition.
Preparation also matters. Mechanical polishing can leave a deformed surface layer that weakens or distorts EBSD patterns. Electropolishing or carefully controlled final polishing may be required for reliable indexing. Etching, by contrast, can reveal boundaries that are invisible in a polished EBSD specimen but can also exaggerate phase contrast. Automated optical analysis may report a smaller size because it counts visible colonies; EBSD may report a larger ferrite grain size because the colony boundaries do not carry the selected crystallographic misorientation.
The practical response is to report both the method and the object measured: for example, “ferrite high-angle grain size by EBSD using a 15° reconstruction threshold,” or “intercept grain size from etched optical micrographs according to ASTM E112.” Such precision matters in quality assessment. NIST reported acceptable 4340 steel heats with grain sizes of approximately 30–40 micrometres and unacceptable heats near 60–70 micrometres in a 2001 assessment, but those numbers are meaningful because the examination and comparison were defined. Grain size is evidence about processing history, not a standalone label.
The Hall–Petch Effect in Steel
The Hall–Petch effect describes a common increase in steel strength as the mean grain size decreases. In its classical form,
where is the yield stress, represents the friction stress required for dislocation motion in the matrix, is the Hall–Petch slope, and is a characteristic grain dimension. Depending on the study, may be the mean planar grain diameter or the mean linear intercept measured on a polished section. The equation is therefore not a complete material law. It is a fitted relationship for a defined steel, phase structure, grain morphology, temperature, and test method.
The distinction matters because “grain size” is a statistical description, not a single visible feature. ASTM E112:2024 specifies comparison, planimetric, and intercept procedures for average planar grain size. Its ASTM grain size number is derived from grain counts per unit area or grain-boundary intercepts; it is not a micrometre value that can be transferred between all measurement methods without qualification. A ferrite grain diameter, an austenite grain size reconstructed from transformation products, and a transverse intercept through elongated grains do not describe the same geometric quantity.

Grain boundaries as obstacles to dislocation slip
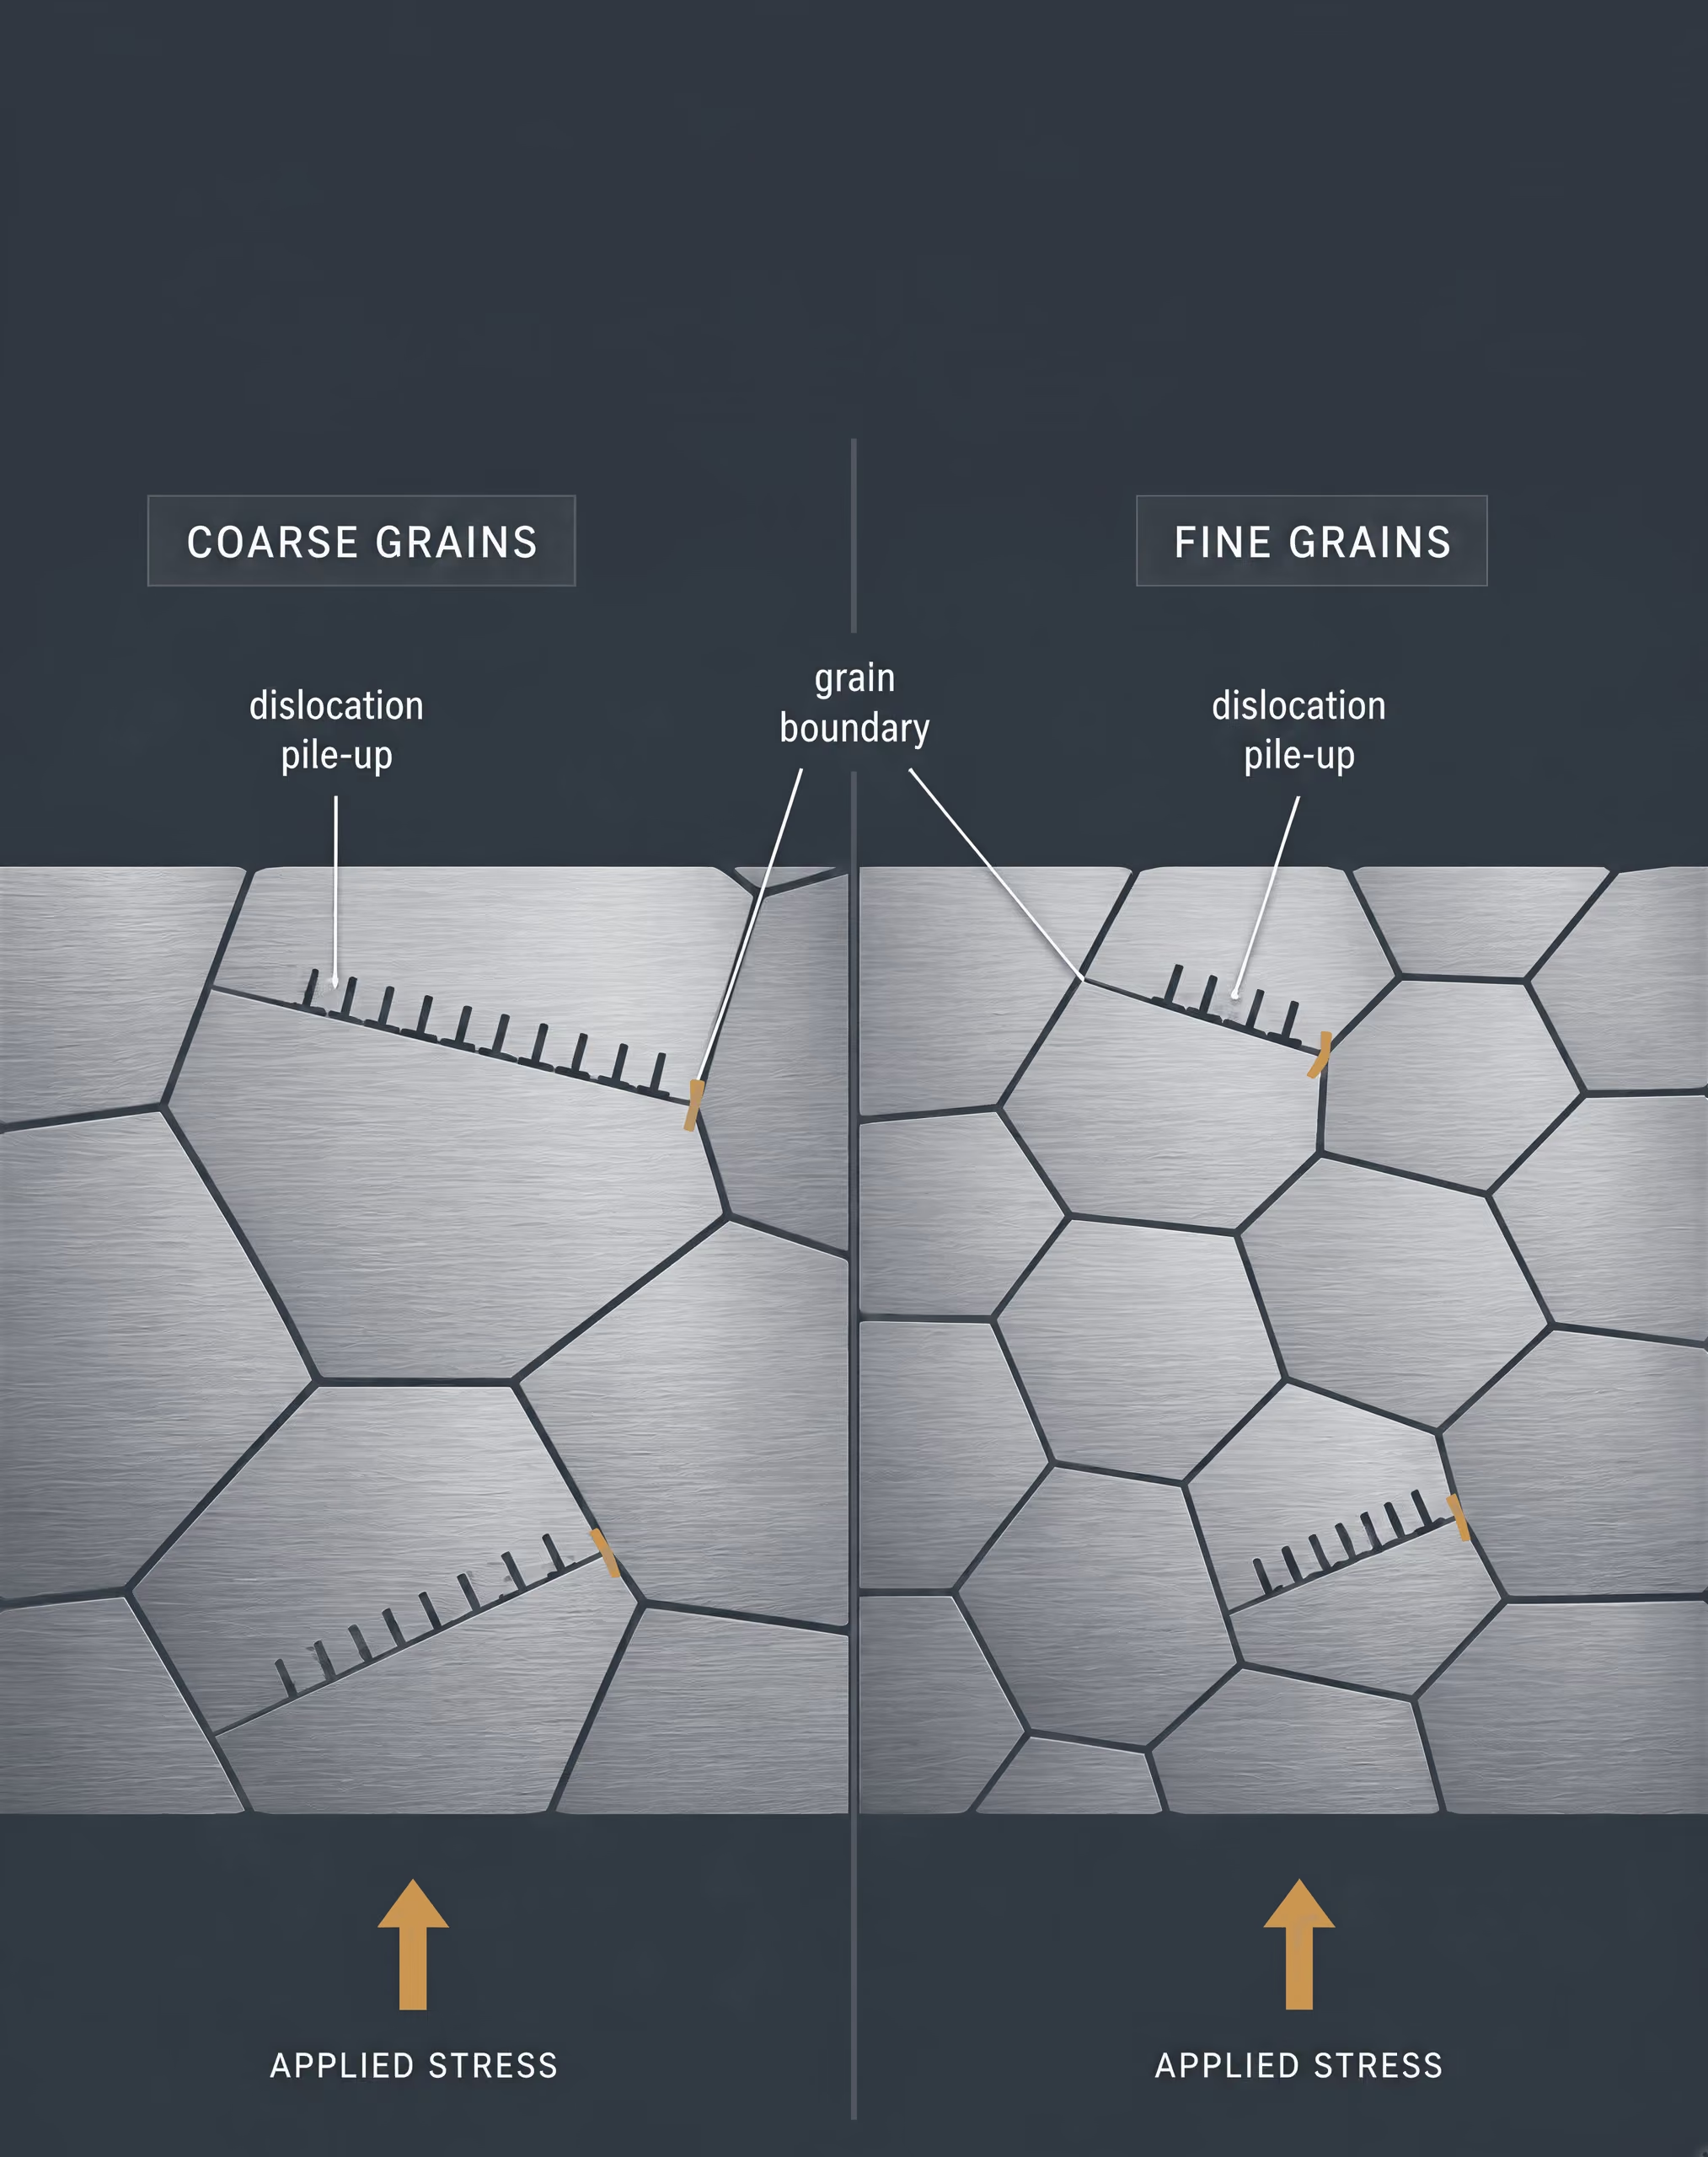
Plastic deformation in ferritic steel occurs mainly by dislocation glide on crystallographic slip systems. A dislocation moving through one grain encounters a boundary before it can continue into the next grain. The neighbouring grain generally has a different crystal orientation, so the incoming slip plane and slip direction do not line up with a suitable system on the other side. The boundary may also contain segregation, precipitates, residual strain, or a change in phase constitution. These features make transmission more difficult.
A simple picture uses a dislocation pile-up. Several dislocations travel on the same slip plane and collect at a grain boundary. Their combined stress concentration acts at the head of the pile-up. If that local stress becomes high enough, dislocation transmission into the adjacent grain, nucleation of a new dislocation, or local deformation near the boundary can occur. Smaller grains provide less distance for a pile-up to develop. More applied stress is then required to produce a sufficient concentration at the boundary, which gives the inverse-square-root trend.
That picture is useful, but it is not the only mechanism. In very small grains, a conventional pile-up may contain only a few dislocations, or none. Plasticity can then depend on dislocation emission from boundaries, dislocation absorption, grain rotation, boundary sliding, or deformation twinning. The boundary is not simply an impenetrable wall. Its character, crystallographic misorientation, inclination, chemistry, and local stress state affect whether it blocks, transmits, or generates plastic carriers.
Ferritic-pearlitic steels show the classical response most clearly when ferrite grain size is varied while carbon content, pearlite fraction, precipitation, texture, and processing condition remain controlled. NIST Special Publication 596 (1996) reported that yield strength and ductile-to-brittle transition temperature in such steels vary approximately with the inverse square root of ferrite grain diameter. Tensile strength is less consistently grain-size-sensitive, while elongation is comparatively insensitive. This difference follows from the fact that yield begins with local dislocation motion, whereas ultimate tensile strength and fracture strain also depend on work hardening, pearlite morphology, necking, inclusions, damage development, and the full phase arrangement.[4] Steel: Microstructure and Grain Refinement. European Structural Engineering Design Programme. ESDEP lecture material, 2000.
The fracture benefit can be substantial. Smaller ferrite grains divide cleavage paths and make cleavage-crack propagation more difficult. European Structural Engineering Design Programme material published in 2000 describes grain refinement as increasing yield strength while substantially lowering the ductile-to-brittle transition temperature. That result is especially important in ferritic steels exposed to low temperatures, where a small shift in transition behavior can change the failure mode from ductile tearing to cleavage.
The inverse-square-root relationship
The term means that strength does not rise in direct proportion to refinement. If the relevant grain dimension is reduced from to , the inverse square root increases from to , a factor of two. The grain-size contribution to yield strength therefore doubles, but the total yield strength does not necessarily double because and other strengthening contributions remain present.[5] Hall–Petch relationship. University of Cambridge. Phase Transformations materials notes, 2005.
The University of Cambridge’s 2005 treatment states the classical relation in terms of mean linear intercept. A common form is
where is the mean intercept length. Some studies use an average grain diameter instead. Those forms can produce different numerical slopes even when they describe the same microstructure, because grain shape and the measurement direction alter the relation between diameter and intercept.
The slope is not a universal constant for steel. It changes with ferrite composition, carbon and nitrogen content, substitutional solutes, precipitation, dislocation density, grain-boundary character, texture, and temperature. It also depends on whether the measured response is lower yield strength, upper yield strength, 0.2% proof stress, or another defined point on the stress–strain curve. A tensile test, a compression test, and a Charpy transition measurement do not interrogate the same local deformation process.
Phase constitution is equally important. In a ferritic-pearlitic steel, ferrite grain size may control the onset of yielding while pearlite colonies, lamellar spacing, and colony orientation affect subsequent hardening and fracture. In bainitic, martensitic, dual-phase, or tempered structures, the “grain” visible by a selected etchant may be a prior-austenite grain, a packet, a block, or an effective slip length. Treating each as interchangeable with ferrite grain diameter can assign a misleading Hall–Petch slope to the wrong structural scale.
Morphology can make a single mean value particularly inadequate. Equiaxed grains produce a different obstacle arrangement from elongated grains. A rolled steel may have a fine transverse intercept but a much larger longitudinal intercept, together with a strong deformation texture. A Japan Society of Mechanical Engineers study published in 2018 found that low-carbon steel containing ultrafine elongated grains had a transverse grain size of about at the reported best balance among strength, ductility, and toughness. That result cannot be reproduced by specifying “1 micrometre grain size” alone; the elongation, direction, phase structure, and processing history are part of the description.
Ultrafine-grained alloys also show why the classical line must be used carefully. A 2014 Yonsei University study of metastable austenitic alloy with grain sizes from to reported tensile strengths near and elongations near , with strain-induced martensitic transformation supplying additional strain hardening. The measured strength and ductility arose from grain refinement plus transformation behavior, not from the grain-size term alone.
What the relation can and cannot predict
A Hall–Petch plot can be useful when the specimens belong to one controlled microstructural family. If yield stress is plotted against for ferritic steels with comparable composition, phase fraction, texture, heat treatment, and testing temperature, the slope and intercept can quantify the grain-size contribution. The fit can then support process control or explain why one heat yields at a different stress from another.
It cannot, by itself, predict toughness, fatigue life, weld performance, or tensile elongation across unrelated steels. Nor can it identify which microstructural scale controls fracture. Cleavage may respond to ferrite grain size, while ductile rupture may be governed more strongly by inclusions and particle spacing. A transformed steel may be controlled by packets or blocks rather than prior-austenite grains. At very small sizes, the pile-up basis of the classical derivation weakens and the trend may flatten, change slope, or reverse when boundary-mediated deformation and instability become important.
Measurement quality is part of the prediction problem. NIST’s 2001 assessment of 4340 steel distinguished acceptable heats with grain sizes of approximately – from unacceptable heats near –, showing how grain-size inspection can reveal production differences. Yet that comparison has meaning only with a stated method, location, phase, and morphology. ASTM E2627:2017 adds electron backscatter diffraction procedures for average grain size, distributions, and statistical information in fully recrystallized polycrystalline materials. EBSD can separate orientation-defined grains from visually etched regions, but it still requires declared misorientation criteria and sampling choices.
The defensible interpretation is limited but powerful: grain refinement often raises yield strength and improves low-temperature fracture resistance, especially in ferritic steels. The numerical increase belongs to the tested microstructural family. A Hall–Petch coefficient is a measured parameter, not a transferable design constant stamped onto every steel grade.
Effects of Grain Size on Yield Strength and Hardness
Grain refinement generally raises yield strength because grain boundaries obstruct dislocation motion. A dislocation moving through one ferrite crystal must either transmit into a neighboring crystal with a different orientation or accumulate at the boundary until the applied stress is high enough to continue slip. Smaller grains create more boundaries over a given distance, increasing the stress required for widespread plastic flow.
The classical Hall–Petch relation expresses this effect as:
where is yield strength, represents other strengthening contributions, is the Hall–Petch slope, and is a characteristic grain dimension. The University of Cambridge’s 2005 treatment describes the grain-size contribution in terms of the inverse square root of mean linear intercept. ASTM E112 does not define grain size from a single visible feature: its comparison, planimetric, and intercept procedures derive an average planar grain size from grain counts or grain-boundary intercepts. The measured value therefore depends on the method, section plane, phase being measured, and grain morphology.
Hardness often increases with refinement because indentation produces plastic flow, and the same barriers that raise yield strength resist that flow beneath the indenter. This relationship is useful, but it is not a license to treat a hardness reading as a direct grain-size measurement. A steel can become harder because of carbon in solid solution, martensite, bainite, pearlite refinement, carbide precipitation, retained austenite, cold-work dislocations, or a change in phase fraction. Grain size may have changed at the same time, but the hardness increase cannot automatically be assigned to it.
Ferritic and low-carbon steels
The Hall–Petch trend is clearest in ferritic and low-carbon steels when the phase constitution remains broadly comparable. In ferrite, low carbon and alloy additions leave dislocation glide as a major deformation mechanism, so ferrite grain boundaries exert a visible influence on the onset of yielding. Refining ferrite from coarse grains to fine grains commonly increases yield strength while also reducing the ductile-to-brittle transition temperature. The European Structural Engineering Design Programme reported both effects in structural steels, although the size of each change depends on composition, inclusion content, texture, and processing history.
NIST Special Publication 596 (1996) gives an important distinction for ferritic-pearlitic steels. Yield strength and transition temperature vary approximately with the inverse square root of ferrite grain diameter, while tensile strength is less sensitive to ferrite grain size and elongation is comparatively insensitive. This finding challenges the common assumption that every strength measure should respond equally to refinement. Yielding begins when a sufficient volume of the microstructure can sustain plastic flow; grain boundaries strongly affect that threshold. Ultimate tensile strength is reached later, after substantial dislocation multiplication, strain hardening, necking-related effects, and sometimes local phase transformation have changed the deformation state.
In a low-carbon ferritic steel, a smaller ASTM grain size number does not necessarily mean a proportional hardness increase. ASTM grain size number and micrometre diameter are related only through the stated counting convention and an approximately equiaxed morphology. A banded ferrite-pearlite structure, elongated ferrite, or a mixed grain population can produce similar average intercepts but different slip paths and indentation responses. Grain-boundary density in the loading direction can also differ from the density seen on a polished transverse section.
The distinction matters in quality assessment. In a 2001 study of 4340 steel production heats, NIST associated acceptable heats for Charpy reference specimens with grain sizes of approximately 30–40 micrometres, while unacceptable heats were approximately 60–70 micrometres. That comparison is not a universal strength rule for every 4340 condition; it shows how grain size can reveal a processing difference that affects fracture behavior. A hardness test alone might miss the significance of the coarser structure because hardness also reflects tempering, carbon distribution, and martensitic condition.
Microalloyed steels and precipitation interactions
In microalloyed grades, grain refinement rarely acts alone. Niobium, titanium, and vanadium can form carbonitrides such as Nb(C,N), TiN, and V(C,N). These particles pin austenite grain boundaries during reheating and rolling, restrict recrystallization, and can promote a fine ferrite structure after transformation. Some particles also precipitate within ferrite, where they impede dislocations and add precipitation strengthening.
The measured yield strength is therefore a sum of interacting contributions rather than a grain-size value with a small correction. A useful conceptual expression is:
The terms are not perfectly independent. Processing that produces a fine austenite grain size may also increase transformation dislocation density, alter ferrite–pearlite phase fractions, and change precipitation timing. A normalized low-carbon steel, a thermomechanically controlled processed HSLA steel, and a quenched-and-tempered 4340 steel can have similar measured grain dimensions yet very different yield strengths and hardness values because their phase structures and defect densities differ.
Precipitation can also weaken a simple grain-size interpretation. Coarse TiN particles may pin boundaries effectively but act as fracture initiation sites. Fine Nb(C,N) precipitates may raise strength strongly while leaving the ferrite grain size nearly unchanged. Vanadium precipitation during or after transformation can produce a further increase in hardness that is not evidence of additional refinement. Conversely, overaging coarsens precipitates and reduces their dislocation-blocking effect even when the grain structure remains stable.
ASTM E2627 (2017) addresses average grain size measurement by electron backscatter diffraction in fully recrystallized polycrystalline materials, including grain-size distributions and statistical information. EBSD can separate populations more effectively than a single optical intercept value, but it still requires defensible boundary-angle criteria and phase identification. In a transformed or heavily deformed steel, “grain,” subgrain, packet, block, and prior-austenite grain are not interchangeable structural units.
Why tensile strength does not track grain size identically
| Property | Typical grain-size sensitivity in ferritic-pearlitic steels | Other controlling factors |
|---|---|---|
| Yield strength | Approximately inverse-square-root sensitive | Solute, precipitate, and dislocation strengthening |
| Transition temperature | Approximately inverse-square-root sensitive | Inclusions, texture, notch, and phase constitution |
| Tensile strength | Less consistently sensitive | Work hardening, phase arrangement, and necking |
| Elongation | Relatively insensitive | Strain hardening, damage, geometry, and transformation |
Yield strength measures the stress at which plastic deformation begins; ultimate tensile strength measures the maximum engineering stress during a tensile test. Grain boundaries strongly influence the first event, but tensile strength also depends on strain hardening after yielding. Dislocation storage, solute atmospheres, precipitates, martensite formation, pearlite morphology, bainitic substructure, phase fraction, and crystallographic texture can dominate the later part of the test.
That is why NIST found tensile strength to be less grain-size-sensitive than yield strength in ferritic-pearlitic steels. Refinement may raise yield strength substantially while producing a smaller or inconsistent change in ultimate tensile strength. The difference can be especially large when fine grains reduce the available strain-hardening capacity, or when a transformed product supplies its own strong barriers to dislocation motion.
Ultrafine-grained and metastable steels show why no single trend should be extended without checking the mechanism. Yonsei University reported tensile strengths near 900 MPa and elongations near 40% in a metastable austenitic alloy with grain sizes from 0.3 to 2 micrometres; strain-induced martensitic transformation supplied additional strain hardening. The result was not produced by grain boundaries alone. A 2018 Japan Society of Mechanical Engineers study of low-carbon steel with ultrafine elongated grains reported a transverse grain size of about 1.0 micrometre alongside a favorable balance of strength, ductility, and toughness, but the elongated morphology and processing route were part of that result.
Hall–Petch strengthening also has limits. At very small dimensions, boundary-mediated plasticity, grain rotation, dislocation depletion, and nonuniform deformation can make the classical inverse-square-root relation deviate from experiment. For ordinary ferritic structural steels, however, the practical lesson is straightforward: refinement usually raises yield strength and often raises hardness, while tensile strength must be interpreted through the complete microstructure rather than grain size alone.

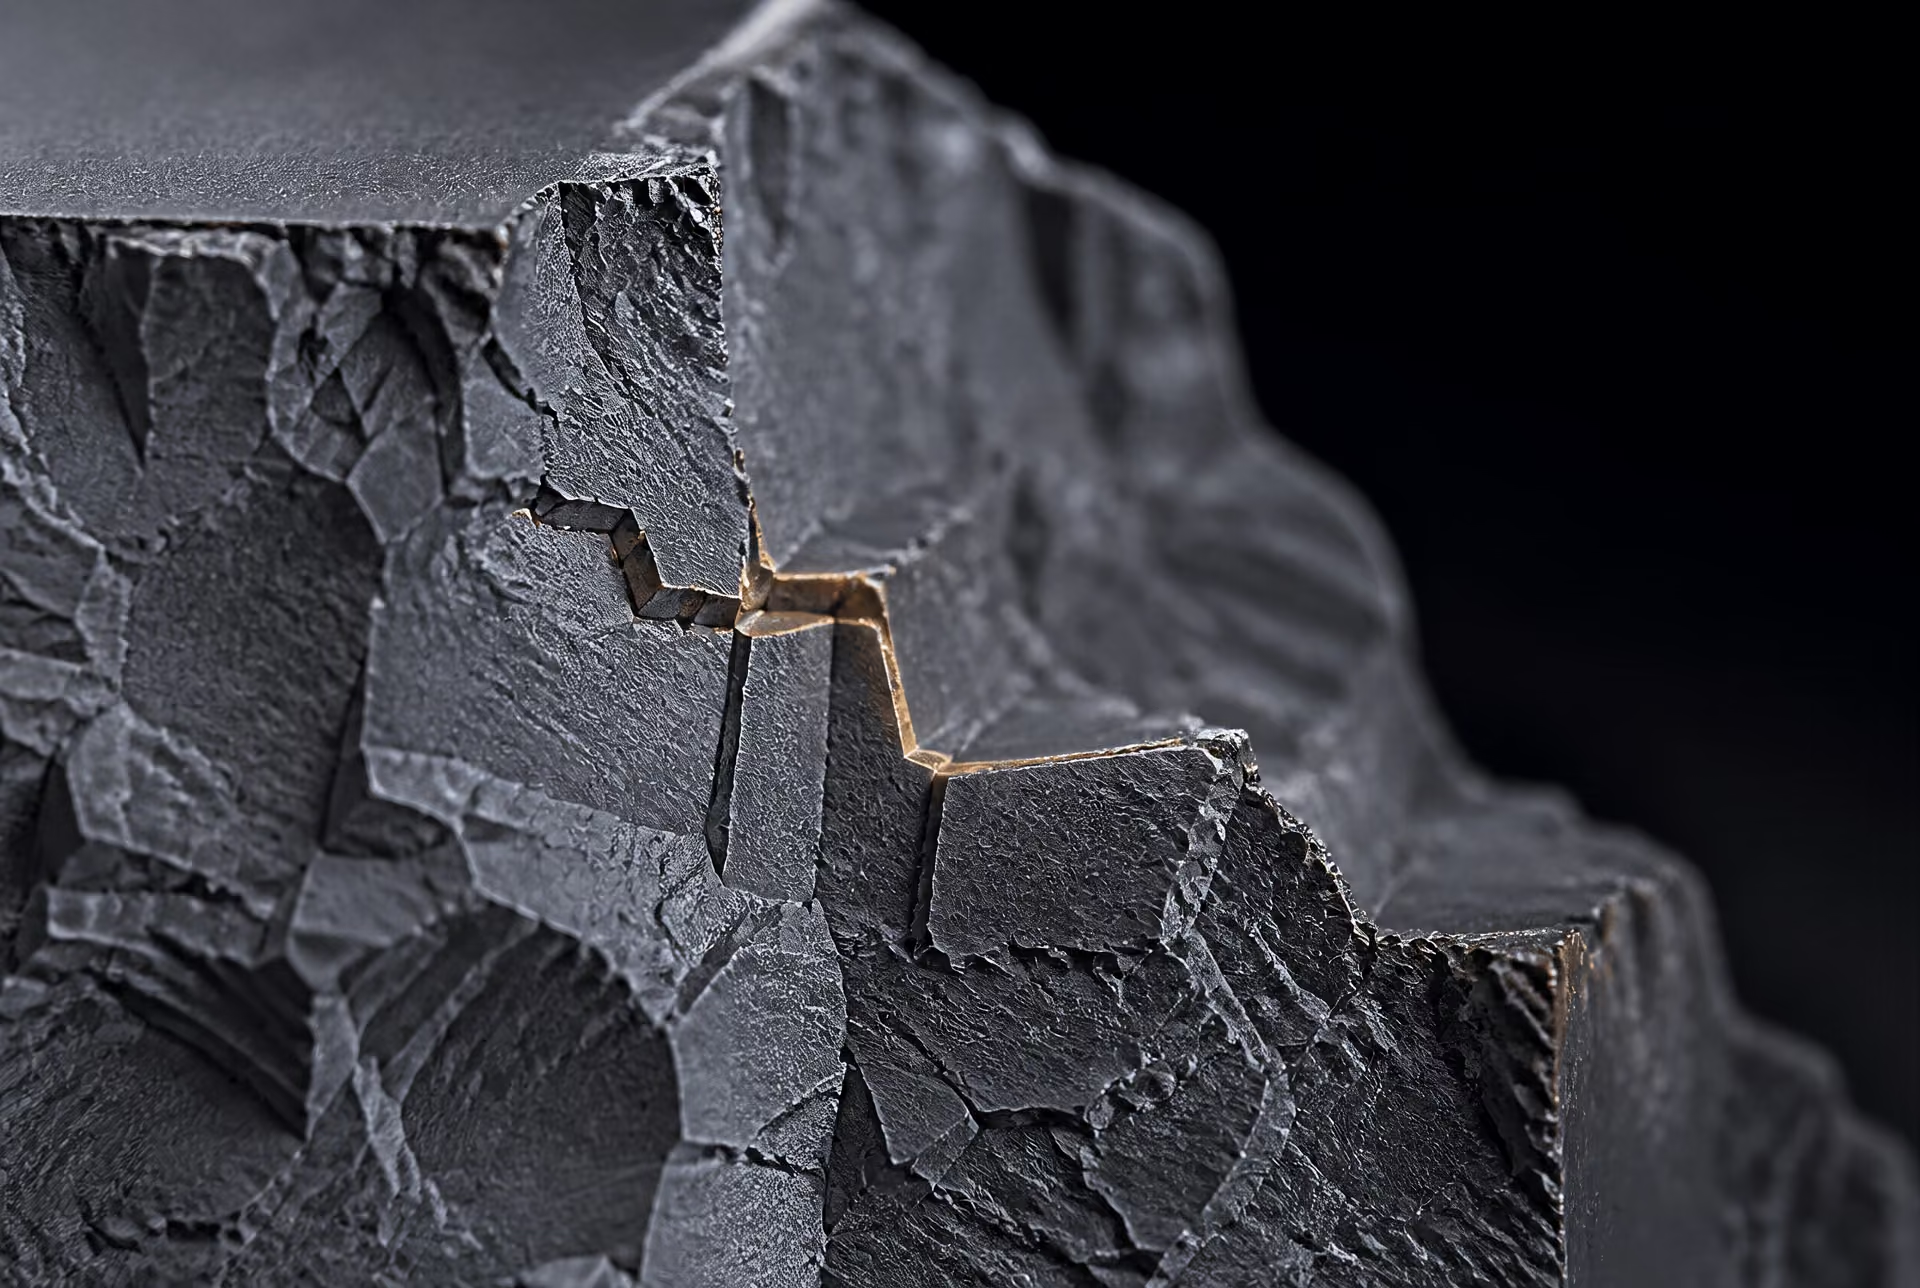
Grain Size, Toughness, and the Ductile-to-Brittle Transition
Cleavage fracture and effective crack paths
Cleavage fracture is a fast, low-plasticity failure mode. In ferritic steel, a crack can advance through a grain when the local tensile stress is sufficient to separate atoms along a favorable crystallographic plane, commonly a member of the {100} family in body-centred cubic ferrite. The crack does not travel through a perfectly straight microscopic channel. It changes direction at grain boundaries, may split into several branches, and can be arrested when the next grain is unfavorably oriented or requires a higher local stress for cleavage.
Grain refinement makes this process more difficult in two related ways. First, a crack crossing a smaller ferrite grain encounters boundaries more frequently. Its uninterrupted cleavage distance is shorter, so the stress concentration at the crack front is repeatedly redistributed. Second, the crack must negotiate a larger number of changes in crystallographic orientation over a given macroscopic distance. The resulting effective crack path is more tortuous than the path through coarse ferrite, and the energy absorbed by crack deflection, branching, and local plasticity increases.
This is not the same as saying that every boundary is an absolute barrier. A favorable sequence of similarly oriented grains can still support cleavage, while a high-angle boundary, a hard second phase, or a local stress concentration can alter the result. Grain shape also matters. Equiaxed ferrite, elongated ferrite, bainitic packets, martensite laths, and mixed ferrite–pearlite structures do not present the same crack-path geometry, even when an average grain diameter appears similar. A measured “grain size” therefore has meaning only alongside the phase being measured, the measurement plane, and the morphology.
The effect is especially important in ferritic steels because their cleavage resistance is strongly temperature-dependent. At low temperature, dislocation motion becomes more difficult and the plastic zone at a notch becomes smaller. Cleavage can then begin before sufficient plastic deformation blunts the crack. Smaller ferrite grains raise the stress required for cleavage initiation and interrupt propagation, shifting failure toward a higher-energy ductile process. This is the metallurgical basis for the familiar observation that grain refinement can improve toughness rather than merely increase strength.
Transition temperature and Charpy behavior
The ductile-to-brittle transition is not a single sharp transformation temperature in an ordinary steel. It is a temperature range in which Charpy V-notch impact energy changes from a low-energy cleavage-dominated shelf to a higher-energy ductile shelf. The reported transition temperature depends on the chosen criterion: a fixed absorbed energy, a fracture appearance percentage, or the midpoint of upper- and lower-shelf behavior can give different values.
For ferritic-pearlitic steels, the grain-size contribution to both yield strength and transition temperature is often represented by an inverse-square-root relationship with ferrite grain diameter. The 1996 NIST Special Publication 596 review states that yield strength and transition temperature commonly vary approximately with the inverse square root of ferrite grain size, whereas tensile strength is less consistently grain-size-sensitive and elongation is comparatively insensitive. Refining ferrite therefore tends to raise the stress needed for plastic yielding while lowering the temperature at which cleavage becomes dominant. The strength increase follows the Hall–Petch framework, with the grain-size term commonly written as proportional to the inverse square root of mean linear intercept.
Charpy behavior, however, is not a direct grain-size test. The notch condition is decisive. A sharp V-notch raises the local triaxial stress and limits the amount of plasticity available before fracture; a damaged, blunt, or incorrectly machined notch can change the measured absorbed energy. Test temperature, striker alignment, specimen dimensions, and support conditions also matter. ASTM E23 governs impact testing of metallic materials, but compliance with the test method does not remove the metallurgical variables within the specimen.
Orientation can change the result substantially. In rolled plate, inclusions, elongated grains, banded pearlite, and segregated regions may align with the rolling direction. A specimen loaded through the thickness can therefore encounter a different population of interfaces and defects from one loaded longitudinally or transversely. The crack may propagate along inclusion strings or segregation bands, producing lower energy than would be expected from an average longitudinal grain-size measurement.
Inclusions provide nucleation sites for voids and can also intensify local stresses ahead of a cleavage front. Sulfur-bearing manganese sulfide inclusions are a familiar example, particularly when they are elongated during rolling. Carbon, manganese, phosphorus, and other solute distributions affect ferrite strength, hardenability, and transition behavior; centerline segregation can create local phase balances unlike those in the surrounding matrix. Pearlite colony size, carbide morphology, bainite, martensite, retained austenite, and welding heat-affected zones can all alter Charpy curves independently of the nominal ferrite grain size.
Phase balance is therefore central. A fine ferrite matrix containing a continuous brittle constituent is not equivalent to uniformly refined ferrite–pearlite steel. A quenched-and-tempered 4340 steel, for example, is governed by tempered martensite morphology, prior-austenite grain size, carbide distribution, and heat-treatment condition rather than by a simple ferrite diameter. A coarse prior-austenite structure can support long effective fracture paths through packets or regions with related crystallographic orientation, even when the final microstructure appears finely subdivided.
The NIST 2001 assessment of production 4340 steel used for Charpy reference specimens shows why grain size is useful as a quality-assessment clue but not a complete explanation. Heats judged acceptable for the reference material had grain sizes of approximately 30–40 micrometres, while unacceptable heats were approximately 60–70 micrometres. That separation is metallurgically meaningful: the coarser heats had a microstructure more favorable to cleavage and lower impact suitability. Yet the study did not establish grain size as the sole cause of the difference. Chemistry, cleanliness, segregation, austenitizing history, tempering, and other microstructural features can travel with heat-to-heat variation.
Measurement itself can obscure these distinctions. ASTM E112, revised in 2024, specifies comparison, planimetric, and intercept procedures for average planar grain size; the ASTM grain size number is derived from grain counts per unit area or grain-boundary intercepts. An ASTM grain size number should not be converted casually into a micrometre value without stating the method and assumptions. ASTM E2627, published in 2017, addresses electron backscatter diffraction measurement in fully recrystallized polycrystalline materials and can provide average size, distributions, and statistical information. EBSD may separate phases and reveal orientation relationships that a polished optical image cannot, but it still requires sensible boundary misorientation criteria and representative sampling.
Why refinement can improve strength and toughness together
Strength and toughness are often presented as competing properties because many strengthening methods increase barriers to dislocation motion while also reducing the plasticity available at a crack tip. Grain refinement is unusual: it can raise yield strength and improve resistance to cleavage at the same time. Each boundary impedes dislocation slip, producing the Hall–Petch increase in yield strength; the same population of boundaries interrupts a cleavage crack. The two effects operate through different local mechanisms but benefit from the same reduction in characteristic length.
The benefit has limits. Hall–Petch behavior is an approximation, not a law valid at every scale or in every phase. At very small dimensions, dislocation storage, boundary-mediated deformation, texture, segregation, and phase stability can change the slope or invalidate a conventional grain-size correlation. In multiphase steels, the controlling length may be a martensite packet, bainite block, pearlite colony, lath, or inclusion spacing rather than the ferrite grain diameter. Excessive refinement can also introduce high boundary area, residual stress, or unstable phases if the processing route is poorly controlled.
Some ultrafine-grained results show why grain size must be read with the deformation mechanism. A 2014 Yonsei University study of a metastable austenitic alloy with grain sizes from 0.3 to 2 micrometres reported tensile strengths near 900 MPa and elongations near 40%. Strain-induced martensitic transformation supplied additional strain hardening, so the ductility was not produced by refinement alone. Likewise, a 2018 Japan Society of Mechanical Engineers study of low-carbon steel with ultrafine elongated grains reported its best balance of strength, ductility, and toughness at a transverse grain size of about 1.0 micrometre. The elongated morphology and loading direction were part of that result.
For conventional ferritic steels, the practical objective is not the smallest measurable grain. It is a controlled distribution of ferrite, pearlite or other constituents, with low harmful inclusion content, limited segregation, suitable texture, and a crack path that requires substantial plastic work. Refinement usually lowers the transition temperature, but the measured Charpy curve records the entire processing history. Grain size is one of its strongest clues—not the whole diagnosis.
Effects on Ductility, Uniform Elongation, and Fracture Strain
Why conventional elongation may be relatively insensitive
Grain refinement raises yield strength more reliably than it raises tensile ductility. That distinction is central to interpreting tensile data. The classical Hall–Petch relation assigns a grain-size contribution to strength that varies approximately with the inverse square root of mean linear intercept: as the ferrite grain dimension decreases, grain boundaries provide more barriers to dislocation motion. Yield strength therefore tends to increase. Elongation does not follow the same simple law.
The National Institute of Standards and Technology made this distinction in NIST Special Publication 596 (1996), describing ferritic-pearlitic steels in which yield strength and ductile-to-brittle transition temperature vary approximately with the inverse square root of ferrite grain diameter, while tensile strength is less sensitive and elongation is relatively insensitive to ferrite grain size. This observation applies to the particular ferritic-pearlitic context examined, not to every steel microstructure or every definition of ductility. It does, however, reject the common assumption that a smaller ASTM grain-size number—or a smaller measured grain diameter—must produce a proportional loss or gain in percentage elongation.
Several measurements are being mixed when “ductility” is reported. Uniform elongation is the plastic strain accumulated before the onset of diffuse necking. Total elongation includes the localized neck and therefore depends on gauge length, cross-section, surface condition, extensometer method, and the final fracture process. Fracture strain is a local measure of plastic deformation at failure and is strongly affected by stress triaxiality in the neck. These quantities can respond differently to the same refinement treatment.
Grain size matters indirectly because it changes the stress required for slip and can alter the sequence of plastic deformation, but the tensile result also depends on strain hardening, void nucleation, damage growth, phase transformation, crystallographic texture, inclusion content, and specimen geometry. In ferritic-pearlitic steel, for example, pearlite colony size, lamellar spacing, ferrite–pearlite strength contrast, and inclusion distribution may control damage before the average ferrite grain size does. A refined ferrite matrix can raise the yield strength without materially changing the strain available before necking if its strain-hardening response changes little.
Measurement adds another limitation. ASTM E112 (2024) permits comparison, planimetric, and intercept procedures for average planar grain size; its ASTM grain size number is calculated from grain counts per unit area or grain-boundary intercepts. Those methods describe a statistical population, not a single visible feature. A value measured on equiaxed ferrite cannot be treated as interchangeable with a value measured on elongated bainite, transformed austenite, or a mixed-phase structure. If the phase measured, section orientation, and method are omitted, an apparent grain-size/elongation relationship may be an artefact of incompatible measurements.
The same caution applies to quality assessment. In a 2001 NIST assessment of 4340 steel used for Charpy reference specimens, acceptable heats had grain sizes of approximately 30–40 micrometres, whereas unacceptable heats were approximately 60–70 micrometres. That comparison shows that coarse grains can signal an undesirable processing history and can degrade impact performance, especially through transition-temperature behavior. It does not establish that percentage elongation changes in direct proportion to the measured grain diameter.
Strain hardening and deformation compatibility
Uniform elongation is governed primarily by whether the material can continue hardening as plastic strain rises. In its simplest form, diffuse necking begins when the rate of increase in flow stress with plastic strain can no longer balance the increase in true stress caused by reduction of area. A finer grain size raises the initial flow stress, but uniform elongation depends on the subsequent hardening curve. Strength at yield and strain capacity are related, not identical.
This is why deformation compatibility across grains and phases matters. Neighboring grains have different orientations and different resolved shear stresses, so plastic strain is not distributed perfectly evenly. Grain boundaries constrain slip transfer and create local stress concentrations. Refinement shortens the distance over which incompatible deformation can accumulate, which may reduce certain local strain concentrations. Yet the outcome depends on texture, boundary character, second phases, and the distribution of harder and softer regions. A ferrite grain surrounded by pearlite does not deform in the same way as a ferrite grain in a nearly single-phase alloy.
Damage provides a second route to failure. Inclusions, carbide clusters, pearlite colonies, and phase interfaces can nucleate microscopic voids. Plastic strain then enlarges and links those voids, with the rate controlled by local stress triaxiality and the surrounding deformation field. Finer grains may impede some crack or void growth processes, but they do not remove the nucleation sites. A steel with a fine ferrite grain size and a poor inclusion population can therefore show lower fracture strain than a coarser, cleaner steel.
Texture also changes the result. Processing can produce elongated grains and preferred crystallographic orientations, so the response in the rolling, transverse, and thickness directions may differ even when the reported mean grain size is the same. The Japan Society of Mechanical Engineers study (2018) on low-carbon steel with ultrafine elongated grains reported a transverse grain size of about 1.0 micrometre for the best balance among strength, ductility, and toughness in that investigation. The important variable was not merely a small number in micrometres; morphology, directionality, and the associated processing history were part of the microstructure.
Fracture strain is especially sensitive to specimen geometry. Smooth tensile bars, notched specimens, and plane-strain configurations impose different triaxiality. A smooth specimen may accumulate substantial plastic strain in a neck before void coalescence, whereas a notch can accelerate damage at a much lower overall elongation. Grain refinement may improve resistance to cleavage and lower the ductile-to-brittle transition temperature, as reported by the European Structural Engineering Design Programme in 2000, while producing only a modest change in smooth-bar elongation. Toughness and tensile elongation should not be substituted for one another.
The ultrafine-grained exception[6] Effect of grain size on the uniform ductility of a bulk ultrafine-grained metastable austenitic alloy. Yonsei University researchers. Yonsei University research publication, 2014.
Ultrafine-grained metastable austenitic steels show why the conventional ferritic-pearlitic observation cannot be generalized. A Yonsei University study published in 2014 examined a metastable-austenitic alloy with grain sizes from 0.3 to 2 micrometres. It reported tensile strengths near 900 MPa together with elongations near 40% when strain-induced martensitic transformation enhanced strain hardening. Those values are not explained by Hall–Petch strengthening alone.
During deformation, austenite progressively transforms to martensite. The transformation raises the flow stress as strain increases and can sustain a high hardening rate over part of the tensile test. This delays diffuse necking, allowing substantial uniform elongation despite the high yield and tensile strength associated with the refined structure. The newly formed martensite also changes the local phase contrast and the way strain is partitioned, so the final fracture strain depends on transformation kinetics, austenite stability, texture, and damage evolution as well as grain size.
Grain refinement can alter that transformation behavior. Smaller austenite grains may be more stable against transformation because grain boundaries affect nucleation and mechanical driving forces; the exact response depends on composition and thermal history. Consequently, two specimens with similar mean grain dimensions may show different uniform elongations if their retained-austenite stability or phase fraction differs.
The lesson is specific: ultrafine grains can accompany high strength and high ductility when a transformation mechanism supplies additional strain hardening. Without that mechanism, simply reducing grain size may raise yield strength while leaving uniform elongation nearly unchanged or even reducing it. ASTM E2627 (2017) addresses electron-backscatter-diffraction measurement of average grain size, distributions, and statistical information in fully recrystallized polycrystalline materials, but a grain-size distribution alone cannot identify whether transformation-induced plasticity, slip partitioning, or void growth controls failure. Mechanical interpretation must follow the measured morphology and phase constitution, not precede them.
How Steel Processing Changes Grain Size
Steel grain size is not fixed at casting. It changes as liquid steel freezes, as the solid is deformed, and as phases transform during heating and cooling. The “grain” seen in a micrograph may refer to austenite, ferrite, bainite packets, martensite packets, or crystallographic regions identified by electron backscatter diffraction (EBSD). These are not interchangeable measurements.
ASTM E112, revised in 2024, defines comparison, planimetric, and intercept procedures for measuring average planar grain size. Its ASTM grain size number is calculated from grain counts per unit area or grain-boundary intercepts, not assigned from a single visible crystal. Grain shape matters as much as average size: elongated grains, duplex structures, banding, and mixed grain populations can give the same average value while producing different mechanical responses.
Solidification and columnar grain formation
During casting, steel changes from liquid to solid through nucleation and growth. Small solid crystals first form when the liquid reaches sufficient undercooling or when inclusions and mould surfaces provide sites for heterogeneous nucleation. Each nucleus has a crystallographic orientation. Once formed, it grows by incorporating iron and alloy atoms from the liquid at the solid–liquid interface.
The temperature gradient controls the resulting morphology. At the mould wall, rapid heat extraction produces a fine chill zone. Farther inward, grains whose growth direction is favourably aligned with the heat flow advance more rapidly than competing grains. These grains become long, narrow columnar grains extending toward the centre of an ingot, slab, or continuously cast strand. Near the centre, where thermal gradients weaken and the liquid may undercool, equiaxed grains can form instead. The final casting may therefore contain a chill layer, a columnar zone, and a central equiaxed zone.
Columnar grains can create directional properties and provide long paths for segregation. Solute elements rejected ahead of the advancing solid front concentrate in the remaining liquid, producing chemical banding or interdendritic segregation. Manganese, carbon, phosphorus, sulfur, and alloying additions may therefore be distributed unevenly even before rolling begins. Dendrite arm spacing also records local cooling conditions, although it is not identical to final grain size.
Large columnar grains are not automatically retained. Reheating, forging, and rolling can break their continuity, introduce dislocations, and generate new grains. Yet insufficient deformation may leave remnants of the cast structure, while reheating can cause prior-austenite grains to grow around them. Solidification history remains visible in texture, segregation, and inclusion alignment long after the original liquid has disappeared.
Hot working, recrystallization, and grain growth
Rolling and forging alter grain size through both deformation and temperature. Plastic deformation elongates existing grains, increases dislocation density, and stores strain energy. At a suitable temperature, that stored energy drives recrystallization: new, relatively strain-free grains nucleate and grow within the deformed structure.
Nucleation often begins at prior grain boundaries, shear bands, or regions with unusually high dislocation density. Growth occurs when the boundary of a new grain migrates into material of higher stored energy. Greater deformation generally supplies more nucleation sites, so the recrystallized structure can become finer. Lower deformation, uneven strain, or an unsuitable finishing temperature can produce incomplete recrystallization and a mixture of coarse and fine grains.
Dynamic recrystallization occurs during deformation when recovery and new-grain formation proceed at the working temperature. Static recrystallization occurs after the load is removed, while the steel remains hot. Controlled rolling exploits these differences. Deformation in the non-recrystallization region of austenite panc action? Need no typo. "austenite non-recrystallization region" flattens and subdivides austenite grains, increasing sites for ferrite nucleation during cooling. In microalloyed grades, niobium, titanium, or vanadium compounds restrict austenite boundary movement and delay recrystallization. Titanium nitride (TiN), niobium carbonitride (Nb(C,N)), and vanadium carbonitride (V(C,N)) particles can pin boundaries by exerting a drag force. Fine, well-dispersed particles pin more effectively than coarse particles.
Particle pinning has limits. Particles may dissolve at high temperature, removing the restraint just when grain growth is fastest. Coarsened particles also provide less pinning per unit volume. If hot steel is held too long or at too high a temperature, boundary migration reduces total boundary area and grains coarsen. The result can be a coarse austenitic structure even when the earlier rolling schedule produced substantial refinement.
The Hall–Petch relation explains why refinement often raises yield strength: the grain-size contribution is approximately proportional to the inverse square root of mean linear intercept, as described by the University of Cambridge in 2005. Boundaries impede dislocation motion. This relation is not an unlimited rule. At ultrafine sizes, boundary-mediated deformation, texture, solute segregation, recovery, and phase transformation can change the slope or invalidate a simple extrapolation. In a metastable austenitic alloy studied by Yonsei University in 2014, grains measuring 0.3–2 micrometres were associated with tensile strengths near 900 MPa and elongations near 40%, partly because strain-induced martensite supplied additional strain hardening. Grain size alone did not produce that combination.
The final structure may also be anisotropic. A 2018 study reported a transverse grain size of about 1.0 micrometre in low-carbon steel with ultrafine elongated grains and found a favourable balance among strength, ductility, and toughness under its stated processing conditions. An intercept measured across elongated grains will not equal an intercept measured along them.
Normalizing, austenitizing, quenching, and tempering
Heat treatment changes grain size by controlling phase stability, boundary mobility, and transformation kinetics. Normalizing heats steel above the critical temperature so that it becomes austenitic, then cools it in still air. Austenite forms with a size set by the prior deformation structure, nucleation sites, heating rate, peak temperature, and holding time. On cooling, ferrite and pearlite nucleate at austenite boundaries and within the austenite. Normalizing can therefore replace a coarse, irregular as-cast structure with a more uniform ferritic-pearlitic structure, but excessive temperature or holding can produce coarse prior-austenite grains and coarse transformation products.
Austenitizing temperature is especially important. Heating just above the critical range may produce many austenite nuclei from ferrite–pearlite interfaces and undissolved carbides. Heating much farther above that range increases boundary mobility and dissolves more carbides, allowing grains to grow. Longer holding has a similar effect. A steel austenitized at 950 °C for a short period and the same steel held at 1,100 °C can have markedly different prior-austenite grain sizes, even if both are later quenched.
Quenching suppresses diffusional ferrite and pearlite formation and may produce martensite. The martensite does not simply reproduce the prior-austenite grain as one large grain. It forms as packets, blocks, and laths within each prior-austenite grain. These packets have crystallographic relationships with the parent austenite and contain lath boundaries with different misorientations. Consequently, a coarse prior-austenite grain can contain a much finer lath or packet scale, while a fine prior-austenite grain generally limits the maximum packet size. Fracture may respond more strongly to effective packet or block size than to the original austenite diameter.
Intermediate cooling rates can produce bainite, whose sheaves and packets create another structural scale. Ferrite transformation creates yet another scale, governed by nucleation at austenite boundaries, inclusions, deformation bands, and precipitates. Thus, “austenite grain refinement” is not a synonym for “fine final grain size”; it changes the sites and distances available during transformation, but cooling rate and composition determine what forms afterward.
Tempering reheats quenched martensite below the eutectoid transformation temperature. Carbon leaves supersaturated martensite, carbides precipitate and coarsen, stresses relax, and lath boundaries may recover. Tempering usually changes hardness and toughness more than it changes the prior-austenite grain size. At high tempering temperatures or prolonged times, however, carbide coarsening and substructure recovery reduce boundary strengthening.
NIST reported in 2001 that acceptable 4340 steel heats used for Charpy reference specimens had grain sizes of approximately 30–40 micrometres, whereas unacceptable heats measured about 60–70 micrometres. That comparison shows why processing records and microscopy belong together. ASTM E2627, issued in 2017, specifies EBSD-based determination of average grain size, distributions, and statistical information in fully recrystallized polycrystalline materials. For transformed steel, the report must state whether it measured prior-austenite grains, ferrite grains, packets, blocks, or laths, and which method defined the boundaries. Without that information, an ASTM grain size number or a micrometre value can conceal the actual processing history.
Grain Morphology, Directionality, and Anisotropy
Equiaxed versus elongated grains
Grain size is not a complete description of grain structure. It is a statistical result obtained from a specified section, phase, and measurement procedure. ASTM E112:2024 permits comparison, planimetric, and intercept methods; its ASTM grain size number comes from grain counts per unit area or grain-boundary intercepts. Those methods describe an average planar scale, but they do not by themselves state whether grains are roughly equiaxed, flattened, columnar, or elongated along a processing direction.
That distinction matters because two steels can have the same nominal mean grain size and respond differently under load. In an equiaxed ferritic structure, a test line drawn in any direction encounters a broadly similar distribution of boundary spacings. An elongated structure produces different intercept lengths depending on line orientation. A line parallel to the long axis may cross relatively few boundaries and record a large mean intercept; a perpendicular line may cross many boundaries and record a much smaller one. Reporting only one average can conceal this difference.
The Hall–Petch relation is often written as a grain-size contribution to strength proportional to , where is commonly represented by mean linear intercept. Grain boundaries obstruct dislocation motion, so a smaller effective intercept usually raises yield strength. The word effective is important. Boundary character, crystallographic orientation, second phases, precipitates, and the active slip or fracture mechanism also control the response. Hall–Petch behavior is therefore a useful trend, not a complete constitutive law.
The low-carbon steel study published by the Japan Society of Mechanical Engineers in 2018 illustrates the measurement issue. Its ultrafine elongated-grain structure had a transverse grain size of approximately 1.0 micrometre, and that transverse value was associated with the reported balance of strength, ductility, and toughness. The number is meaningful because the study identified the direction in which it was measured. Calling the structure simply “1.0 micrometre grain size” would discard information about its elongated morphology.
Ultrafine grains can also interact with phase transformation rather than merely block slip. Yonsei University researchers reported, in 2014, tensile strengths near 900 MPa and elongations near 40% in a metastable-austenitic alloy with grain sizes from 0.3 to 2 micrometres. Strain-induced martensitic transformation supplied additional strain hardening. That result cannot be transferred directly to ferritic-pearlitic steel, where a similar numerical grain size may produce a different balance of strength, ductility, and toughness.
Rolling direction, transverse direction, and through-thickness effects
| Direction | Meaning | Measurement implication |
|---|---|---|
| RD | Principal rolling or material-flow direction | May show long intercepts through elongated grains |
| TD | Direction across the plate in its plane | Often shows shorter intercepts across elongated grains |
| ND | Through-thickness or normal direction | Can reveal surface-to-centre gradients and segregation effects |
For rolled plate, the rolling direction (RD) follows the principal material flow, the transverse direction (TD) lies across the plate in its plane, and the through-thickness direction (ND, or normal direction) is perpendicular to the rolling plane. Hot and cold reduction can flatten grains, stretch inclusions and segregation features, and produce crystallographic texture. Recrystallization, recovery, phase transformation, and subsequent heat treatment can lessen or preserve these effects.
A grain-size measurement should therefore state both the section and the test-line orientation. Intercepts measured parallel and perpendicular to RD can differ substantially in a rolled or forged product. Through-thickness sections can show another result because deformation and cooling are not uniform from the surface to the centre. Surface layers may recrystallize differently from the mid-thickness region, while centreline segregation can alter phase constitution and transformation products.
The mechanical consequence is anisotropy. Yield strength, uniform elongation, bend performance, and Charpy impact energy may differ between RD, TD, and ND specimens. Fracture can follow a directionally easier path: elongated ferrite grains, aligned inclusions, weak interfaces, or pearlite colonies may guide microvoid coalescence or cleavage. A crack crossing many high-angle boundaries can be deflected or blunted; a crack travelling along aligned constituents may advance with less deviation. Grain refinement generally lowers the ductile-to-brittle transition temperature, but the amount depends on crack-tip plasticity, texture, inclusion alignment, and the phase being fractured.
NIST Special Publication 596 (1996) reported that, in ferritic-pearlitic steels, yield strength and transition temperature vary approximately with the inverse square root of ferrite grain diameter. Tensile strength is less consistently grain-size-sensitive, while elongation is comparatively insensitive. This is why a smaller measured grain size does not guarantee proportional improvement in every tensile property. The European Structural Engineering Design Programme likewise described grain refinement as increasing yield strength and substantially lowering transition temperature, but those gains still depend on direction and fracture mechanism.
The same caution applies to ASTM grain size numbers. An ASTM number cannot be converted to a micrometre value without stating whether the value came from comparison, planimetric counting, or intercept measurement, and without identifying the phase and section examined. A reported average for RD–TD surface material is not automatically equivalent to a value measured on an ND section.
Banding, texture, and local grain-size variation
Banding adds a second source of hidden variation. During solidification, alloying elements such as manganese and carbon can segregate. Rolling and transformation then arrange compositionally distinct regions into bands, often producing alternating ferrite, pearlite, bainite, or martensite-rich layers parallel to the rolling direction. Each band may contain grains of similar apparent size while differing in hardness, phase fraction, carbon content, or boundary resistance. A single field of view can consequently give a misleading average.
Texture produces another form of directionality. Grains may not be elongated, yet their crystallographic orientations can be aligned by rolling, drawing, or transformation. Slip then activates more readily in some loading directions than others. EBSD can separate grain shape from orientation information, identify misorientation boundaries, and show whether a nominally fine structure contains a strong preferred orientation. ASTM E2627:2017 covers EBSD-based determination of average grain size in fully recrystallized polycrystalline materials, including grain-size distributions and statistical information; it does not make texture irrelevant, nor does it replace examination of partially transformed or heavily deformed regions without suitable interpretation.
Local variation is often more important than the plant-wide average. A plate may contain fine surface grains, coarser centre grains, and segregation bands near the centreline. A bar can show a worked outer zone around a less-deformed core. A weld contains fusion-zone grains, a coarse-grained heat-affected zone, a fine-grained heat-affected zone, and unaffected base metal, each with a different thermal history. Measuring only the parent plate can miss the region where a crack initiates.
NIST’s 2001 assessment of 4340 steel illustrates why spatial sampling has quality-assurance value: acceptable heats for Charpy reference specimens showed grain sizes of approximately 30–40 micrometres, whereas unacceptable heats were approximately 60–70 micrometres. Those figures are useful only with their stated method and material context. A defensible report should give the location, phase, section plane, RD or TD line orientation, distribution—not just the mean—and the presence of banding or texture. Grain morphology is part of the measurement, not a decorative detail.
Ultrafine-Grained and Nanostructured Steel: Benefits and Limits
What changes below the conventional grain-size range
An approximately 1.0 micrometre transverse grain size produced the best reported balance among strength, ductility, and toughness in that study. Preliminary evidence
“Ultrafine-grained” is not a universal micrometre cutoff. The designation depends on the study, the phase being measured, and the method used to calculate grain size. In the Yonsei University study published in 2014, bulk ultrafine-grained metastable austenitic steel contained grains from 0.3 to 2 micrometres. A Japan Society of Mechanical Engineers study published in 2018 examined low-carbon steel with ultrafine elongated grains and reported a transverse grain size of about 1.0 micrometre. Those are useful technical examples, not a definition that can be applied to every steel.
“Nanostructured” generally describes structural units below 1 micrometre, often below 100 nanometres, but the measured unit may be a ferrite grain, martensite packet, crystallite, subgrain, or cell. These are not interchangeable. A transmission-electron-microscopy image may show nanoscale crystallites inside a larger prior-austenite grain, while an electron backscatter diffraction (EBSD) map may report a different size after applying a boundary-misorientation criterion. Grain-size claims without the measured phase, boundary definition, section orientation, and statistical method can therefore give a false impression of precision.
ASTM E112, revised in 2024, provides comparison, planimetric, and intercept procedures for determining average planar grain size. Its ASTM grain size number is derived from grain counts per unit area or grain-boundary intercepts; it is not a direct micrometre label. ASTM E2627, published in 2017, covers EBSD determination of average grain size in fully recrystallized polycrystalline materials, including grain-size distributions and statistical information. EBSD is especially useful when a steel contains elongated grains, deformation bands, or several distinguishable populations, although its result still depends on scan step size and the rules used to identify a boundary.
At submicrometre dimensions, the proportion of atoms associated with interfaces rises sharply. Grain boundaries occupy more volume, and their character becomes important: high-angle boundaries can block slip, while low-angle boundaries may accommodate dislocation rearrangement without acting as equally strong barriers. Solute atoms, carbides, oxides, vacancies, and segregated impurities can collect at these interfaces. The boundary network may then strengthen the steel, assist diffusion, or become a preferred path for cracking and recovery. Grain morphology also matters. One micrometre equiaxed grains do not deform like one micrometre elongated grains aligned with the rolling direction.
Strengthening, strain hardening, and stability
The classical Hall–Petch relation expresses the grain-size contribution to strength as approximately proportional to the inverse square root of mean linear intercept, as described by the University of Cambridge in 2005:
Here, is a measured grain dimension, represents other resistance to plastic flow, and is a material- and condition-dependent coefficient. Boundaries interrupt dislocation motion, so reducing ferrite grain size commonly raises yield strength. The National Institute of Standards and Technology (NIST) Special Publication 596, issued in 1996, reports that in ferritic-pearlitic steels, yield strength and ductile-to-brittle transition temperature vary approximately with the inverse square root of ferrite grain diameter. The European Structural Engineering Design Programme similarly reports that refinement raises yield strength and substantially lowers the ductile-to-brittle transition temperature.
The effect on tensile strength is less consistent, and elongation is comparatively insensitive to grain size in ordinary ferritic-pearlitic steels. That distinction matters. A smaller ferrite grain may increase the stress needed to start plastic flow without producing a matching increase in uniform elongation. Pearlite spacing, cementite morphology, dislocation density, texture, inclusions, and the presence of bainite or martensite can dominate the tensile response.
Ultrafine grains can also change how strain is distributed. With many closely spaced boundaries, dislocations have short travel distances and may pile up less effectively than in coarse grains. Plasticity can involve grain-boundary sliding, boundary migration, dislocation absorption, emission from interfaces, and rotation of grain fragments. These processes may support additional deformation, but they can also reduce conventional dislocation storage. Lower dislocation storage means weaker strain hardening in some ultrafine-grained ferritic steels, which can cause early necking even when yield strength is high.
Metastable-austenite transformation can combine ultrafine grains with tensile strength near 900 MPa and elongation near 40%. Limited evidence
The 2014 Yonsei University result shows why grain size cannot be judged apart from phase constitution. In a metastable austenitic alloy containing 0.3–2 micrometre grains, tensile strengths near 900 MPa and elongations near 40% were reported. The unusually favorable combination arose because deformation induced martensitic transformation, adding strain hardening as austenite transformed during tensile loading. The result is exceptional because the transformation mechanism supplied hardening that a stable ferritic structure would not provide. It should not be used to predict the behavior of a conventional ferritic-pearlitic steel with the same nominal grain size.
Stability is another limit. Ultrafine structures contain large amounts of stored energy and boundary area, creating a thermodynamic driving force for grain growth. Heating can cause recovery, boundary migration, recrystallization, carbide coarsening, or phase transformation. The result may be a rapid loss of the strength obtained during severe plastic deformation, rapid solidification, or thermomechanical processing. Solute segregation and fine precipitates can pin boundaries, but impurities may also embrittle them. Weld thermal cycles are particularly important: the heat-affected zone can experience grain growth and phase changes even when the parent steel retains its ultrafine structure.
The 2018 Japan Society of Mechanical Engineers study found that a transverse grain size of approximately 1.0 micrometre gave the reported balance among strength, ductility, and toughness in its low-carbon steel with ultrafine elongated grains. That finding reinforces a practical point: the finest measured value is not automatically the most useful structure. Orientation, aspect ratio, texture, phase distribution, and local strain concentration all enter the result.
When Hall–Petch extrapolation becomes unsafe
Hall–Petch behavior is an empirical trend over a defined microstructural range, not a law permitting unlimited extrapolation toward zero grain size. At sufficiently small dimensions, the assumptions behind the usual relation become unreliable. A grain may contain too few dislocations for a conventional pile-up to form, and plastic flow may instead proceed through interface-mediated mechanisms. Grain-boundary sliding, rotation, diffusion, stress-assisted boundary migration, and interface-mediated dislocation emission can alter or even reverse the expected slope. Reported “inverse Hall–Petch” behavior is not a universal property of nanostructured steel; it depends on purity, boundary character, temperature, strain rate, texture, and the stability of the structure.
A second danger is treating a statistical average as the controlling defect size. Fracture may initiate at the largest grain, a carbide stringer, a nonmetallic inclusion, a weak boundary, or a martensite–ferrite interface rather than at the mean grain. An ultrafine matrix can therefore coexist with coarse local regions that control toughness or fatigue. The same issue appears in quality assessment. NIST reported in 2001 that acceptable 4340 steel heats used for Charpy reference specimens had grain sizes of approximately 30–40 micrometres, whereas unacceptable heats measured approximately 60–70 micrometres. The measurement helped identify processing quality, but it did not establish a universal acceptable size for every 4340 steel product or fracture condition.
Very fine grains do not guarantee superior ductility, toughness, weldability, or service stability. They can lower the transition temperature in ferritic steels, yet cleavage resistance may still be limited by inclusions, segregation, texture, or brittle constituent networks. They can raise yield strength while reducing strain-hardening capacity. They can improve a laboratory tensile result while coarsening during welding or service exposure. A meaningful comparison therefore requires the phase constitution, grain morphology, measurement standard, thermal history, and fracture mechanism—not merely a smaller number in micrometres.
Grain Size in Welds and Heat-Affected Zones
A welded joint does not have one grain size. It contains a fusion zone formed from molten metal, a heat-affected zone (HAZ) that never melted but experienced one or more thermal cycles, and unaffected parent material. Each region may contain several phases and several meaningful length scales. A parent plate reported as ASTM grain size number 8, for example, says little about the prior-austenite grain size in its coarse-grained HAZ or the packet size in a transformed weld metal.
The measurement problem is central. ASTM E112 (2024) specifies comparison, planimetric, and intercept procedures for average planar grain size; its ASTM grain size number is calculated from grain counts per unit area or grain-boundary intercepts. Those procedures do not automatically identify phase, morphology, or transformation units. A ferrite grain, a prior-austenite grain, a bainitic packet, and a martensite block can all produce different boundaries in the same section.

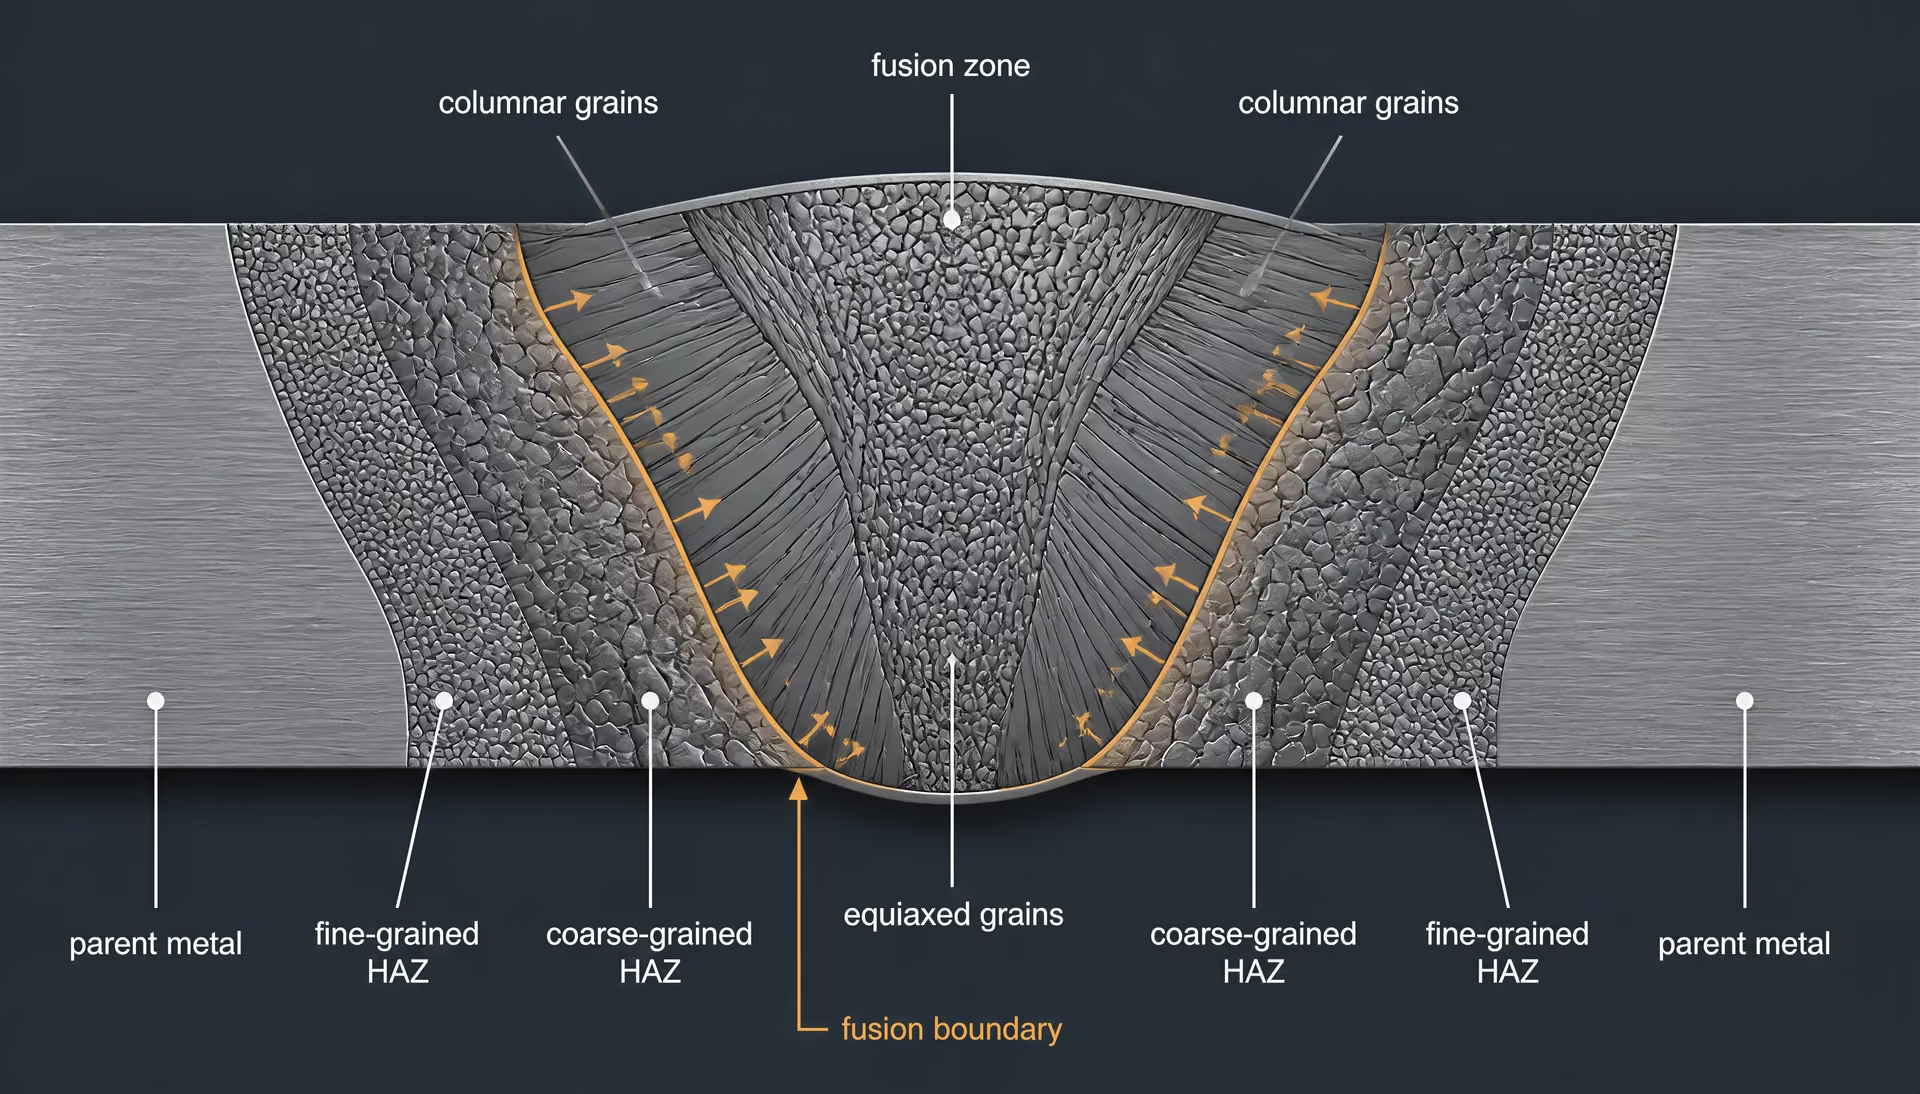
Fusion-zone solidification structures
The fusion zone begins as liquid weld metal and solidifies against the unmelted joint edge. Near the fusion boundary, existing austenite or ferrite grains can provide epitaxial nucleation sites. Grains then grow away from the boundary along the direction of the maximum thermal gradient, commonly producing columnar dendritic or cellular structures. In the weld-centre region, where competing growth fronts meet, equiaxed grains may form if the undercooling and inoculation conditions allow enough independent nuclei.
This structure is not governed by cooling rate alone. Welding current, travel speed, heat input, joint restraint, plate thickness, arc efficiency, and interpass temperature alter the liquid-pool shape and the local thermal gradient. A steep gradient promotes directional growth; a lower gradient combined with greater undercooling favours more equiaxed solidification. Alloy chemistry changes both the solidification interval and the partitioning of carbon, manganese, silicon, chromium, nickel, molybdenum, niobium, titanium, and other elements. Microsegregation can leave solute-rich interdendritic regions that transform differently from dendrite cores.
The visible primary solidification grains are therefore not necessarily the final ferrite grains. On cooling, austenite may transform to polygonal ferrite, acicular ferrite, bainite, or martensite. In a low-alloy weld metal, the austenite grain established during solidification may contain many ferrite units or bainitic packets. Conversely, a weld that appears fine under an optical microscope may contain coarse prior-austenite grains subdivided into fine transformation products. Reporting “weld grain size” without naming the measured boundary is ambiguous.
Multiple weld passes add another complication. A later pass reheats part of an earlier fusion zone, refining or transforming its structure in one location while leaving another location unchanged. The reheated metal may experience intercritical or subcritical tempering rather than complete recrystallization. Thus, the final weld cross-section records overlapping thermal histories, not one cooling curve.
Coarse-grained and fine-grained heat-affected zones
The HAZ is commonly divided by peak temperature relative to the steel’s transformation temperatures. Immediately beside the fusion boundary, the coarse-grained HAZ (CGHAZ) reaches a high peak temperature, often well above the upper critical temperature. Existing austenite grains dissolve or grow, and pinning particles such as niobium carbonitrides or titanium carbonitrides may dissolve when the thermal cycle is sufficiently severe. Long residence at high temperature produces large prior-austenite grains.
The CGHAZ does not necessarily contain coarse ferrite after cooling. Its prior-austenite grains may transform into fine bainite or martensite, whose packets, blocks, or laths are much smaller than the parent austenite grains. Those transformation units can control crack paths and cleavage facets more directly than the original austenite boundary. In other steels, slow cooling permits ferrite and pearlite to form, making the final structure visibly coarse as well. Cooling rate, carbon equivalent, plate thickness, heat input, and preheat determine which outcome occurs.
Farther from the fusion line, the fine-grained HAZ (FGHAZ) reaches a lower peak temperature, usually above the austenite transformation range but not high enough, or not long enough, for substantial austenite coarsening. New austenite grains nucleate more frequently, often aided by undissolved precipitates that restrict boundary motion. On cooling, this region may produce relatively fine ferrite-pearlite, bainite, or martensite. The boundary between CGHAZ and FGHAZ is gradual rather than perfectly sharp because peak temperature and time vary continuously with distance.
The intercritical HAZ is heated between the lower and upper critical temperatures. Only part of the microstructure transforms to austenite, so fresh transformation products form beside tempered or previously transformed regions. In quenched-and-tempered steels, this area can lose strength through tempering; in dual-phase or multiphase steels, it may develop local islands of hard martensite. A subcritical HAZ can undergo tempering, recovery, or precipitation changes without austenitizing. These regions may govern local softening or crack initiation even when their visible grain size changes little.
Reheating is especially important in multipass welding. A second pass can refine an earlier CGHAZ by partial or complete reaustenitization, while a region just outside the new pass is only tempered. The same nominal HAZ may therefore contain coarse prior-austenite grains, refined ferrite, transformed islands, and softened material within millimetres. Thermal gradients make these changes spatially continuous, not a single joint-wide value.
Weld-metal Hall–Petch interpretation
The classical Hall–Petch relation expresses a grain-size contribution to strength approximately as
where is commonly a mean linear intercept and is a material-dependent coefficient. The University of Cambridge (2005) describes this inverse-square-root form. In weld metals, however, the choice of is decisive. It might mean ferrite grain diameter, prior-austenite intercept, bainitic packet size, or an effective transformation-unit size. These are not interchangeable.
For ferritic-pearlitic steels, NIST Special Publication 596 (1996) reports that yield strength and ductile-to-brittle transition temperature vary approximately with the inverse square root of ferrite grain diameter. Tensile strength is less consistently grain-size-sensitive, while elongation is comparatively insensitive. European Structural Engineering Design Programme guidance (2000) likewise links grain refinement with higher yield strength and a substantially lower transition temperature. In a weld, that benefit can be offset by hard second phases, segregation, residual stress, hydrogen, or a coarse prior-austenite framework.
Hall–Petch strengthening also has limits. When transformation units become very small, dislocation storage, retained austenite, martensitic transformation, and interface strength may matter as much as ordinary ferrite boundaries. Yonsei University (2014) reported tensile strengths near 900 MPa and elongations near 40% in a metastable austenitic alloy with 0.3–2 micrometre grains, where strain-induced martensitic transformation enhanced strain hardening. That result cannot be transferred directly to a ferritic weld. Similarly, a Japan Society of Mechanical Engineers study (2018) reported an approximately 1.0 micrometre transverse grain size in low-carbon steel with ultrafine elongated grains and a favourable measured balance of strength, ductility, and toughness; elongated morphology was part of the result, not a minor detail.
EBSD can separate some of these scales by mapping crystallographic misorientation. ASTM E2627 (2017) covers EBSD determination of average grain size, distributions, and statistical information in fully recrystallized polycrystalline materials, but its boundary criteria must still be stated. A welded joint therefore requires phase identification, section orientation, boundary definition, and location-specific sampling. One parent-material grain-size value cannot qualify it.
Grain Size as a Heat, Process, and Quality-Control Indicator
Using grain size to compare heats
Grain size is useful in quality control because it records part of a steel’s thermal and mechanical history. A coarse structure may indicate excessive austenitizing temperature, prolonged soaking, slow cooling, inadequate recrystallization control, or a different thermomechanical route. A fine structure may reflect controlled rolling, normalizing, faster transformation, or grain-refining additions such as niobium, titanium, or vanadium. The measurement does not identify which event occurred by itself, but it can show that two heats described by the same nominal grade did not experience equivalent processing.
The NIST assessment of received 4340 steel for Charpy reference specimens provides a clear example. In its 2001 report, NIST found that heats judged acceptable for reference-specimen production had measured grain sizes of approximately 30–40 micrometres, while unacceptable heats were approximately 60–70 micrometres. That difference was large enough to separate material populations during an investigation of impact-test quality. It should not be turned into a universal acceptance limit for every 4340 product: the result belongs to a defined material, heat-treatment condition, specimen application, and measurement procedure.
“Grain size” also needs a defined meaning before heats are compared. ASTM E112 (2024) provides comparison, planimetric, and intercept procedures for average planar grain size. The ASTM grain size number is calculated from grain counts per unit area or from grain-boundary intercepts; it is not simply a label attached to a micrograph. A micrometre value obtained by a line-intercept method cannot be treated as automatically interchangeable with an ASTM grain size number obtained by another method. The report should state the method, magnification or scan parameters, section location, orientation, phase measured, and whether the result is an arithmetic mean, distribution, or selected field value.
Morphology can make a single average misleading. Rolled plate may contain elongated grains, banded ferrite and pearlite, or a through-thickness gradient. A longitudinal section can therefore show a different intercept length from a transverse or short-transverse section. A transformed microstructure may contain packets, blocks, laths, or prior-austenite grains whose boundaries are not equivalent for every property. In ferritic-pearlitic steel, ferrite grain diameter is often the relevant variable for yield strength and transition temperature; measuring apparent pearlite colony size instead can answer a different question.
The underlying reason for the comparison is the Hall–Petch relationship. Grain boundaries impede dislocation slip, so yield strength commonly rises as mean grain size or mean linear intercept decreases, approximately with an inverse-square-root dependence. NIST Special Publication 596 (1996) reports that, in ferritic-pearlitic steels, yield strength and ductile-to-brittle transition temperature vary approximately with the inverse square root of ferrite grain diameter. Tensile strength is less consistently grain-size-sensitive, while elongation is comparatively insensitive. Grain refinement can therefore improve the strength–toughness balance, but the size of the benefit depends on chemistry, second phases, texture, and the active fracture mechanism.
Hall–Petch behavior is not an unlimited rule. In ultrafine structures, boundaries may be nonequilibrium, deformation may be strongly localized, and other mechanisms can control strength or ductility. A 2014 Yonsei University study reported tensile strengths near 900 MPa and elongations near 40% in a metastable austenitic alloy with grain sizes of 0.3–2 micrometres, where strain-induced martensitic transformation supplied additional strain hardening. A 2018 Japan Society of Mechanical Engineers study on low-carbon steel with ultrafine elongated grains reported a transverse grain size of about 1.0 micrometre for its best balance among strength, ductility, and toughness. Those results cannot be transferred directly to normalized ferritic-pearlitic 4340.
Sampling plans and acceptance decisions
Minimum reporting checklist
- Material Grade, heat or lot, and metallurgical condition.
- Processing Heat treatment, reduction schedule, cooling rate, and welding history where relevant.
- Measured object Phase, grain type, packet, block, colony, or other structural unit.
- Method ASTM E112, ASTM E2627, optical analysis, or another declared procedure.
- Geometry Section plane, test-line direction, and morphology.
- Statistics Number of fields or grains, mean, spread, and distribution.
A useful grain-size result begins with a sampling plan, not with the most attractive field on a polished section. Samples should represent the heat, product cross-section, and relevant processing locations. For plate, that may require positions near the surface, quarter-thickness, and mid-thickness; for bar, center and rim locations may be necessary. If the material was cut, forged, rolled, or heat treated in a known direction, longitudinal, transverse, and short-transverse sections should be selected according to the property being assessed.
Replicate fields are necessary because grain structures are spatially variable. Several non-overlapping fields at each location are preferable to one field selected by convenience. The analyst should record the number of grains or intercepts contributing to each field, then report the spread between fields and sections. A mean without dispersion can conceal a mixed structure in which one region is fine and another is coarse. Confidence intervals or a stated repeatability estimate make the result more useful for an acceptance decision.
ASTM E112 supports this statistical approach, but it does not remove the need to define the decision rule. A specification may require an average value, a maximum coarse-grain fraction, a uniformity limit, or agreement with a reference chart. These are different requirements. If a heat falls close to the limit, repeat preparation and measurement by a qualified second analyst may be more defensible than an immediate pass-or-reject decision. The laboratory should also account for polishing quality, etching contrast, operator judgment, and the uncertainty associated with counting a finite number of grains.
Electron backscatter diffraction can add information when optical boundaries are difficult to resolve or when the structure is highly deformed. ASTM E2627 (2017) covers average grain size by EBSD in fully recrystallized polycrystalline materials and includes grain-size distributions and statistical information. EBSD results still depend on step size, cleanup rules, misorientation criteria, indexed-area fraction, and the definition of a grain boundary. Those settings must accompany the reported value.
Acceptance decisions should connect the measurement to the product function. The NIST 4340 finding supports using grain size as one discriminator among heats intended for Charpy reference specimens. It does not justify rejecting every steel above 40 micrometres or accepting every steel below it. Impact toughness, hardness, tensile properties, and heat-treatment records remain part of the decision.
Separating grain-size effects from chemistry and defects
A coarse or nonuniform grain structure can correlate with poor toughness, but correlation is not proof of cause. Two heats may have similar ferrite grain sizes and different Charpy energies because one contains more oxygen, sulfur, phosphorus, or alloying elements that alter transformation and tempering response. Carbon, manganese, nickel, chromium, and molybdenum affect phase constitution and hardenability; niobium, titanium, and vanadium can restrict austenite grain growth while also forming precipitates. Chemistry must therefore be checked alongside grain size.
Inclusions and segregation can dominate fracture behavior even when the average grain size appears acceptable. Manganese sulfide stringers, oxide clusters, centerline segregation, and banded constituents create local stress concentrations and preferred crack paths. A polished section should be examined for these features rather than reduced to a grain-size number. Fractography can show whether a Charpy or tensile fracture followed inclusions, cleavage facets, intergranular paths, or ductile dimples.
Mechanical tests provide the necessary cross-check. Hardness can reveal an unexpected phase or tempering condition; tensile testing separates yield-strength changes from ultimate-strength and elongation changes; Charpy testing measures transition behavior directly. Metallography should identify whether the measured grains belong to ferrite, prior austenite, martensite packets, bainite, or another phase. If chemistry, inclusions, segregation, phase constitution, and mechanical results are not examined together, grain size becomes a misleading surrogate for the entire processing history. That is precisely where its value ends: it is a sensitive indicator, not a complete diagnosis.
Common Misinterpretations of ASTM Grain-Size Numbers
Why a higher ASTM number means finer grains
The ASTM grain-size number runs opposite to the everyday meaning of “large” and “small.” A higher number indicates more grains in a defined area and therefore a finer average grain structure. ASTM E112:2024 determines average planar grain size by comparison, planimetric, or intercept procedures. In the planimetric method, the analyst counts grains within a measured area; in the intercept method, the analyst counts grain-boundary intersections along test lines. The reported ASTM number is derived from those counts, not from the visual impression of a micrograph.
The standard relationship is logarithmic. For the comparison and planimetric framework commonly associated with ASTM grain-size numbers, the number of grains per square inch at 100× magnification is represented by:
Here, is the ASTM grain-size number and is the number of grains per square inch at 100×. Increasing by one therefore doubles the counted grain population in that reference area. ASTM No. 8 is not merely “one size class finer” than ASTM No. 7 in a linear sense; its reference grain count is twice as high. ASTM No. 10 has four times the count associated with ASTM No. 8.
That reversal matters in specifications and failure investigations. Calling ASTM No. 10 “coarser” than ASTM No. 7 can invert the meaning of a heat-treatment result. In ferritic-pearlitic steels, finer ferrite grains commonly raise yield strength and lower the ductile-to-brittle transition temperature. NIST Special Publication 596 (1996) describes the approximate inverse-square-root dependence of yield strength and transition temperature on ferrite grain diameter, while tensile strength is less consistently grain-size-sensitive and elongation is comparatively insensitive. The European Structural Engineering Design Programme likewise reports that grain refinement increases yield strength and substantially lowers transition temperature.
The Hall–Petch relation explains the usual trend:
where may represent an appropriate mean grain dimension or mean linear intercept. Grain boundaries obstruct dislocation motion, so decreasing the relevant spacing generally increases the stress required for yielding. This is a trend, not a license to treat every higher ASTM number as a guaranteed improvement. In transformed steels, bainitic or martensitic packets, laths, blocks, prior-austenite grains, and effective cleavage units may control deformation or fracture more strongly than one optical “grain” measurement. At very small scales, Hall–Petch behavior can also depart from its classical form as boundary-mediated deformation and other mechanisms become important.
ASTM number versus micrometres
An ASTM grain-size number is a standardized statistical designation; a micrometre value is a physical length. They are related only after the measurement basis has been specified. A conversion from to an estimated mean grain diameter assumes a particular ASTM relationship, grain shape, section geometry, and definition of the measured dimension. It does not mean that every grain in an ASTM No. 8 steel measures the same number of micrometres.
ASTM E112 tables and equations can provide an approximate mean grain diameter or mean lineal intercept for a specified method. Those estimates should not be transferred casually between comparison, planimetric, and intercept results. A planimetric result weights grain area; an intercept result measures boundary crossings along test lines. Elongated grains, mixed grain sizes, twins, curved boundaries, and abnormal grain growth can make their numerical outputs differ even when both analyses are performed correctly.
Magnification also requires care. The ASTM number is tied to a reference counting convention, whereas a micrometre estimate depends on image calibration and the dimension selected by the analyst. A grain measured on a longitudinal section may have a different apparent size from the same three-dimensional population viewed transversely. In rolled plate, for example, grains can be elongated in the rolling direction and compressed through the thickness. Reporting “8 ASTM” without stating whether the specimen was longitudinal, transverse, or through-thickness leaves out information that can change the interpretation.
Phase constitution creates another trap. A ferrite grain diameter, prior-austenite grain size, martensite-packet size, and effective cleavage-grain size are not interchangeable quantities. EBSD may define a boundary using a misorientation threshold, while an etched optical section may show a boundary according to chemical attack and contrast. ASTM E2627:2017 addresses EBSD-based average grain size, distributions, and statistical information in fully recrystallized polycrystalline materials. Its result should not be presented as automatically equivalent to an ASTM E112 optical comparison number, particularly when the material contains unrecrystallized regions or several crystallographic populations.
For this reason, “ASTM No. 8 equals approximately 20 micrometres” is at best a shorthand estimate, not a universal identity. The quoted micrometre value must identify the standard relationship, measurement method, phase, boundary criterion, and specimen plane.
Average grain size versus specification compliance
A reported average is not the same thing as proof that a material meets a specification. Average grain size compresses a distribution into one value and can conceal coarse islands, duplex structures, banding, or a localized heat-affected zone. Two specimens may share an average of 40 micrometres while one has a narrow distribution and the other contains both very fine and very coarse regions. Their crack resistance need not be the same.
NIST’s 2001 assessment of 4340 steel illustrates why the measurement is useful for quality control. Acceptable heats used for Charpy reference specimens had grain sizes of approximately 30–40 micrometres, whereas unacceptable heats measured approximately 60–70 micrometres. Those figures describe a difference in processing quality, but they do not establish a universal pass/fail threshold for every 4340 product, location, or specification. Compliance depends on the governing document, sampling plan, permitted method, and acceptance criterion.
The specimen record should therefore state the material grade and condition, heat or lot, location within the product, section orientation, preparation method, magnification, standard procedure, phase measured, boundary definition, number of fields or test lines, and result distribution. If EBSD was used, the step size and misorientation criterion also matter. A single polished micrograph is evidence, not a complete grain-size determination.
The same caution applies to ultrafine and transformed microstructures. A Yonsei University study published in 2014 reported 0.3–2 micrometre grains in a metastable-austenitic alloy, with tensile strengths near 900 MPa and elongations near 40% when strain-induced martensitic transformation enhanced strain hardening. A 2018 Japan Society of Mechanical Engineers study found an approximately 1.0 micrometre transverse grain size gave the best reported balance of strength, ductility, and toughness in a low-carbon steel with ultrafine elongated grains. Neither result can be reduced to “the highest ASTM number wins.” Morphology, phase stability, texture, and fracture mechanism determine what the measured size means.
A Practical Interpretation Framework for Steel Grain Size
Questions to ask before comparing results
A grain-size value has meaning only after its measurement context is fixed. Begin with the grade and condition: for example, AISI/SAE 4340, a normalized ferritic-pearlitic steel, a quenched-and-tempered martensitic steel, or a thermomechanically processed low-carbon steel. Record heat treatment, reduction schedule, reheating temperature, cooling rate, and any welding or surface-processing history. Two samples with the same nominal grade can contain different phase fractions, precipitate populations, dislocation densities, and textures.
Then ask what the reported “grain” actually represents. In a ferritic-pearlitic steel, the measured unit may be ferrite grains, while pearlite colonies, prior-austenite grains, and packets or blocks in a transformed microstructure may control a different property. In martensitic steel, an optical image may show packets or blocks rather than independent crystallographic grains. In an ultrafine-grained alloy, the relevant scale may be a submicrometre crystallographic grain measured by electron backscatter diffraction (EBSD), not the larger feature visible in a light microscope.
The method must be stated. ASTM E112:2024 provides comparison, planimetric, and intercept procedures for average planar grain size. Its ASTM grain size number is derived from grain counts per unit area or grain-boundary intercepts. A higher ASTM grain size number generally indicates finer grains, but that number is not a micrometre value by itself. It cannot be compared directly with a quoted mean linear intercept unless the procedure, boundary definition, phase, and morphology are known.
ASTM E2627:2017 covers EBSD determination of average grain size in fully recrystallized polycrystalline materials, including grain-size distributions and statistical information. EBSD results depend on the angular misorientation criterion, cleanup rules, scan step, and treatment of non-indexed pixels. Those details can change the counted population substantially. A banded or elongated structure also demands caution: longitudinal and transverse intercepts will differ, so one scalar “grain size” can conceal strong anisotropy.
Sampling location and orientation come next. Identify the plate, bar, forging, weld zone, heat-affected zone, or surface layer, then state whether the section is longitudinal, transverse, or through-thickness. Take more than one field where possible. A local coarse-grained region, band, inclusion stringer, or recrystallization gradient can make a single micrograph unrepresentative. Report the mean and spread, not merely the finest field. A distribution, number of measurements, confidence interval, or at least minimum and maximum values gives the reader a sense of sampling uncertainty.
NIST’s 2001 assessment of 4340 steel illustrates why this is a quality question rather than a cosmetic one: acceptable heats for NIST Charpy reference specimens had grain sizes of approximately 30–40 micrometres, whereas unacceptable heats were approximately 60–70 micrometres. The difference mattered because grain coarsening altered impact behavior and reference-material performance.
Linking microstructure to the required property
The first property to connect with grain size should usually be yield strength. The classical Hall–Petch relation expresses the grain-size contribution approximately as
where is a mean grain diameter or, in many treatments, a mean linear intercept. Grain boundaries obstruct dislocation motion, so decreasing the relevant ferrite grain dimension commonly raises yield strength. The University of Cambridge’s 2005 materials notes describe this inverse-square-root dependence as the central Hall–Petch relationship.
That relationship is not a universal promise. The controlling unit may be ferrite grain size in one steel and an effective packet or block size in another. Solute content, precipitation, texture, dislocation density, phase fraction, and residual stress can contribute as much as or more than the boundary spacing. At sufficiently small dimensions, grain-boundary-mediated mechanisms, recovery, shear localization, or altered deformation modes can reduce the usefulness of a simple extrapolation. Hall–Petch strengthening is a model with a range of validity, not a guarantee that every refinement step produces the same increment in strength.
For conventional ferritic-pearlitic steels, NIST Special Publication 596 (1996) reports that yield strength and ductile-to-brittle transition temperature vary approximately with the inverse square root of ferrite grain diameter. Tensile strength is less consistently grain-size-sensitive, and elongation is comparatively insensitive. This distinction should control the comparison. If the engineering requirement is yield resistance or low-temperature toughness, refinement may be highly valuable. If the requirement is uniform elongation, a smaller grain size alone may provide little change; work hardening, phase transformation, inclusions, and texture may dominate instead.
Charpy transition behavior deserves separate treatment. Finer ferrite grains generally lower the ductile-to-brittle transition temperature, as reported by the European Structural Engineering Design Programme in 2000, but the measured shift also depends on notch geometry, test temperature, cleavage facets, inclusions, and the phase constitution. Compare transition curves, not only one absorbed-energy value. Fractography should identify whether failure was cleavage, quasi-cleavage, ductile dimple rupture, intergranular cracking, or a mixed mechanism.[7] Study of low-carbon steel with ultrafine elongated grains. Japan Society of Mechanical Engineers researchers. Transactions of the Japan Society of Mechanical Engineers, 2018.
Ultrafine and transformed steels make simple comparisons still less reliable. A Yonsei University study published in 2014 reported a metastable-austenitic alloy with grain sizes of 0.3–2 micrometres, tensile strengths near 900 MPa, and elongations near 40%. Strain-induced martensitic transformation supplied additional strain hardening, so the ductility cannot be credited to grain refinement alone. Likewise, a 2018 Japan Society of Mechanical Engineers study of low-carbon steel with ultrafine elongated grains reported its best balance among strength, ductility, and toughness at a transverse grain size of about 1.0 micrometre. The transverse dimension, not an unspecified average, was decisive.
A reporting checklist for technical references
A usable reference should identify the exact steel designation and metallurgical condition, including heat treatment or thermomechanical route. It should state whether the reported unit is ferrite, austenite, prior austenite, martensite packet, crystallographic grain, colony, or another feature.
The measurement section should name ASTM E112 or ASTM E2627 where applicable, specify comparison, planimetric, intercept, or EBSD practice, and give the phase-boundary or misorientation criterion. Include the reported ASTM grain size number and the equivalent micrometre measure only when the conversion and method are explicit.
Record section orientation, sampling location, field count, magnification or EBSD step size, mean value, distribution, and uncertainty. For elongated grains, provide longitudinal and transverse dimensions. A single mean is inadequate when the population is bimodal or strongly banded.
Finally, place the microstructure beside yield strength, tensile strength, elongation, hardness, and Charpy transition behavior, then examine fracture observations and confounding variables such as inclusions, texture, precipitation, residual stress, cooling history, and phase fraction. Grain refinement is a powerful metallurgical lever, but its value depends on the property being sought, the mechanism carrying the load or crack, and the way the structure was measured—not on fineness alone.
References
- [1] NIST Special Publication 596. NIST Special Publication, 1996. https://nvlpubs.nist.gov/nistpubs/Legacy/SP/nbsspecialpublication596.pdf
- [2] Assessing the Quality of Received 4340 Steel for Production of NIST Charpy Reference Specimens. NIST assessment report, 2001. https://www.nist.gov/publications/assessing-quality-received-4340-steel-production-nist-charpy-reference-specimens
- [3] New ASTM Standard Covers Use of Electron Backscatter Diffraction to Measure Grain Size. ASTM International standard announcement, 2017. https://www.astm.org/news/press-releases/new-astm-standard-covers-use-electron-backscatter-diffraction-measure-grain-size
- [4] Steel: Microstructure and Grain Refinement. ESDEP lecture material, 2000. https://fgg-web.fgg.uni-lj.si/~/pmoze/ESDEP/master/wg02/l0100.htm
- [5] Hall–Petch relationship. Phase Transformations materials notes, 2005. https://www.phase-trans.msm.cam.ac.uk/2005/Graz3/Graz3.html
- [6] Effect of grain size on the uniform ductility of a bulk ultrafine-grained metastable austenitic alloy. Yonsei University research publication, 2014. https://yonsei.elsevierpure.com/en/publications/effect-of-grain-size-on-the-uniform-ductility-of-a-bulk-ultrafine/
- [7] Study of low-carbon steel with ultrafine elongated grains. Transactions of the Japan Society of Mechanical Engineers, 2018. https://www.jstage.jst.go.jp/article/transjsme/84/866/84_18-00237/_article/-char/en