



What Fatigue Crack-Growth Testing Measures

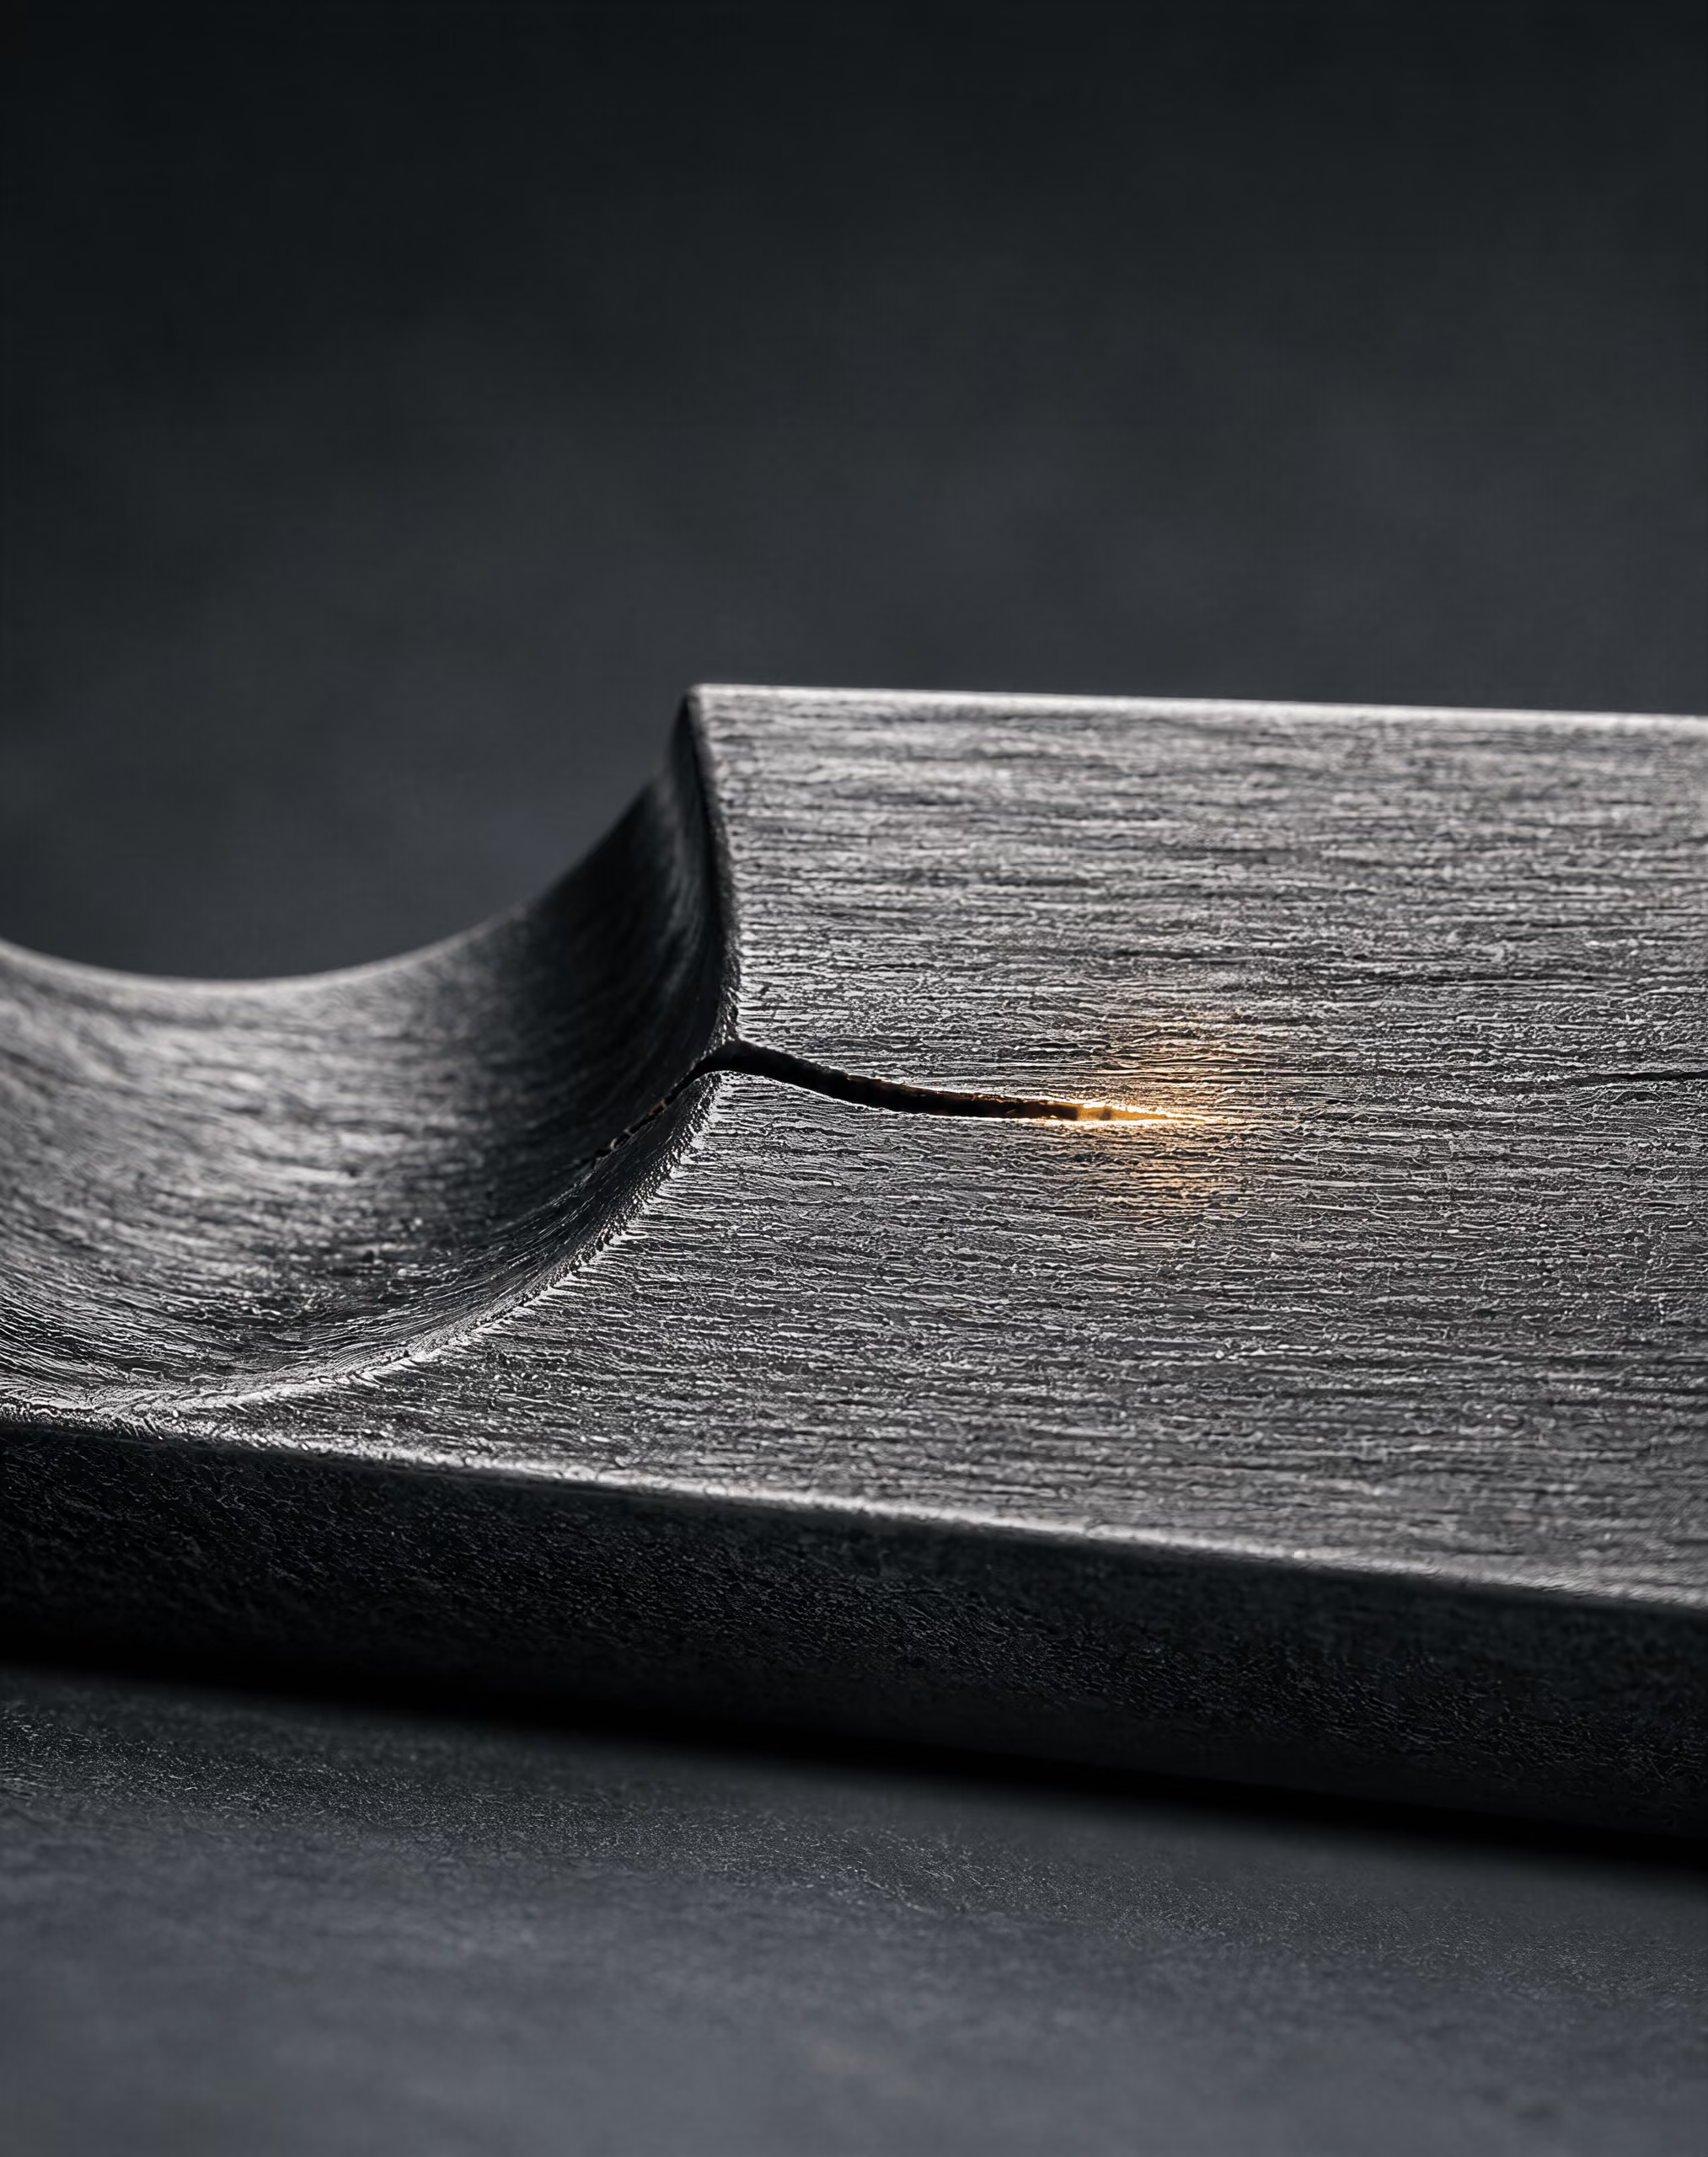
Fatigue crack-growth testing measures how an existing crack extends under repeated loading. The specimen is first given a fatigue pre-crack so that the test begins with a controlled, sharp crack rather than an unknown machining flaw. During subsequent loading, the crack length is measured at selected cycle counts, and the result is reported as incremental crack extension per cycle:
Core test variables
- a
- Crack length.
- N
- Number of load cycles.
- da/dN
- Incremental crack extension per cycle.
- ΔK
- Stress-intensity-factor range.
- Kmax
- Maximum stress-intensity factor in a loading cycle.
- R
- Force or stress-intensity ratio, defined as Kmin/Kmax.
Here, is crack length and is the number of load cycles. The measured quantity is therefore not a tensile strength, yield strength or hardness value. It is a rate of damage accumulation for a particular crack, loading history, specimen geometry, environment and measurement procedure.
ASTM E647-23 covers fatigue crack-growth-rate determination from the near-threshold regime through Kmax-controlled instability. Strong evidence
[1] ISO 12108:2018: Metallic materials — Fatigue testing — Fatigue crack growth method. International Organization for Standardization. ISO standard, 2018.
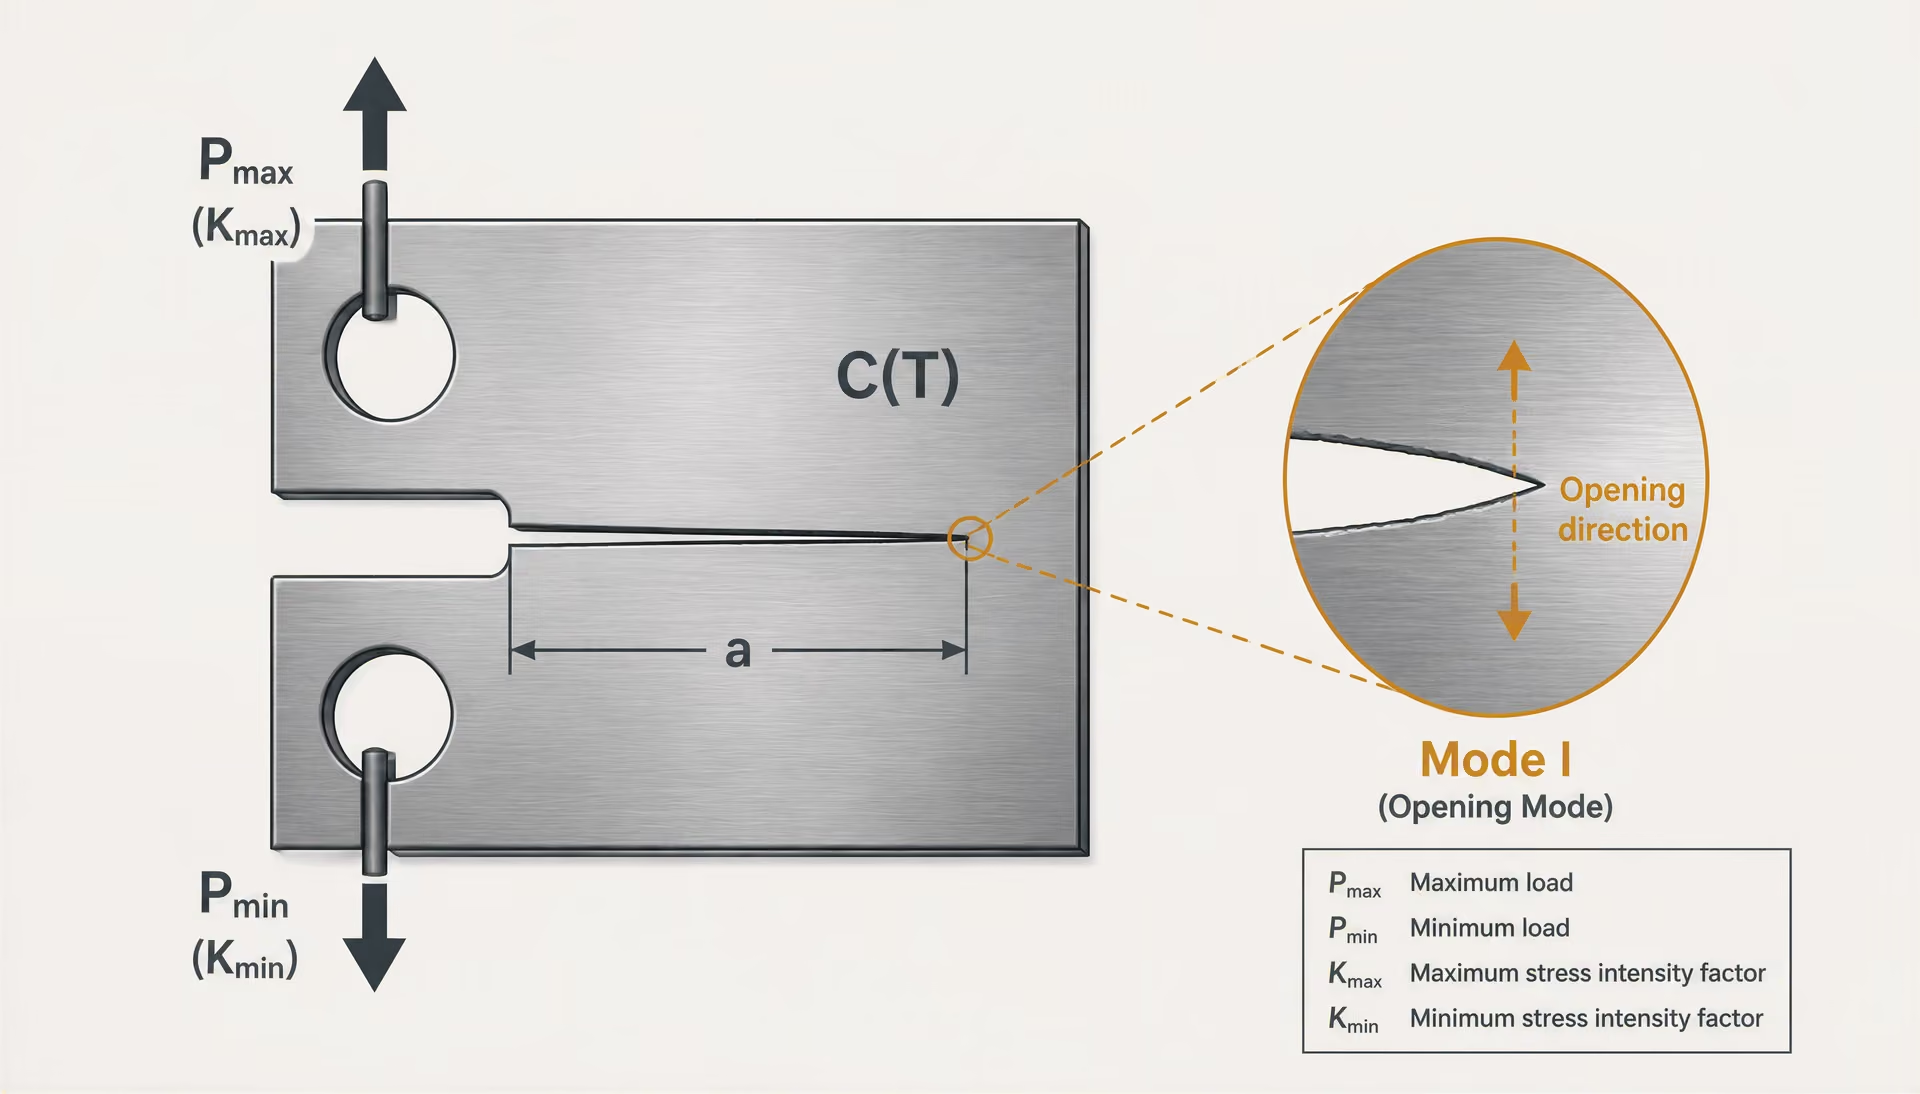
A standard test normally applies predominantly mode-I opening loads to a compact-tension, middle-crack-tension or related specimen. The test force may be constant amplitude, with a defined force ratio , while the crack grows through a sequence of known stress-intensity conditions. ASTM E647-23 covers fatigue crack-growth-rate determination “from the near-threshold regime through -controlled instability” (ASTM International, 2023). ISO 12108:2018 similarly specifies testing from the threshold stress-intensity-factor range, , to the onset of rapid unstable fracture, mainly for isotropic metallic materials under predominantly linear-elastic mode-I loading at constant force ratio .
That scope matters. The output is a relationship between crack-growth rate and a fracture-mechanics driving force, not one fixed number that describes every structural failure process in a steel.
Crack-growth rate versus crack-initiation life
| Test type | Starting condition | Primary result | Main uncertainty |
|---|---|---|---|
| Initiation-life test | Smooth, polished or notched specimen | Cycles to a defined crack-detection criterion | Surface finish, inclusions, residual stress and detection sensitivity |
| Fatigue crack-growth test | Deliberately formed fatigue pre-crack | Crack extension per cycle for a known crack | Geometry, loading, environment and rate-reduction procedure |
Crack initiation and crack propagation are different measurements. An initiation-life test may begin with a smooth, polished or notched specimen and record the cycles required for a crack to form according to a chosen detection criterion. That criterion could be a surface crack of a specified length, a compliance change, a potential-drop signal or another instrument response. Results depend strongly on surface finish, inclusions, residual stress, notch shape, microstructure and the sensitivity of the inspection method.
Fatigue crack-growth testing removes much of that uncertainty by starting with a deliberately formed crack. The test asks a narrower question: once a crack of known size exists, how far does it advance during each additional cycle? The procedure usually separates three physical regions.
Threshold stress-intensity-factor range The procedure-defined ΔK boundary below which sustained crack extension is not detected under specified test conditions.
At low driving force, the crack may remain dormant or advance only intermittently. This is the near-threshold region, where the measured rate approaches the threshold value associated with the selected procedure. Above that region, stable subcritical propagation occurs. The crack advances with each group of cycles, although the rate can change as the stress intensity rises. At sufficiently high loading, the remaining ligament can no longer sustain stable growth, and rapid fracture begins. The final event is not another ordinary point on a long-lived fatigue-growth curve; it is an instability governed strongly by , specimen constraint and fracture toughness.
The distinction prevents a common error. A steel may have a long initiation life but a relatively high propagation rate once a crack is present, or it may show early crack formation followed by slow stable growth. A fatigue-growth-rate curve cannot, by itself, predict the cycles required to initiate a crack in an uncracked component.[2] Fatigue crack growth testing. TWI. TWI technical knowledge, 2024.
The same issue appears in standards comparisons. TWI reported in 2024 that ASTM E647 and ISO 12108 use different threshold and decreasing- criteria. Consequently, two laboratories can test nominally similar steel and obtain different near-threshold results without either dataset being automatically invalid. Specimen geometry, crack-length calibration, load control, environment, force ratio and data-reduction rules all affect the reported curve.
The role of , and
The central driving-force parameter in linear-elastic fatigue-growth testing is the stress-intensity-factor range:
For a given specimen, depends on applied stress, crack length and a geometry correction factor. A simplified form is often written as:
where represents specimen and crack geometry, is applied stress and is crack length. Thus, the same nominal stress does not impose the same crack-driving force on specimens with different crack sizes or geometries. This is why a crack-growth result cannot be transferred between configurations without checking the applicable stress-intensity solution and validity limits.
| Symbol | Meaning | Reporting requirement |
|---|---|---|
| da/dN | Fatigue-crack-growth rate | State crack-length and cycle units |
| C | Fitted coefficient or log–log intercept | State units and fitting interval |
| m | Paris-law exponent or slope | Some reports use n instead |
| ΔK | Stress-intensity-factor range | State MPa√m or ksi√in |
| R | Kmin/Kmax | Report with the test conditions |
The Paris and Erdoğan relationship, introduced in their 1963 paper, expresses the mid-rate portion of the curve as:
Paris-law exponent The fitted slope of log crack-growth rate against log stress-intensity-factor range over a selected interval.
Some reports use instead of . On a log–log plot of against , , or , is the slope and is the intercept under the selected units and fitting convention. The constants are therefore conditional. Changing units changes the numerical value of ; changing force ratio, environment, temperature, steel microstructure or fitting interval can change both constants.
Paris and Erdoğan argued for assessment across broad crack-growth-rate ranges and with multiple specimens, rather than treating a narrow fitted segment as a universal material law. The warning remains important because the Paris equation does not describe the threshold region well and does not capture the final -controlled acceleration. Near threshold, crack closure and microstructural barriers can dominate. Near instability, maximum stress intensity and fracture resistance become decisive.
Standard damage-integration analyses generally use data from constant-amplitude tests on cracked specimens. Strong evidence
[3] Damage Tolerance Design Handbook. AFGROW. AFGROW Damage Tolerance Design Handbook, 2024.AFGROW states that data used for standard damage-integration analyses generally come from constant-amplitude tests on cracked specimens, with most such tests covered by ASTM E647. Those data can later be integrated through a structural stress-intensity history to estimate crack-growth life. That later calculation is an assessment assumption, not part of the basic measurement.
NIST’s 2001 work on two ferrite–pearlite pipeline steels used curved M(T) specimens and examined rate scatter by attributing measured variation to the Paris-law constant . A 1976 NIST report on 5% Ni steel weldments likewise fitted fatigue-crack-growth data with the Paris power law and identified as the intercept and as the log–log slope. Neither example turns into a grade-independent steel constant.
Structural rules reflect this limitation. FAA AC 25.571-1D addresses crack-growth analysis, probable fatigue-damage locations and inspection planning for transport-airplane structures, while 14 CFR 25.571 requires damage-tolerance evaluations supported by repeated-load evidence where applicable. The test supplies measured crack-growth behavior; geometry, load spectrum, initial-flaw assumptions and inspection reliability determine what that behavior means in a structure.
The Paris Law: Equation, Parameters and Limits
The Paris–Erdoğan relationship
The Paris law is usually written
where is crack length, is the number of load cycles, and is the fatigue-crack-growth rate. The term is the stress-intensity-factor range, normally expressed in MPa√m or ksi√in. and are fitted parameters, not universal properties that can be read from a steel grade designation.
P. C. Paris and F. Erdoğan introduced this empirical relationship in their 1963 paper, “A Critical Analysis of Crack Propagation Laws.” Their work connected measured crack-extension rates with the elastic stress-intensity range and showed that a power law could represent a substantial portion of stable fatigue crack growth. The equation describes a region of behavior; it does not describe every stage of fatigue propagation. Near the threshold, crack closure, microstructure and load-history effects can cause the rate to fall below the Paris line. As approaches the material’s fracture-toughness-controlled limit, acceleration toward unstable fracture produces another departure.
That range restriction matters. ASTM E647-23 covers fatigue-crack-growth-rate determination “from the near-threshold regime through Kmax-controlled instability,” while ISO 12108:2018 specifies testing from the threshold stress-intensity-factor range to the onset of rapid unstable fracture. Neither standard turns every measured point across that interval into one Paris-law fit. The test method defines how rates, crack length, force, compliance, stress intensity and validity are determined; the analyst still has to identify the interval in which a power law is an acceptable representation.
The original Paris–Erdoğan argument also favored judging crack-growth behavior over a broad rate range and using multiple specimens, rather than assigning major significance to a narrow fitted segment. That is a useful warning for steel testing. A straight-looking line over one decade of may support a local engineering approximation, but it cannot establish behavior near , near fracture instability, or under a different loading history.
Meaning of and or
Taking common logarithms gives
On a log–log plot of against , is the slope and is the vertical intercept at the chosen unit. Some reports use instead of , so
has the same meaning when . The notation changes; the fitted relationship does not.
The exponent describes how sharply the measured growth rate changes with stress-intensity range within the selected interval. A larger exponent means a steeper line. It does not mean that one steel is simply “more fatigue resistant” in every condition. The intercept controls the rate level, but has dimensions. If is reported in m/cycle and in MPa√m, then has units of
\[ \mathrm{m/cycle}\,(\mathrm{MPa}\sqrt{\mathrm m})^{-m}. \]
Changing from MPa√m to ksi√in changes the numerical value of , even though the physical curve is unchanged. A reported without its crack-growth-rate units, stress-intensity units, exponent, and fitting interval is incomplete.
The intercept is also not necessarily a directly observed point. Most fitted data do not include in the selected unit system, and the intercept is obtained by extrapolation in log space. This makes sensitive to the fitted slope and to the range of data included. The NIST report on 5% Ni steel weldments, for example, identifies as the intercept and as the slope of a log–log -versus- fit. That description is mathematically precise, but it should not be mistaken for a claim that is a fixed metallurgical constant.
Variation in measured pipeline-steel crack-growth rates can be represented through variation in the Paris-law coefficient C for the studied dataset. Limited evidence
A separate NIST study of two ferrite–pearlite pipeline steels used curved M(T) specimens and analyzed “the scatter in the measured rates” by attributing it to the Paris-law constant . This is an uncertainty model for those measurements and conditions. It does not remove scatter caused by specimen alignment, crack-front shape, residual stress, microstructural banding, operator decisions or the statistical distribution of crack-growth increments.
Why the log–log fit is not a universal material constant
A Paris fit belongs to a test configuration and a defined population of data. Stress ratio is especially important because crack closure and the maximum stress-intensity level can alter the measured rate at the same . Environment matters too: air, vacuum, humidity, aqueous solutions and hydrogen-containing conditions can produce different propagation rates in the same steel. Temperature, frequency, corrosion products and hold times may further change the mechanism.
Geometry affects how is calculated and how accurately the crack-driving force is represented. Compact-tension, middle-crack tension and curved M(T) specimens can produce different constraint, crack-front and residual-stress conditions. A valid stress-intensity solution reduces one source of error; it does not make the specimens mechanically identical. Steel condition must also be stated: examples include ferrite–pearlite pipeline steels, 5% Ni steel weldments, welded heat-affected zones, quenched-and-tempered steels, and the relevant product or welding specification. “Steel” alone is not a sufficient material description.
ASTM E647 and ISO 12108 use different threshold and decreasing-ΔK criteria. Strong evidence
The fitting interval must be reported alongside and or : give the range, the range, stress ratio, environment, temperature, specimen geometry, specimen orientation, force-control method and data-reduction procedure. ASTM E647-23 and ISO 12108:2018 do not establish identical threshold or decreasing- criteria; TWI specifically notes that their procedures differ in these areas. A threshold value obtained under one standard should therefore not be compared as if it were automatically equivalent to a value from the other.
AFGROW states that data used for standard damage-integration analyses generally come from constant-amplitude tests on cracked specimens, most commonly covered by ASTM E647. Structural assessment then integrates a selected crack-growth rule through a load spectrum, often with geometry corrections and inspection assumptions. That is a separate step from measuring . FAA AC 25.571-1D and 14 CFR 25.571 place crack-growth analysis, probable fatigue-damage locations, test-supported repeated-load evaluation and inspection planning within transport-aircraft damage-tolerance compliance.
The practical rule is simple: do not transfer or between stress ratios, environments, specimen geometries or steel conditions without evidence. Refit the relevant data, or justify the transfer with validated corrections and uncertainty bounds. The Paris equation is valuable precisely because it is a controlled approximation—not because it is a complete description of fatigue in steel.
Stress Intensity, ΔK, Kmax and Stress Ratio R
Fatigue-crack-growth testing does not correlate crack extension with nominal stress alone. It correlates the measured rate, usually , with the elastic stress intensity at the crack tip. For predominantly mode-I loading, the important quantities are the maximum stress-intensity factor , the minimum value , their range
and the stress ratio
For a fixed specimen and crack length, is also commonly written as , because both stress-intensity values scale with applied force. These definitions are related, but they do not describe the same feature of a cycle. measures the amplitude of the elastic crack-tip driving force; describes the position of that cycle, including its tensile mean component. Two tests can have the same and different , or the same nominal stress range and different .
Linear-elastic mode-I loading
Mode I is the opening mode: the crack faces separate normally as tensile loading increases. ASTM E647-23 and ISO 12108:2018 are written primarily around fatigue-crack-growth measurements under predominantly linear-elastic mode-I conditions, generally at constant force ratio . “Linear elastic” does not mean that the steel contains no plasticity. It means that the specimen response and the crack-tip field can be represented sufficiently by linear-elastic fracture mechanics, with any small plastic zone treated as a local correction rather than the governing structural scale.
For an idealized crack in a body under tensile stress, the mode-I stress-intensity factor is often expressed as
where is the applied nominal stress, is crack length, is a dimensionless geometry factor, and is a characteristic specimen dimension. The factor may depend on crack length, specimen width, thickness, loading arrangement, and the proximity of free edges or grips. In a force-controlled test, the equivalent expression uses applied force rather than nominal stress.
The cyclic values follow directly:
\[ K_{\max}=Y\sigma_{\max}\sqrt{\pi a}, \qquad K_{\min}=Y\sigma_{\min}\sqrt{\pi a}. \]
Consequently,
when the same geometry factor applies throughout the cycle. As the crack grows, increases and usually rises even if the applied force range remains constant. That rising driving force is why a constant-amplitude test does not produce a constant crack-growth rate over its full length.
The stress-intensity approach has limits. If the plastic zone is too large relative to ligament dimensions, if crack-front constraint changes substantially, or if elastic unloading is not a reasonable approximation, a nominal may not characterize the crack-tip cycle adequately. ASTM E647-23 covers measurement from the near-threshold regime through -controlled instability, but the valid range still depends on specimen size, ligament requirements, crack quality, and the test procedure.
How geometry enters the stress-intensity factor
| Configuration | Typical designation | Geometry feature | Comparison caution |
|---|---|---|---|
| Compact tension | C(T) | Pin-loaded specimen with a crack between loading holes | Use the C(T) stress-intensity solution |
| Middle-crack tension | M(T) | Wide tensile strip with a central crack | Account for width, crack length and orientation |
| Single-edge-notch tension | SEN(T) | Edge crack under tension | State the exact configuration and calibration |
| Single-edge-notch bend | SEN(B) | Edge crack under bending | Constraint and plasticity may differ from tension tests |
Geometry is not a correction added after the test; it is part of the measured fracture-mechanics quantity. A compact-tension specimen, a middle-crack tension specimen, and a single-edge-notch bend specimen can experience the same nominal stress range while producing different values because their functions differ. The crack length also enters directly through \(\sqrt a\). A longer crack therefore experiences a greater stress intensity under the same nominal stress.
The distinction matters when comparing steel data. A ferrite–pearlite pipeline steel tested in a curved M(T) specimen is not being tested under the same crack-tip constraint as a steel tested in a compact specimen, even if both reports quote the same nominal force range. A 2001 NIST study of two ferrite–pearlite pipeline steels used curved M(T) specimens and treated scatter in the measured rates by attributing it to the Paris-law constant . That result does not make a geometry-free property; it shows how uncertainty in a fitted rate law can absorb experimental and material variation within a defined test arrangement.
The same caution applies to weldments. A 1976 NIST report on 5% Ni steel weldments fitted data using the Paris form, identifying as the intercept and as the slope of a log–log -versus- plot. The fitted exponent and intercept describe that dataset and its test conditions. They should not be transferred to a different weld geometry, residual-stress state, temperature, environment, or load ratio without evidence.
Paris and Erdoğan introduced the commonly written relationship
in their 1963 paper. On logarithmic axes, (called in some reports) is the slope and is the intercept. The equation is a useful middle-regime description, not a complete fatigue law. Paris and Erdoğan argued for assessment over broad crack-growth-rate ranges and multiple specimens, rather than presenting a narrow fitted segment as a universal material constant.
R ratio and crack-closure effects
and must be reported together when the test condition requires them. At , for example, the minimum tensile stress intensity is 10% of the maximum. At a negative , part of the cycle may be compressive. A test at can have the same as a test at , yet a higher and mean tensile loading. Their crack-growth rates need not match.

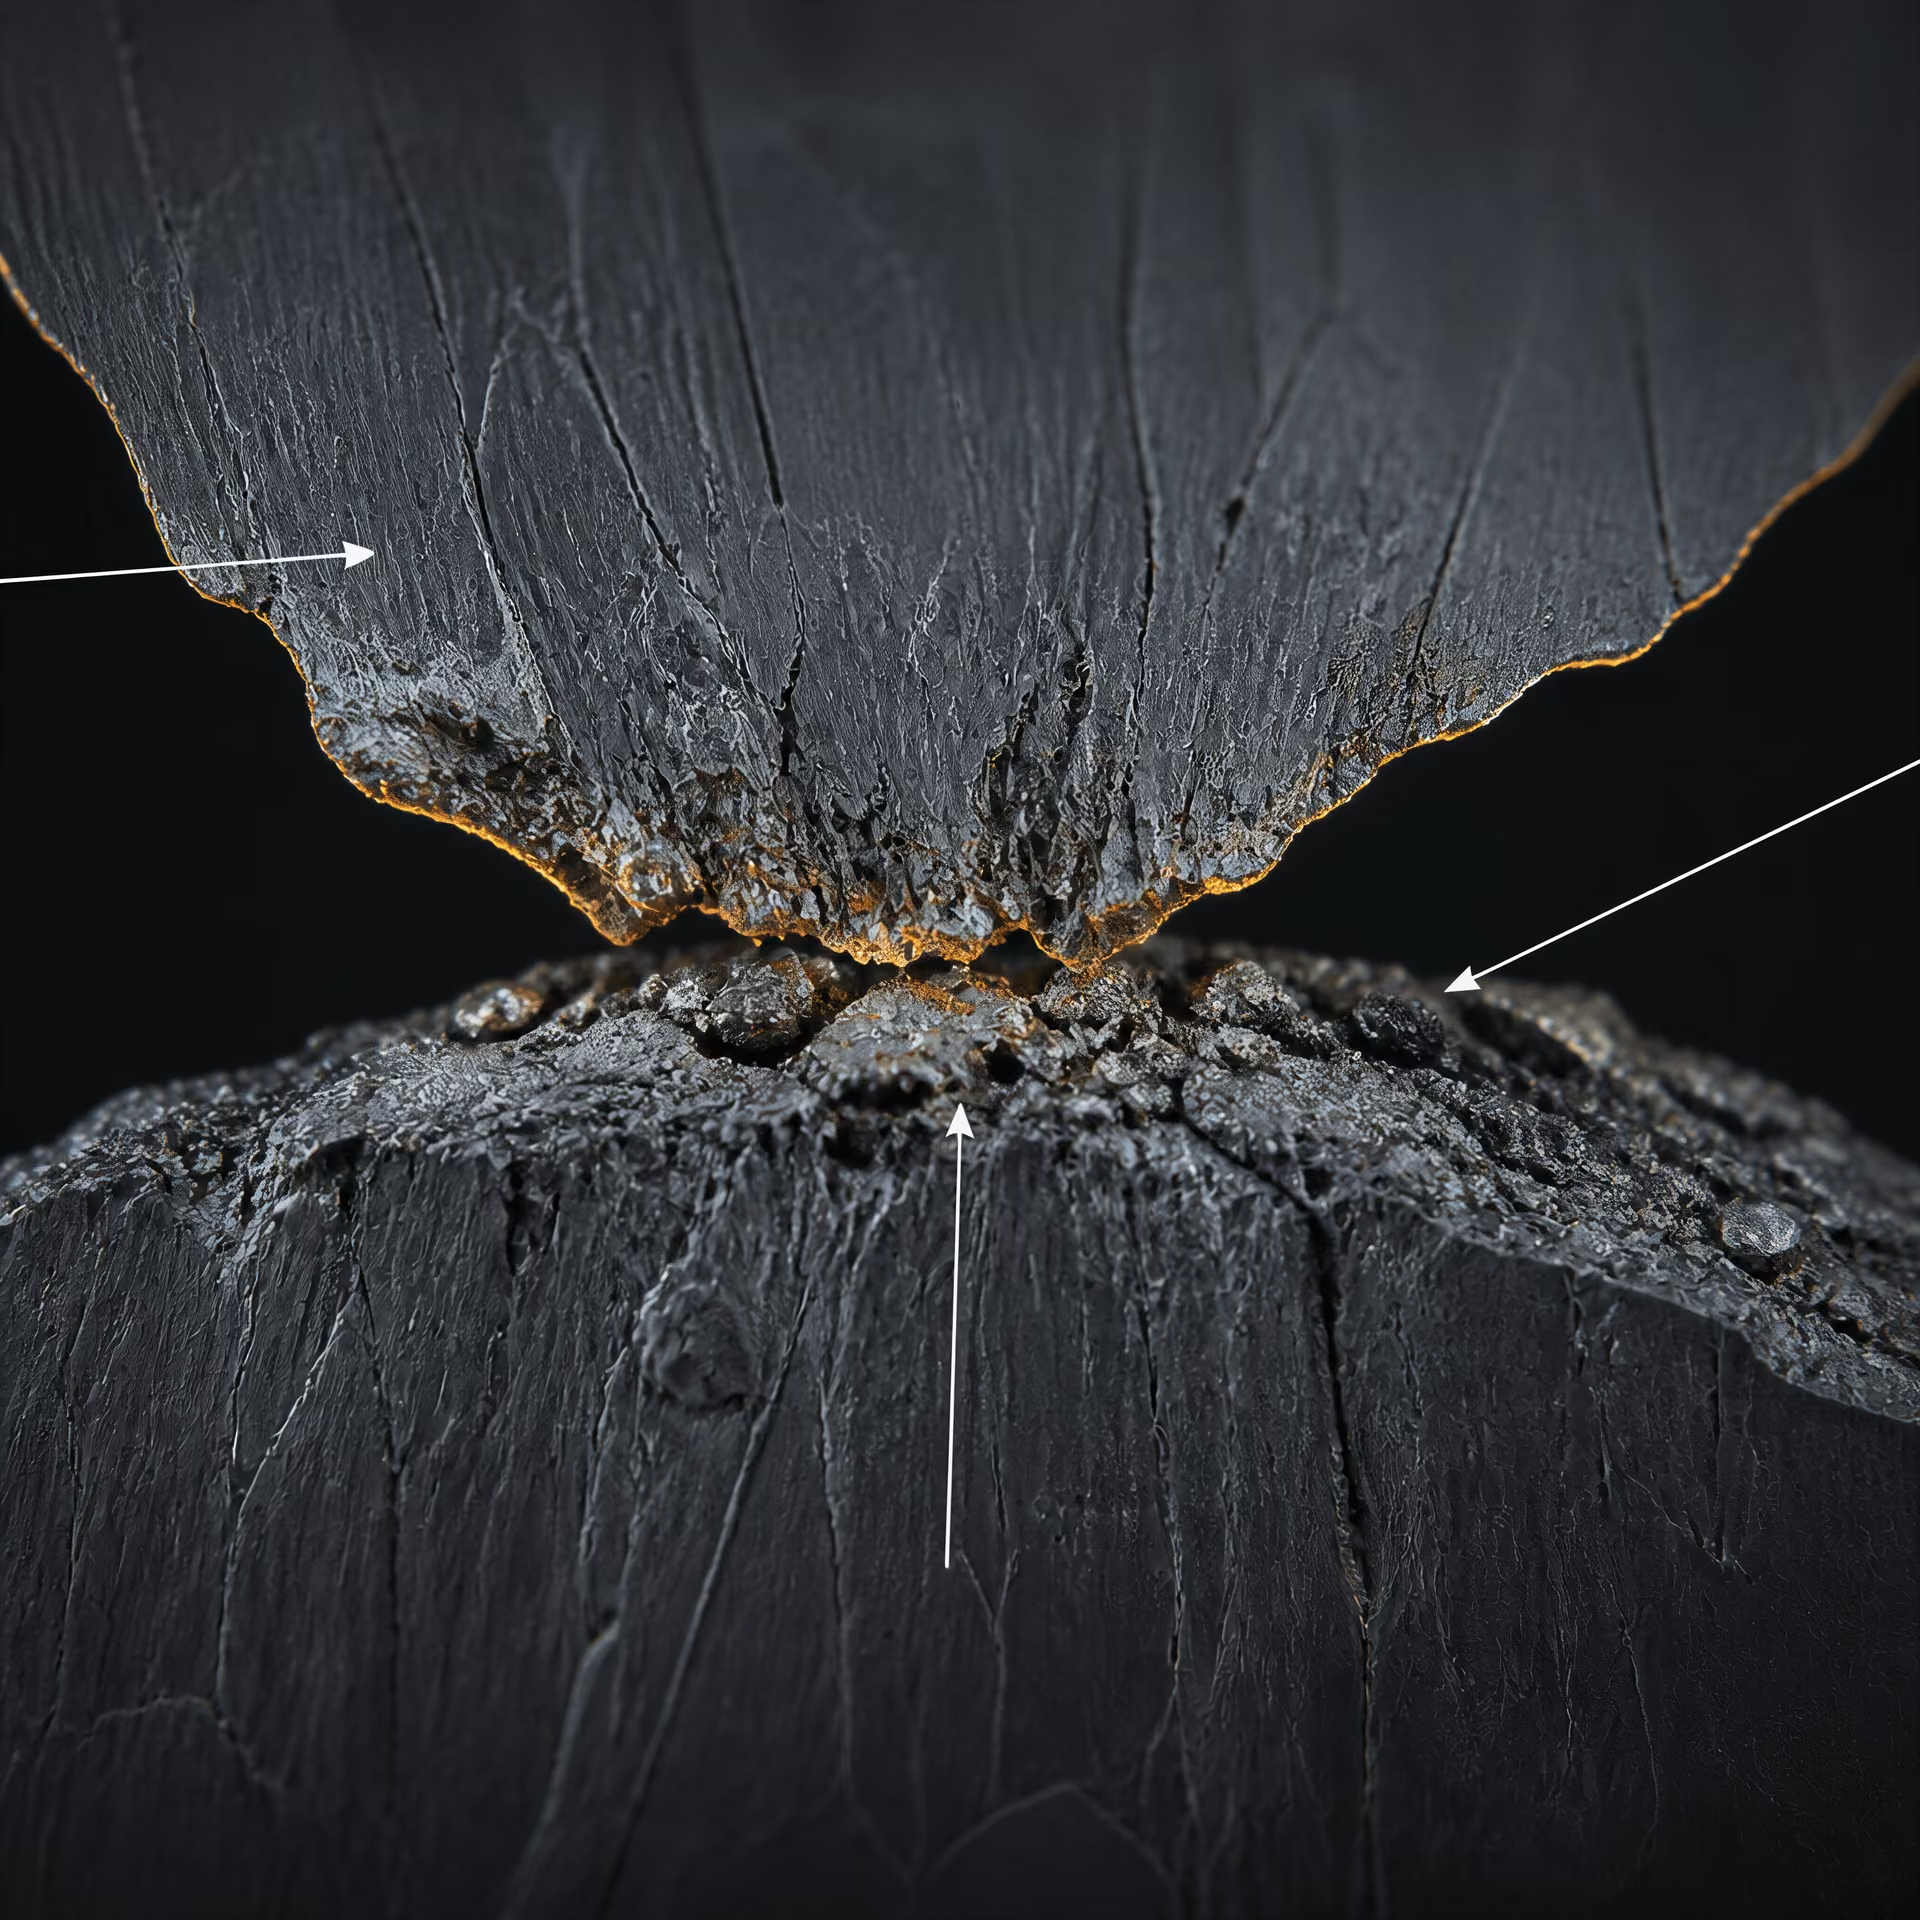
One reason is crack closure. Rough fracture surfaces, oxide debris, plastic deformation, and residual stresses can keep the crack faces in contact during part of the nominally tensile cycle. The crack then experiences a smaller effective opening range than the externally calculated suggests. Increasing generally reduces the portion of the cycle spent closed, although the response depends on steel microstructure, crack path, environment, specimen constraint, and loading history. also matters: near-threshold behavior, crack-tip damage, and approach to unstable fracture cannot be represented by alone.
This is why identical nominal stress ranges can produce different rates. Geometry can change ; crack length can change ; a different can change closure and ; and residual stress can shift the local cycle. ASTM E647-23 and ISO 12108:2018 also use different threshold and decreasing- criteria, as TWI notes, so a quoted is not automatically comparable across standards. The test record must identify specimen geometry, crack-length range, force ratio, environment, threshold procedure, and validity limits.
Those details matter when data move from a laboratory curve into damage tolerance. AFGROW states that standard damage-integration data generally come from constant-amplitude tests on cracked specimens. Aircraft assessments under FAA AC 25.571-1D and 14 CFR 25.571 then combine crack-growth rules with repeated-load evidence, probable fatigue-damage locations, critical crack sizes, and inspection thresholds. The Paris constants are inputs to that chain—not substitutes for it.
ASTM E647: Scope, Specimens and Data Reduction
ASTM E647-23 is the principal U.S. framework for measuring fatigue crack-growth rates in metallic materials. Its scope extends from the near-threshold regime through Kmax-controlled instability, with results expressed using the linear-elastic stress-intensity-factor range, ΔK. That scope matters because a fatigue-crack-growth curve is not a single property read directly from a steel certificate. It is a result produced by a specified specimen, loading history, crack-measurement method, environment and reduction procedure.
Data reduction sequence
- 1. Pre-crack Introduce a controlled, sharp fatigue crack.
- 2. Cycle Apply the defined force range, force ratio and environment.
- 3. Measure Record crack length at selected cycle counts.
- 4. Calculate Determine da/dN and geometry-corrected ΔK.
- 5. Fit Fit a law only over a stated, valid region of the curve.
The test normally produces a relationship between crack-growth rate, , and the applied stress-intensity-factor range:
P. C. Paris and F. Erdoğan introduced this empirical relationship in their 1963 paper. On a logarithmic plot of against ΔK, is the slope and is the intercept when the equation is written in the usual form. Some reports use rather than for the exponent. The symbols are not the main issue. The test domain and data used to obtain them are.
Paris and Erdoğan argued for assessing crack growth over broad rate ranges and with multiple specimens, rather than presenting a narrow fitted segment as a universal law. That caution remains important for steel. A value of fitted in the central, approximately linear region of a log–log curve does not describe threshold behavior, rapid growth near fracture, overload retardation or every possible stress ratio.
Near-threshold through Kmax-controlled instability
ASTM International states that ASTM E647 covers determination of fatigue crack-growth rates “from the near-threshold regime through Kmax-controlled instability” (2023). In the lower-growth region, the central quantity is the threshold stress-intensity-factor range, ΔKth: the range below which a crack either does not propagate at the specified test conditions or advances too slowly for the defined measurement approach. Near threshold, small changes in crack closure, surface condition, residual stress, environment or load history can produce large changes in the apparent rate.
At the other end, Kmax becomes decisive. Kmax is the maximum stress-intensity factor in a cycle, and its increase can move the specimen toward static fracture or rapid unstable crack extension even when ΔK alone does not fully describe the condition. The middle region is where the Paris relation is most often applied, but that convenience should not be confused with complete coverage of the curve. Growth can depart from a straight line at both low and high ΔK.
ISO 12108:2018 describes a related test range, from ΔKth to the onset of rapid unstable fracture, primarily for isotropic metallic materials under predominantly linear-elastic mode-I loading at constant force ratio , where . ASTM E647 and ISO 12108 are not interchangeable labels for one identical procedure. TWI reported in 2024 that the standards use different threshold and decreasing-ΔK criteria. A result labelled “threshold” therefore needs the standard, loading sequence and acceptance basis identified.
Stress ratio is particularly important because crack closure and the effective portion of a cycle can change with . Two tests on the same steel, at the same nominal ΔK but at different stress ratios, may produce different rates. Frequency can also matter through heating, environment-assisted cracking and time-dependent processes. For that reason, a usable ASTM E647 result records at least the specimen type, all principal dimensions, thickness, material orientation, loading frequency, environment, stress ratio and applied loading history. The steel’s condition must also be identified: product form, heat treatment, weld or base metal, and relevant microstructural state can affect both the measured curve and its scatter.
The test result is a measurement of crack extension under stated conditions. It is not automatically a structural allowable. Damage-tolerance work may require a threshold model, a near-threshold correction, a Kmax limit, a closure treatment or a different crack-growth rule. AFGROW’s 2024 Damage Tolerance Design Handbook states that data for standard damage-integration analyses generally come from constant-amplitude tests on cracked specimens, most of which are covered by ASTM E647. Structural analyses then integrate a selected growth law through a changing stress-intensity history; that later calculation is separate from the test itself.
Common cracked-specimen configurations
ASTM E647 testing uses specimens in which a deliberately introduced crack grows under a controlled cyclic load. The compact-tension specimen, commonly designated C(T), is widely used because it requires relatively little material and produces a strong, measurable crack-driving field. Its pin-loaded geometry also makes alignment and load-line effects important. The dimensions and thickness are not incidental reporting details: they influence constraint, plasticity, crack-front shape and the validity of a linear-elastic interpretation.
Middle-crack tension specimens, designated M(T), are useful when a broad ligament and a central crack are wanted, particularly for sheet, plate and weld studies. NIST’s 2001 work on two ferrite–pearlite pipeline steels used curved M(T) specimens and examined the scatter in measured rates by attributing it to variation in the Paris-law constant . That study illustrates why a fitted constant can represent experimental and material variability as much as a fixed feature of the steel.
Single-edge-notched tension and bending arrangements, often written SEN(T) and SEN(B), are also encountered in fatigue-crack-growth work, although the precise designation and configuration must be stated rather than inferred from a photograph. Weldments may require a specimen orientation that places the crack relative to the weld metal, fusion boundary or heat-affected zone. Rolling direction matters in plate and sheet. So do transverse and longitudinal orientations, especially where inclusions, banding or anisotropic toughness influence crack advance.
A specimen’s thickness affects through-thickness constraint and the degree to which the crack front remains suitable for a plane-strain approximation. Thin material may show greater plasticity and crack-front variation; a thick specimen may provide higher constraint without making every other assumption valid. Curved specimens introduce their own geometry corrections. These effects are handled through the applicable stress-intensity-factor solution, not by comparing nominal force ranges alone.
The steel designation should remain attached to the result. “5% Ni steel weldment,” for example, is not equivalent information to a grade, product standard or weld procedure record. NIST reported a Paris power-law fit for fatigue-crack-growth data in 5% Ni steel weldments in 1976, identifying as the intercept and as the slope of the log–log plot. Such a result needs its weld location, orientation, environment and load ratio before it can be compared with data from a plate or pipe steel.
Incremental crack measurement and rate calculation
The basic measurement is the increase in crack length over a measured number of cycles. Crack length may be tracked at intervals during cycling by an appropriate direct or indirect method, with the method and calibration recorded. The raw record is not yet a crack-growth rate. It contains force, displacement or compliance information, cycle count, crack-length estimates and possible measurement noise.
Data reduction converts successive crack-length observations into an incremental rate, conceptually:
The corresponding ΔK is calculated from the applied load range, crack length, specimen geometry and dimensions through the stress-intensity relation applicable to that configuration. Each reduced data point therefore couples a measured crack length to a geometry-corrected driving force. It is not acceptable to copy a force range from one specimen and compare it directly with ΔK from another.
The analyst then examines the -versus-ΔK data, checks for invalid or unstable portions, and fits a law only over the stated region. A Paris fit is usually made to the approximately linear middle section on logarithmic axes. Its units depend on the units selected for crack length, cycle count and stress intensity, so values cannot be compared without unit conversion. Scatter should be shown or quantified rather than hidden by a single fitted line.[4] 14 CFR 25.571: Damage-tolerance and fatigue evaluation of structure. Electronic Code of Federal Regulations. 14 CFR, 2024.
This distinction controls later engineering decisions. FAA AC 25.571-1D places crack-growth analysis, test-supported repeated-load evaluation and inspection planning within transport-airplane damage-tolerance guidance. Under 14 CFR 25.571, damage-tolerance evaluations address probable fatigue-damage locations and modes, repeated-load analyses supported by test evidence, and crack-growth-based inspection thresholds where applicable. ASTM E647 supplies one essential experimental foundation, but the resulting constants acquire engineering meaning only after their specimen, conditions, uncertainty and intended damage-tolerance use have been stated.
ISO 12108:2018 and Its Relationship to ASTM E647
Fatigue-crack-growth testing is a measurement procedure before it becomes a material model. The measured quantity is usually , the crack extension per load cycle, plotted against the linear-elastic stress-intensity-factor range, . The familiar Paris law,
was introduced by P. C. Paris and F. Erdoğan in 1963. On a log–log plot, is the slope and is the intercept, although some reports use instead of . Those constants describe a selected test dataset under specified conditions; they are not automatically transferable material properties.
That distinction matters when comparing ISO 12108:2018 with ASTM E647-23. Both standards address fatigue-crack-growth rates, but they do not prescribe identical routes to the same dataset. Their definitions, threshold methods, decreasing- procedures, specimen requirements and acceptance criteria can affect the fitted curve, especially near the threshold region.
ISO scope and stated loading assumptions
ISO 12108:2018 specifies tests for determining fatigue crack-growth rates from the threshold stress-intensity-factor range, , to the onset of rapid unstable fracture. Its stated field is primarily isotropic metallic materials subjected to predominantly linear-elastic, mode-I loading at constant force ratio , where
This scope is important for steel testing. A ferritic–pearlitic pipeline steel, a quenched-and-tempered structural steel, and a weld metal may all be called “steel,” yet their crack-growth response can differ with microstructure, weld region, residual stress, environment and load ratio. ISO 12108 does not remove those variables. It establishes a controlled way to measure one response under defined conditions.
The linear-elastic assumption means that the applied stress-intensity factors are suitable descriptors of the crack-tip driving force. It becomes less secure when extensive plasticity develops, when the specimen is too small for the intended crack size, or when fracture occurs through mechanisms not represented by predominantly mode-I loading. Mixed-mode loading, variable-amplitude histories and substantial residual-stress effects require additional treatment rather than automatic substitution of a constant-amplitude ISO result.
ASTM E647-23 similarly covers fatigue-crack-growth-rate determination from the near-threshold regime through -controlled instability, with results expressed using . ASTM describes the test in a way that supports measurements across a broad crack-growth range, including the region where stable propagation gives way to rapid fracture. AFGROW’s 2024 Damage Tolerance Design Handbook states that data used for standard damage-integration analyses are generally obtained from constant-amplitude tests on cracked specimens, most of which are covered by ASTM E647.
Neither statement means that a standard test directly supplies the growth law for an aircraft fuselage, pressure vessel or bridge detail. Structural assessment must account for geometry correction factors, load spectra, crack-closure effects, residual stress, inspection capability and the chosen failure criterion. FAA AC 25.571-1D places crack-growth analysis and inspection planning within transport-airplane damage-tolerance evaluation, while 14 CFR 25.571 requires attention to probable fatigue-damage locations, repeated-load analyses supported by test evidence and applicable crack-growth inspection thresholds.
Threshold and decreasing- procedures
The threshold region is where apparently small procedural choices can produce large interpretive consequences. is not simply a fixed number that appears once a steel grade has been named. It depends on the force ratio, environment, frequency, specimen history, crack length, measurement resolution and the criterion used to decide that the crack has stopped or is growing below a specified rate.
A decreasing- test begins at a higher driving force and progressively reduces , commonly by changing the load range as the crack extends. The test seeks the point at which the measured growth rate reaches the adopted threshold criterion. This approach is efficient, but the result may be affected by crack-closure development, load-history effects and insufficient time for a crack to establish a steady response after each reduction. A threshold obtained during decreasing loading therefore cannot be interpreted without the procedure that produced it.
TWI specifically observes that ASTM E647 and ISO 12108 use different threshold and decreasing- criteria. That difference is not editorial. If two laboratories test nominally identical steel using the two standards, their reported values may differ because “threshold” has been operationally defined through different requirements for crack extension, rate measurement and load reduction. The discrepancy can then influence the lower end of a Paris-law fit and any life calculation that integrates the curve toward threshold.
The same caution applies to the upper end. ASTM E647 refers to the range through -controlled instability, whereas ISO 12108 identifies the onset of rapid unstable fracture. A test may contain a visually smooth -versus- trend until the crack approaches a condition where linear-elastic growth data no longer describe the controlling fracture process. Data near that transition should not be folded into a Paris fit merely because the axes remain logarithmic.
Paris and Erdoğan’s 1963 paper argued for assessing crack-growth behavior over broad growth-rate ranges and with multiple specimens. That position is stronger than the popular practice of fitting a narrow central segment and presenting and as universal steel constants. NIST’s 1976 report on 5% Ni steel weldments illustrates the conventional reporting language: is the intercept and the slope of the log–log plot. A 2001 NIST study of two ferrite–pearlite pipeline steels tested with curved M(T) specimens treated scatter in measured rates by attributing it to variation in the Paris-law constant . The statistical treatment is useful, but it also shows why a single fitted intercept can conceal substantial specimen-to-specimen variation.
Why standards cannot be treated as interchangeable recipes
ISO 12108:2018 and ASTM E647-23 address closely related engineering questions, not identical laboratory recipes. A result marked “ASTM E647” carries information about the ASTM procedure, its specimen configuration and its threshold or instability criteria. A result marked “ISO 12108” carries a different procedural history. Removing those labels leaves a number that may look comparable while hiding the conditions that produced it.
This is particularly consequential when data are transferred into damage-tolerance software. AFGROW and similar tools integrate a crack-growth relation over a structural stress history, often using a geometry-adjusted and a selected law. Integration amplifies systematic differences: a small change in the low-growth region can alter the predicted number of cycles before inspection, while a different treatment of the high- region can change the predicted approach to fracture.
The standards should therefore be compared before datasets are pooled. Check force ratio, environment, frequency, specimen type, crack-length measurement method, decreasing- history, threshold definition and the treatment of unstable growth. When the intended application involves a weld, anisotropic plate, variable-amplitude loading or significant plasticity, the laboratory result also needs an explicit justification for transfer to the structure.
There is no sound basis for declaring that ISO 12108 universally supersedes ASTM E647, or the reverse. The defensible choice is the standard whose scope and procedures match the material, loading and structural decision. If results from both are compared, their method dependence should be reported as part of the evidence, not treated as experimental noise.
Test Materials: Plate, Bar, Pipeline Steel and Weldments
Ferrite–pearlite pipeline steels[5] Fatigue Crack Growth Rates in Pipeline Steels Using Curved M(T) Specimens. National Institute of Standards and Technology. NIST publication, 2001.
Pipeline steel is not represented adequately by a single Paris-law curve. A useful example is the National Institute of Standards and Technology (NIST) study published in 2001, Fatigue Crack Growth Rates in Pipeline Steels Using Curved M(T) Specimens. The work tested two ferrite–pearlite pipeline steels with curved middle-crack-tension, or M(T), specimens. The curved geometry was selected to reproduce aspects of crack-growth testing in pipe while maintaining a controlled relationship between applied load and stress intensity.
The result matters less for the numerical constants than for the treatment of scatter. NIST analyzed the variation in measured crack-growth rates by attributing it to the Paris-law constant . In the usual expression,
is crack length, is the number of cycles, is the stress-intensity-factor range, is the intercept, and is the slope of a log–log plot of against . A change in shifts the fitted curve vertically; it does not mean that the steel has one exact, geometry-independent growth rate.
That distinction is important for ferrite–pearlite plate and pipe products. Ferrite provides the comparatively softer matrix, while pearlite colonies, banding and inclusions can influence crack deflection and local resistance. Thermomechanical processing may produce different grain structures through the plate thickness and different properties in the rolling and transverse directions. Pipe forming and seam-welding add further variables. Two steels with similar tensile strength and nominal chemistry can therefore produce different , , threshold behavior and scatter.
| Specimen or material example | Article-stated characteristic | Transfer limitation |
|---|---|---|
| Curved M(T) pipeline-steel specimen | Used for two ferrite–pearlite pipeline steels | Curvature and pipe-representative geometry affect calibration |
| C(T) specimen | Compact, pin-loaded crack-growth configuration | Constraint and stress-intensity solution differ from curved M(T) |
| 5% Ni steel weldment | Paris fit reported for weldment data | Weld region, residual stress and orientation must be retained |
The NIST M(T) study also shows why a curved pipe-representative specimen should not be treated as interchangeable with a compact-tension specimen cut from flat plate. Geometry affects crack-front constraint, compliance, stress-intensity calibration and the portion of the crack front exposed to the material’s local structure. The resulting data may still support a Paris fit, but the test description must identify the specimen form and calibration method.
ASTM E647-23 covers fatigue-crack-growth-rate determination from the near-threshold region through -controlled instability. ISO 12108:2018 specifies testing from to the onset of rapid unstable fracture, primarily for isotropic metallic materials under predominantly linear-elastic mode-I loading at constant force ratio . These are not interchangeable labels. TWI notes that ASTM E647 and ISO 12108 use different threshold and decreasing- criteria, so a reported threshold requires the standard and procedure alongside the value.
5% Ni steel weldments[6] Fatigue Crack Growth in 5% Ni Steel Weldments. National Institute of Standards and Technology. NBSIR 76-843, 1976.
The NIST report Fatigue Crack Growth in 5% Ni Steel Weldments, published as NBSIR 76-843 in 1976, demonstrates the same problem in welded material. Its data were fitted with the Paris power law, with described as the intercept and as the slope of the log–log -versus- plot. The notation differs from the more common , but the fitted relationship is the same type of empirical law.

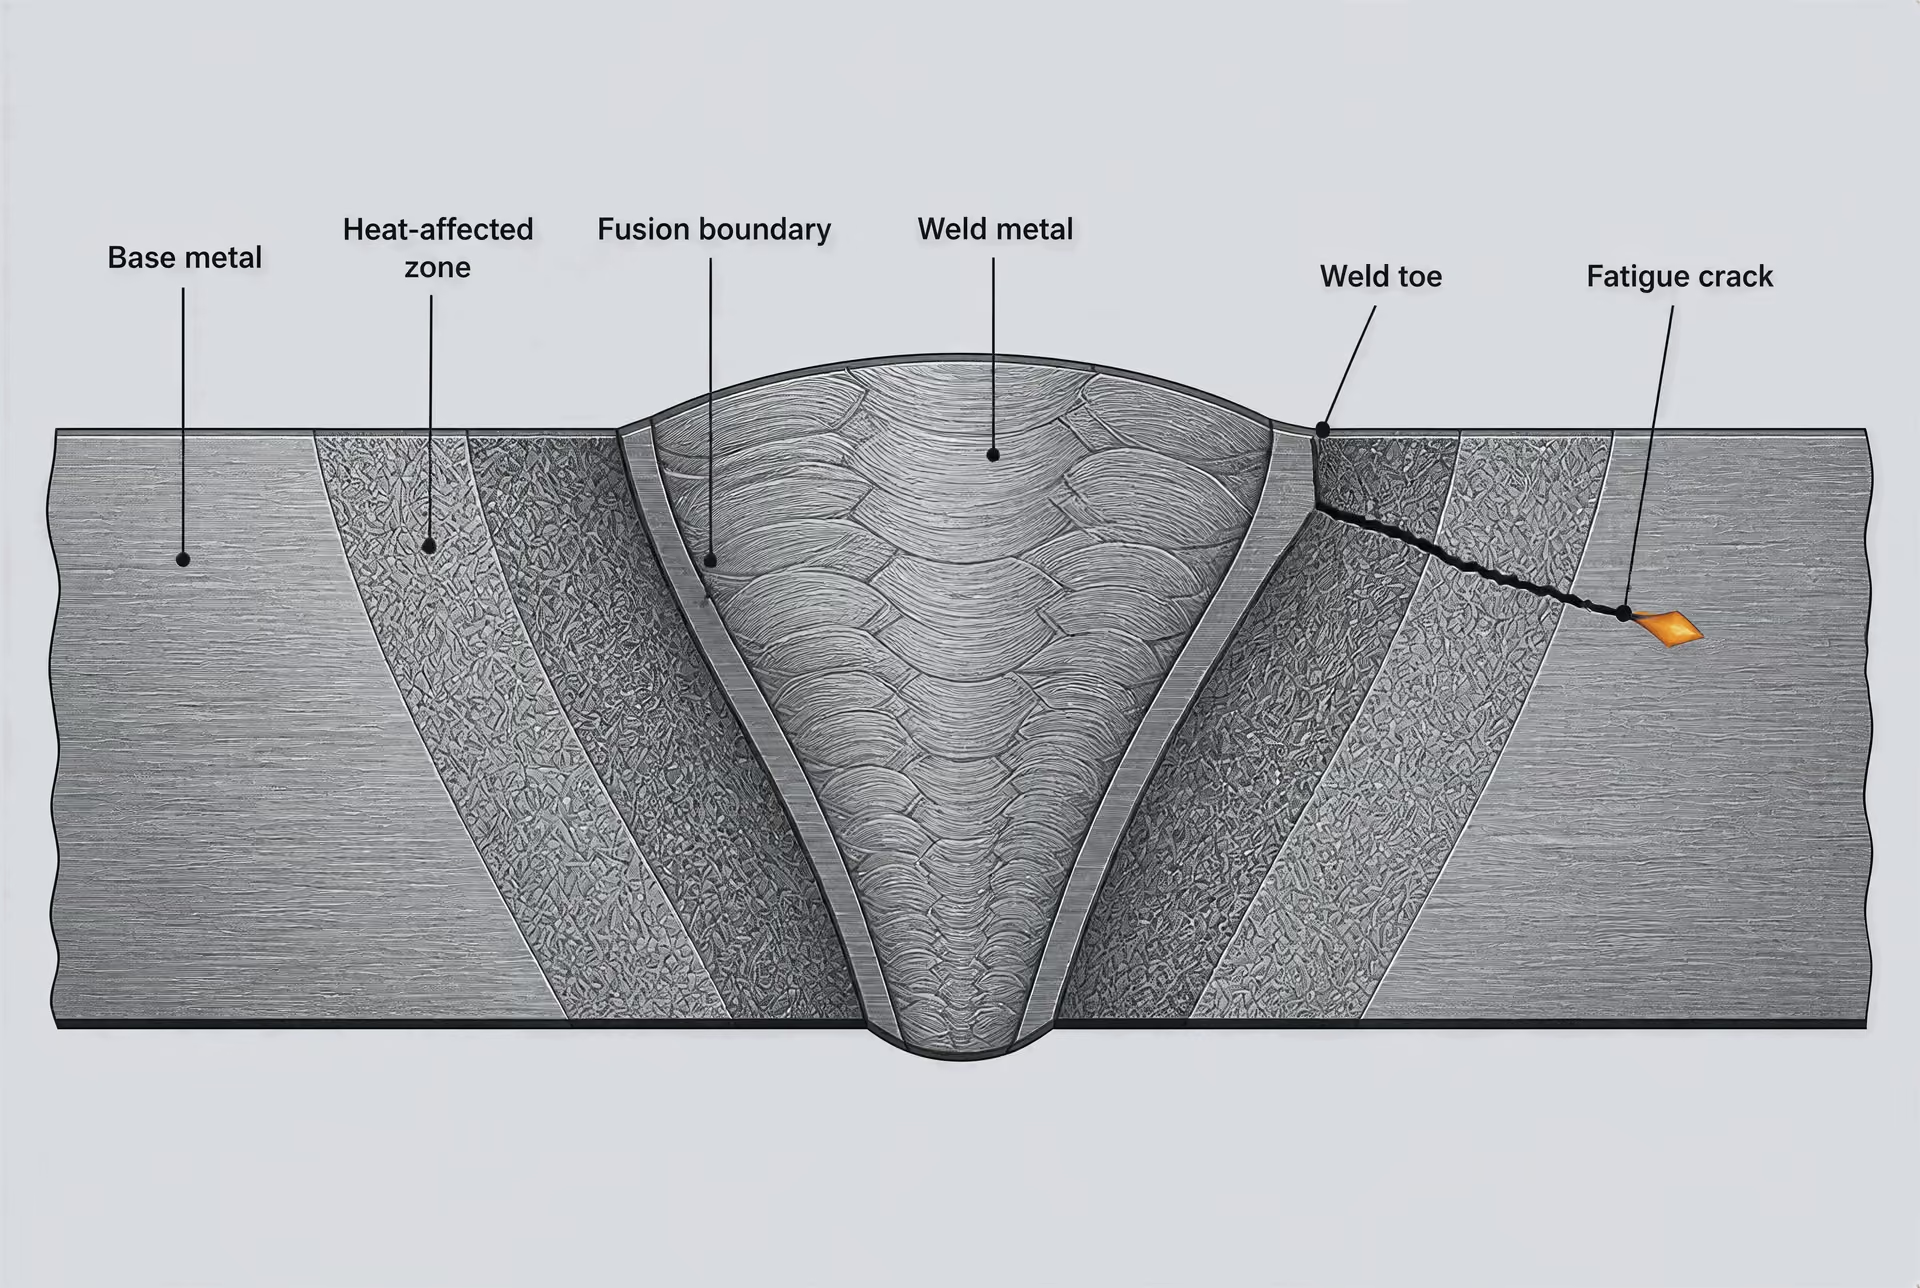
A weldment is a material system, not a single homogeneous steel. In 5% Ni steel, the base metal retains the parent plate’s processing history; weld metal solidifies from the molten pool and develops its own composition, segregation pattern and solidification structure; the heat-affected zone (HAZ) is thermally transformed without being remelted. Crack-growth resistance can change sharply across these regions. A specimen whose crack crosses the fusion boundary may show a rate controlled by the least resistant segment, by crack deflection at the boundary, or by residual-stress effects that are absent from an isolated base-metal test.
Consequently, a weldment result should state whether the crack propagated in base metal, weld metal, HAZ or across more than one region. It should also report weld process, filler classification, post-weld heat treatment, weld orientation and specimen extraction location. Calling the outcome a “5% Ni steel curve” conceals the very features that govern its use.
The curve-fitting step is not a substitute for material description. Paris and Erdoğan’s 1963 relationship was intended as an empirical description over a useful crack-growth-rate range, with assessment based on broad data sets and multiple specimens rather than on a narrow segment presented as a universal material constant. Near threshold, crack closure, roughness, residual stress and microstructural barriers can dominate. At high , , plasticity and unstable-fracture effects make a simple Paris fit unsuitable.
Microstructure, orientation and weld-region effects
Plate, bar and pipe should be identified by product form, grade, heat treatment and specimen orientation. For plate, common designations such as ASTM A516/A516M Grade 70 or ASTM A572/A572M Grade 50 do not by themselves define fatigue-crack-growth behavior; thickness, processing route, inclusion population and orientation still matter. A bar specimen may sample a longitudinally worked structure, whereas a transverse plate specimen can intersect elongated inclusions and ferrite–pearlite bands differently. The reporting convention should identify directions explicitly, such as L-T, T-L or S-L, rather than relying on “longitudinal” alone.
Anisotropy changes both crack-growth rate and the validity of a stress-intensity calibration. Crack-front shape can become irregular when the advancing front encounters bands, prior-austenite grain structures, inclusions or weld-metal dendrites. This can complicate crack-length measurement and increase apparent scatter without changing the underlying cyclic loading.
Residual stress is equally consequential in weldments and formed pipe. The nominal force ratio does not fully describe the local effective ratio when tensile or compressive residual stress is present. Machining a specimen can relax that stress; retaining the as-welded condition can preserve it. Those choices alter closure, , threshold measurements and sometimes the apparent Paris slope.
For structural assessment, the tested curve is an input, not a complete prediction. AFGROW states that standard damage-integration data generally come from constant-amplitude tests on cracked specimens, most commonly under ASTM E647 procedures. The FAA/Volpe National Transportation Systems Center damage-tolerance framework and FAA AC 25.571-1D connect such data to crack-growth analysis, repeated-load evaluation and inspection planning. Under 14 CFR 25.571, those assessments must address probable fatigue-damage locations and modes, test-supported loading evidence and applicable crack-growth inspection thresholds. A defensible steel curve therefore carries its specimen geometry, environment, force ratio, orientation, weld region, residual-stress condition and fitting range with it. Without those variables, and are coordinates on a plot—not portable properties of “steel.”
Specimen Geometry and Loading Practice
A fatigue-crack-growth rate is not a free-standing property measured independently of the test piece. It is calculated from the observed crack extension and the stress-intensity-factor range, ΔK, obtained from a geometry-specific solution. Change the specimen shape, crack location, thickness, loading arrangement or force ratio, and the reported value of may change even when the steel is unchanged. The fitted Paris relation,
therefore describes a test configuration and a defined range of conditions, not a universal constant for a grade of steel. Paris and Erdoğan introduced this relationship in 1963, with as the intercept and as the slope of a log–log plot of crack-growth rate against ΔK. Some reports use rather than .
ASTM E647-23 covers fatigue-crack-growth-rate determination from the near-threshold regime through -controlled instability, while ISO 12108:2018 covers testing from the threshold range, ΔKth, to rapid unstable fracture. Both standards are concerned primarily with predominantly linear-elastic, mode-I loading, but their threshold and decreasing-ΔK procedures differ. TWI specifically identifies those differences between ASTM E647 and ISO 12108. A result is consequently inseparable from the standard and procedure used to produce it.
Compact-tension and middle-crack tension concepts
Compact-tension, or CT, specimens place a machined starter notch and fatigue-precrack between two loading holes. The applied force opens the crack in mode I, and the crack length is measured as it advances through the ligament. ASTM E647 provides a stress-intensity solution for the CT geometry, commonly written in the form
where is force, is thickness, is a characteristic width, is crack length and is the dimensionless geometry function. The exact expression and dimensional definitions must follow the standard; substituting a CT equation into another specimen type produces a formally precise but physically wrong ΔK.
Middle-crack tension, or M(T), specimens use a wide strip loaded in tension with a central crack, usually extending symmetrically from a slit or starter notch. Their stress-intensity solution accounts for crack length relative to specimen width and for the applied nominal stress. Unlike a CT specimen, the M(T) arrangement can represent a broad sheet or plate containing a central through-crack, which is useful when the intended structural problem involves tensile loading across a large ligament.
Most standard damage-integration data come from constant-amplitude tests on cracked specimens, as AFGROW states in its Damage Tolerance Design Handbook. The machine applies a repeated maximum and minimum force at a selected force ratio , while crack length is recorded over cycles. Constant amplitude does not remove the need to control , frequency, waveform, environment and crack-length range. It only defines the loading history more narrowly.
The crack must first be fatigue-precracked under controlled conditions. A saw-cut notch is not equivalent to a naturally sharpened fatigue crack: its tip radius, residual stress field and local plastic deformation can alter the early measurements. Data close to the notch are commonly rejected or treated cautiously until the crack has developed the required front and the prescribed validity conditions are met.
Curved M(T) specimens
A curved M(T) specimen provides an important example of why geometry deserves more attention than the Paris equation often receives. In a 2001 NIST study, fatigue-crack-growth rates were measured in two ferrite–pearlite pipeline steels using curved M(T) specimens. The curvature was selected to reproduce a pipe-wall or cylindrical-shell loading condition more closely than a flat strip would. The specimen therefore required a stress-intensity solution appropriate to its curved configuration, rather than a flat M(T) expression copied from a handbook.
NIST analyzed the scatter in measured rates by attributing it to variation in the Paris-law constant . That treatment is useful for uncertainty analysis, but it should not be read as proof that is a fixed material attribute. Some scatter can arise from crack-front shape, local microstructure, compliance measurement, alignment, residual stress and the accuracy of the curved-specimen calibration. A fit can absorb those effects into , or sometimes into the slope , without revealing their separate causes.
Curved M(T) testing also illustrates the difference between a measurement and a structural application. A crack-growth law fitted from a pipe-like specimen may support a pipeline assessment, but only after the analyst checks whether the component’s constraint, curvature, stress ratio, weld condition and environment match the test. The NIST report’s use of ferrite–pearlite pipeline steels is not a license to transfer its constants to austenitic stainless steel, quenched-and-tempered low-alloy steel or a welded joint.
Alignment, thickness and plasticity control
Misalignment introduces bending into a nominally tensile test. One side of the crack may then experience a different stress intensity from the other, producing a curved or uneven crack front and changing the local ratio. Grips, pins, specimen faces and loading axes must be checked so that the force passes through the intended line. Crack-front straightness should be examined during testing; a visibly skewed front is evidence that the assumed two-dimensional solution may no longer represent the specimen.
Thickness controls constraint. A thin specimen permits greater through-thickness plastic flow and may develop plane-stress behavior, while a sufficiently thick specimen more closely approaches plane strain. Plane strain raises crack-tip constraint and can reduce the influence of free surfaces, but it is an assumption requiring dimensional and loading checks, not an automatic consequence of using steel. Side grooves may help maintain a straight crack front, yet they also alter the effective geometry and must be included in the applicable calculation.
Linear-elastic fracture mechanics requires small-scale yielding: the crack-tip plastic zone must remain small compared with the ligament and other relevant dimensions. If the net-section stress approaches yield, or if the plastic zone becomes a significant fraction of the remaining ligament, ΔK alone is no longer an adequate description. Large plasticity can produce crack closure, blunting, tearing or mixed elastic–plastic growth. The test may still be valuable, but its result should not be presented as a conventional Paris-law measurement without qualification.
That boundary matters in design. FAA AC 25.571-1D and 14 CFR 25.571 place crack-growth analysis, repeated-load evidence, probable fatigue-damage locations and inspection planning within transport-aircraft damage-tolerance evaluation. Such analyses depend on a crack-growth law whose specimen geometry, loading practice and validity limits are known before and are inserted into a structural calculation.
Threshold Testing and the Near-Threshold Regime
Operational meaning of ΔKth
The threshold stress-intensity-factor range, ΔKth, is not a single, freely transferable material constant. It is an operational result from a specified test: a crack is subjected to cyclic loading, the applied stress-intensity range is reduced or otherwise controlled, and the measured growth rate approaches a stated non-propagation criterion. The reported threshold therefore describes the boundary observed under that specimen geometry, stress ratio, environment, surface condition, frequency, loading history and data-reduction procedure.
This distinction matters because “no measured growth” does not necessarily mean that the crack has become physically incapable of advancing. A crack may grow for a short distance and then arrest, advance intermittently below the resolution of the measurement system, or produce a rate smaller than the test laboratory can separate from crack-length uncertainty. A threshold value is consequently tied to the duration and resolution of the observation as well as to the criterion selected for calling the crack dormant.
ASTM E647-23 covers fatigue-crack-growth-rate determination “from the near-threshold regime through Kmax-controlled instability,” with results expressed using the linear-elastic stress-intensity-factor range, ΔK. ISO 12108:2018 specifies testing from the threshold stress-intensity-factor range ΔKth to the onset of rapid unstable fracture, primarily for isotropic metallic materials under predominantly linear-elastic mode-I loading at constant force ratio R. These scopes overlap, but they do not make the standards interchangeable.
TWI specifically identifies different threshold and decreasing-ΔK criteria in ASTM E647 and ISO 12108. That difference can change the point at which a test report labels the crack-growth rate as threshold behavior. A value obtained to one standard should therefore retain its standard designation, specimen configuration and test conditions when it is compared with another value.
The near-threshold region is also outside the central assumptions of the Paris relationship. Paris and Erdoğan introduced the empirical form
in their 1963 paper. On a log–log plot of crack-growth rate against ΔK, C is the intercept and m—the symbol n is also used in some reports—is the slope. In the middle, approximately linear part of a growth-rate curve, this relation can describe data well. Near threshold, however, closure, microstructural barriers and measurement limits can dominate the apparent trend. A narrow fitted segment should not be presented as a complete description of steel behavior.
Load shedding and decreasing-ΔK methods
Threshold tests commonly reduce ΔK as the crack length increases, a procedure generally called load shedding or a decreasing-ΔK method. The machine lowers the applied force range in stages or according to a prescribed schedule so that the crack experiences progressively smaller driving force. Crack length is monitored after each increment, and the test continues until the measured rate meets the applicable threshold condition.
The method creates a practical problem: the crack carries a memory of its previous loading. If ΔK is reduced too quickly, the crack can retain a wake of plastically deformed material and remain closed during part of the nominal tensile cycle. If the reduction is too slow, the specimen consumes excessive cycles and may experience environmental exposure or microstructural changes unrelated to the intended threshold condition. The resulting rate is not simply a response to the final load level; it reflects the loading path.
Residual stress adds another complication. A welded steel specimen can contain tensile or compressive residual stresses that alter the local crack-driving force, even when the externally calculated ΔK appears unchanged. Machining marks, corrosion pits, weld irregularities and rough fracture surfaces can also create local barriers or promote premature advance. In a curved M(T) study of two ferrite–pearlite pipeline steels, NIST reported scatter in measured rates and analyzed that scatter by attributing it to variation in the Paris-law constant C. Such treatment is useful for damage calculations, but it does not turn the observed dispersion into a universal threshold value.
ASTM E647 and ISO 12108 specify different requirements for decreasing-ΔK and threshold determination. The distinction affects allowable load histories, acceptance of data and the interpretation of a crack that appears to stop. A laboratory report that states only “ΔKth =” without identifying the standard, R ratio, environment, frequency, specimen type and threshold criterion omits information needed to judge what the number represents.
For this reason, threshold results should be reported as test-defined crack-growth behavior rather than as a grade-wide property of “steel.” The same nominal grade can show different results in base metal, heat-affected material and weld metal. A 1976 NIST report on 5% Ni steel weldments fitted crack-growth data with the Paris power law and described C as the intercept and n as the slope; that notation illustrates how fitting conventions themselves must be recorded when data sets are compared.
Closure, environment and false non-growth
Crack closure is central to near-threshold interpretation. The externally calculated ΔK uses the applied minimum and maximum loads, but the crack may not open at the nominal minimum load. Rough fracture surfaces, oxide deposits, plasticity-induced wake effects, transformation products and tensile or compressive residual stresses can shift the effective opening load. The crack then experiences a smaller effective range than the nominal ΔK suggests. A low apparent threshold may therefore reflect closure rather than an intrinsic inability of the steel microstructure to propagate a crack.
R ratio, defined from minimum to maximum stress, changes both the nominal loading and the likelihood of closure. Frequency can matter as well. At low frequency, moisture, hydrogen, oxygen or other reactive species have more time to reach the crack tip. At higher frequency, environmental reactions may be suppressed, although heating and machine-dynamic effects can introduce other errors. Laboratory air, high-purity water, salt solution and service-specific environments can produce different near-threshold behavior. Temperature and humidity belong in the test record.
Surface condition is not a minor detail. A polished specimen, a machined specimen and a corroded or welded surface can generate different initiation and closure conditions. Crack-front curvature and nonuniform advance may also make the measured surface crack length a poor estimate of the effective three-dimensional crack size.
False non-growth is the practical danger. A crack can advance below the optical or compliance-resolution limit; a rough crack path can make its projected length appear unchanged; debris can bridge the faces; or a residual-stress field can temporarily arrest one portion of the front while another portion advances. A threshold procedure that records this state as zero growth may be appropriate for a specified engineering criterion, but it should not be mistaken for proof of permanent arrest.
AFGROW notes that fatigue-crack-growth data used for standard damage-integration analyses generally come from constant-amplitude testing of cracked specimens, most commonly under ASTM E647. Structural assessment then applies those data within a chosen crack-growth rule, load spectrum and inspection model. The FAA’s AC 25.571-1D and 14 CFR 25.571 place crack-growth analysis, probable fatigue-damage locations, test-supported repeated-load evaluation and inspection planning within transport-aircraft damage-tolerance practice. That chain of decisions is why ΔKth must be documented as a measurement outcome, not copied into an assessment as an unconditional material constant.
The Three Regions of a Fatigue Crack-Growth Curve
A fatigue crack-growth curve plots crack extension per load cycle, , against the stress-intensity-factor range, , usually on logarithmic axes. For a predominantly mode-I crack under linear-elastic conditions, the curve normally separates into three practical regions: growth near the threshold, an approximately straight power-law section, and rapid acceleration toward fracture instability. The boundaries are not fixed material constants. They shift with stress ratio , environment, specimen geometry, crack-closure effects, microstructure, residual stress, and the procedure used to produce the data.
This matters because a fitted Paris equation describes only the part of the curve from which its constants were obtained. It does not replace the measured curve.
Region I: near-threshold growth
At the low- end, the crack grows very slowly, and a small change in test conditions can produce a large change in the measured rate. The threshold stress-intensity-factor range, commonly written , is an operational boundary: below it, no sustained crack extension is detected under the specified test duration and procedure. It is not a universal point at which every crack in a steel component stops moving.
Near-threshold influences
- Crack closure Roughness, oxide debris, plasticity and residual stress can reduce the effective opening range.
- Environment Moisture, hydrogen and aqueous exposure can alter crack-tip processes.
- Frequency Cycle duration can change time-dependent environmental effects.
- Measurement resolution Small crack increments may be indistinguishable from instrument or derivative noise.
- Loading history Decreasing-ΔK sequences can leave a crack-growth memory.
Several effects complicate this region. Crack closure can reduce the effective portion of the cycle driving the crack. Rough fracture surfaces, oxide debris, residual stresses, and plasticity at the crack tip can all alter the apparent threshold. A threshold measured at stress ratio cannot automatically be substituted for one measured at . Humid air, vacuum, saltwater, and hydrogen-containing environments may also produce different rates, especially in susceptible high-strength steels and weldments.
The test method itself affects the reported threshold. ASTM E647-23 covers fatigue-crack-growth-rate determination “from the near-threshold regime through Kmax-controlled instability,” while ISO 12108:2018 specifies testing from to the onset of rapid unstable fracture, primarily for isotropic metallic materials under predominantly linear-elastic mode-I loading at constant force ratio . ASTM E647 and ISO 12108 do not use identical threshold and decreasing- criteria, as TWI points out. Comparing two published values without checking the standard, load history, environment, and stopping rule can therefore create a false material comparison.
A Paris fit extrapolated toward this region is especially misleading. Because the power law has no built-in threshold, it predicts a nonzero growth rate at every positive . The predicted rate may be far above the experimentally observed near-threshold rate, leading to an unnecessarily short calculated inspection interval. Conversely, a fit made from contaminated or poorly resolved near-threshold data can understate growth.
Region II: Paris-law behavior
In the middle portion of the curve, often follows an approximate power law:
P. C. Paris and F. Erdoğan introduced this empirical relationship in their 1963 paper. On a log–log plot, is the slope and is the intercept, although some reports use rather than for the exponent. NIST’s 1976 report on fatigue-crack-growth data for 5% Ni steel weldments describes as the intercept and as the slope of the log–log fit.
This is the region in which the Paris equation is most useful. The curve is sufficiently separated from threshold effects and from final fracture acceleration that a straight-line approximation can describe a meaningful interval of crack growth. Engineers can insert the measured relation into a damage-integration calculation, commonly integrating
while allowing the structural stress-intensity factor to change with crack size. AFGROW states that fatigue-crack-growth-rate data for standard damage-integration analyses generally come from constant-amplitude tests on cracked specimens, most of which are covered by ASTM E647.
Even here, and are not portable labels for a steel grade in isolation. They depend on the specimen configuration, thickness, crack orientation, stress ratio, load-control method, environment, data-reduction approach, and selected fitting interval. NIST’s 2001 study of two ferrite–pearlite pipeline steels tested with curved M(T) specimens analyzed measured-rate scatter by attributing it to variation in the Paris-law constant . That treatment is a reminder that scatter is part of the result, not merely an inconvenience to remove.
Paris and Erdoğan argued for assessing crack-growth behavior over broad growth-rate ranges and with multiple specimens. A narrow straight segment can produce a precise-looking slope while hiding substantial specimen-to-specimen variation or a change in mechanism. The equation is a useful model of a region, not a complete description of fatigue fracture.
Region III: acceleration toward instability
At high , the crack-growth rate rises above the middle-region power law and increases rapidly as the maximum stress intensity approaches the material’s fracture-toughness condition. The relevant control variable is often , not alone. Plasticity at the crack tip expands, the remaining ligament weakens, and stable cyclic extension gives way toward tearing or unstable fracture.
A Paris-law line extended into this region usually underpredicts the rate. That error can be severe because damage calculations are sensitive to the final part of the crack-growth history: a crack may spend many cycles in Region II but cross the remaining ligament quickly once acceleration begins. Models that include , fracture toughness, crack-closure behavior, or a separate near-fracture growth rule are more suitable when the assessment reaches this regime.
The complete curve is therefore a measurement record with boundaries, not a single straight line. ASTM E647-23 and ISO 12108:2018 both frame testing across the span from threshold behavior toward instability, even though their procedures differ. Structural assessments must then select the portion and crack-growth law appropriate to the actual component. For aircraft, FAA AC 25.571-1D and 14 CFR 25.571 connect crack-growth analysis with probable fatigue-damage locations, test-supported repeated-load evaluation, and inspection planning. The fitted Paris constants are inputs to that decision process—not substitutes for the threshold and instability portions of the curve.
Data Analysis, Scatter and Uncertainty
Fitting C and m or n
The Paris–Erdoğan relationship is usually written
where is the fatigue-crack-growth rate, is the stress-intensity-factor range, is the coefficient, and is the exponent. Some reports use instead of . The notation changes; the fitting problem does not. On logarithmic axes,
so , or , is the slope and is the intercept for the selected units.
That last qualification controls the result. is not a unit-independent material constant. Changing the units of , the crack-growth rate, or the force cycle changes its numerical value, even when the physical data are unchanged. A fitted can also move when the selected interval changes, particularly if the interval includes the lower threshold transition or the upper regime where , crack closure, plasticity, and instability affect growth. The Paris equation is therefore a local empirical description of a portion of a crack-growth curve, not a complete description from threshold to fracture.
P. C. Paris and F. Erdoğan’s 1963 paper established the relationship as an empirical crack-propagation law, but their argument does not support extracting two “universal” constants from a few points. They called for crack-growth assessment over broad rate ranges and with multiple specimens. A single-specimen regression over a narrow interval can produce an attractive straight line while giving a poor estimate of the behavior needed for life prediction.
The data reduction begins before regression. Crack length is measured at repeated load cycles, and the rate is obtained by a secant, incremental polynomial, or other derivative procedure. A small change in measured crack length divided by a large cycle interval suppresses random noise but can conceal curvature and local changes in growth. A short interval preserves local behavior but magnifies reading noise. Polynomial smoothing introduces another choice: polynomial order, window width, and treatment at the ends of the record. Different derivative methods applied to the same raw measurements can yield different values, especially near threshold where growth is slow.
The calculation has its own inputs. Specimen geometry, crack length, applied force range, thickness, and the applicable calibration expression all matter. ASTM E647-23 covers fatigue-crack-growth-rate determination from the near-threshold regime through -controlled instability, with results expressed using linear-elastic . ISO 12108:2018 covers testing from to the onset of rapid unstable fracture, primarily for isotropic metallic materials under predominantly linear-elastic mode-I loading at constant force ratio . TWI points out that ASTM E647 and ISO 12108 use different threshold and decreasing- criteria. A regression made from one standard’s data should not be compared with another as though the procedures were interchangeable.
Fit interval selection deserves explicit reporting. A fit restricted to the central Paris region may be appropriate for a calculation that stays in that region, but it should not be extended through threshold or near-instability behavior. Conversely, including all points in one least-squares line can force the equation to represent regimes for which it was not intended. Outliers require more than deletion by visual preference. A point may reflect a transcription error, unstable crack-front development, a load-control excursion, or genuine material behavior. Removing it without a recorded rule understates uncertainty.
Specimen-to-specimen scatter
Fatigue-crack-growth data vary between specimens even when nominal material, dimensions, and test settings match. Ferrite–pearlite pipeline steels illustrate the point. In its 2001 study of two pipeline steels tested with curved M(T) specimens, NIST analyzed “the scatter in the measured rates” by attributing it to the Paris-law constant . That treatment is useful because it converts a family of rate curves into a parameter distribution, but it should not be read as proof that every source of variation is physically a fluctuating . The assigned variation can also contain crack-length error, force-control variation, derivative noise, and model inadequacy.
Metallurgy contributes genuine variation. A crack may encounter ferrite grains, pearlite colonies, inclusions, banding, weld heat-affected zones, residual stress, or different local crack-front constraint. Texture and microstructural orientation alter crack deflection and closure. For 5% Ni steel weldments, a 1976 NIST report fitted fatigue-crack-growth data with the Paris power law and described as the intercept and as the slope of a log–log plot. Weld metal, fusion boundaries, and heat-affected material should not automatically be pooled into one population merely because they share a nominal steel designation.
Statistical scatter means that repeated observations differ around a chosen population model. Physical variability means that specimens or microstructural regions actually have different crack-growth behavior. Laboratory measurement error is different again: it is uncertainty introduced by the extensometer, compliance calibration, optical or electrical crack-length method, force measurement, cycle counting, alignment, or control system. These categories can overlap. For example, a crack-front irregularity can make the electrical potential signal less repeatable, producing apparent measurement scatter while also reflecting real three-dimensional crack behavior.
Specimen count affects both the fitted mean and the confidence placed in the tails. Two specimens cannot establish the frequency of a slow-growth or fast-growth response with much confidence. Multiple specimens reveal whether curves are roughly parallel, whether varies while remains similar, or whether the slope itself changes. A pooled regression can hide these patterns. A hierarchical analysis, or at least separate specimen fits followed by a documented summary, distinguishes within-specimen residual variation from between-specimen variation.
Load control is part of this evidence. The intended force ratio , force range, waveform, frequency, and cycle count must remain within the stated procedure. A brief overload can change crack closure and retard subsequent growth; an under-controlled maximum force can shift the crack toward a different condition. Such a response is not simply random noise, and it should not be averaged away without recording the event.
Measurement uncertainty and conservative curves
Crack-length resolution is often the limiting measurement issue. If the instrument resolves only a small number of crack-growth increments over a cycle block, the calculated derivative may be dominated by quantization and operator judgment. Near , a reported rate can therefore carry large relative uncertainty even when the absolute crack-length error appears small. Resolution, calibration drift, crack-front curvature, compliance changes, and the chosen derivative algorithm should accompany the rate data.
A conservative curve must state what it is conservative against. A lower-bound curve may protect against underpredicting crack growth for a particular steel, orientation, , environment, specimen type, and rate interval. It does not automatically remain conservative after changing thickness, weld condition, temperature, corrosion exposure, or load spectrum. One method is to fit a mean relation and add a statistical margin based on residual scatter. Another is to use an upper prediction bound for , allowing for uncertainty in both the regression and the population of specimens. The selected confidence or tolerance level matters; “lower bound” without that information has no reproducible statistical meaning.
For structural assessment, conservatism also depends on how the curve is integrated. AFGROW states that data used for standard damage-integration analyses generally come from constant-amplitude tests on cracked specimens, most covered by ASTM E647. Service loading is rarely a constant-amplitude sequence, so the analyst must decide how to handle overloads, load interaction, changing , residual stress, and transitions between crack-growth regimes. A conservative Paris curve cannot repair an unsuitable damage model.
The FAA/Volpe National Transportation Systems Center damage-tolerance framework makes the same distinction between measured propagation data and structural decisions. FAA AC 25.571-1D addresses crack-growth analysis, inspection planning, and test-supported repeated-load evaluation, while 14 CFR 25.571 requires damage-tolerance evaluations to consider probable fatigue-damage locations and modes. The fitted and are inputs to those decisions, not the decisions themselves. Their uncertainty should be carried through the crack-growth calculation, inspection interval, and residual-strength assessment rather than hidden behind extra decimal places.
Environment, Frequency, Mean Stress and Variable Amplitude
Air, moisture and corrosive environments
Fatigue-crack-growth rate is a property of a defined test condition, not simply of a steel designation. A crack propagating in laboratory air may behave differently from one exposed to humid air, seawater, condensate, hydrogen-bearing gas or a cathodically protected electrolyte. Moisture can reduce crack-closure effects, promote anodic dissolution at the crack tip and assist hydrogen entry into susceptible steels. The measured rate may therefore increase, particularly near threshold, where small changes in crack-tip chemistry and closure can determine whether a crack advances during a cycle.
This is why TWI emphasizes obtaining crack-growth rates under environmental conditions relevant to the component. A test in dry laboratory air cannot automatically represent an offshore brace, a buried pipeline, a storage vessel containing wet gas or an aircraft structure exposed to atmospheric humidity. The environment also interacts with frequency: a slow cycle gives corrosion and hydrogen-related processes more time to act during each load excursion. A frequency that appears harmless in air may be non-conservative in a corrosive medium.
The specimen and test method still matter. ASTM E647-23 covers fatigue-crack-growth-rate determination from the near-threshold regime through Kmax-controlled instability, with results expressed using the linear-elastic stress-intensity-factor range, ΔK. ISO 12108:2018 specifies testing from the threshold stress-intensity-factor range, ΔKth, to the onset of rapid unstable fracture, primarily for isotropic metallic materials under predominantly linear-elastic mode-I loading at constant force ratio, R. These are not interchangeable environmental recipes. TWI specifically identifies different threshold and decreasing-ΔK criteria in ASTM E647 and ISO 12108. A reported ΔKth therefore needs its standard, load history, environment and procedure attached to it.
The Paris and Erdoğan relationship, introduced in 1963, is commonly written
where is crack extension per cycle, is the intercept and , called in some reports, is the slope of a log–log plot of crack-growth rate against ΔK. For 5% Ni steel weldments, a 1976 NIST report describes as the intercept and as the slope. Neither constant is independent of the test environment. A corrosive test can shift the curve, alter its slope and change the apparent threshold; it does not merely add a fixed correction to an air curve.
Frequency and load-history effects
The force ratio describes mean stress in fracture-mechanics form. At a fixed ΔK, changing R changes , , crack-tip plasticity and crack closure. Higher tensile mean stress commonly reduces closure and can increase growth, although the response depends on steel microstructure, weld residual stress, environment and the growth regime. Near threshold, R effects can be especially large. In the Paris region, they may be smaller but remain significant when the maximum stress intensity approaches a fracture or acceleration boundary.
Frequency adds another independent variable. In dry air, a steel test at 10 Hz may produce a similar rate to one at 1 Hz over part of the Paris region, but that similarity should be demonstrated rather than presumed. In water or a reactive electrolyte, the slower test can produce greater environmental assistance. A test with a hold period at maximum load is still more different: crack-tip creep, hydrogen transport, stress corrosion or sustained-load crack extension may occur during the hold, so counting only cycles can hide time-dependent damage.
Load history also changes the apparent rate. An overload can create a plastic wake behind the crack tip and increase closure, producing temporary retardation. The same overload may also cause local blunting or branching. An underload can remove closure and accelerate subsequent growth. Their effects depend on the overload ratio, R, crack length, material constraint and spacing between events. Sequence matters. A high-load block followed by low loads is not generally equivalent to the same blocks in reverse order.
These effects expose the limit of treating and as universal steel constants. A 2001 NIST study of two ferrite–pearlite pipeline steels tested with curved M(T) specimens analyzed “the scatter in the measured rates” by attributing it to the Paris-law constant . That approach describes uncertainty within a defined dataset; it does not prove that scatter, frequency, R, environment and spectrum effects can all be represented by one adjustable intercept. Residual stress in a weldment can also alter the effective mean stress without appearing in the externally applied force ratio.
Constant-amplitude data under service spectra
Most standard damage-integration analyses begin with constant-amplitude data from cracked specimens. AFGROW states that fatigue-crack-growth-rate data used for such analyses are generally obtained from constant-amplitude testing, with most tests covered by ASTM E647. This arrangement is practical: it separates measurement of from the later integration of a crack-growth rule through a structural stress history. It is not evidence that service loading is constant amplitude.
A Paris curve fitted to constant-amplitude results answers a limited question: how rapidly did a crack grow under the tested ΔK, R, frequency, environment, specimen geometry and data-reduction procedure? A service prediction asks a different question. It must account for the sequence of loads, changing geometry factor, residual stress, retardation, acceleration, threshold treatment and the possibility of instability at high . Applying
cycle by cycle can be reasonable within the Paris region when the load interaction effects are small and the calibration is appropriate. It becomes questionable near ΔKth, during overload sequences and near rapid fracture, where the Paris power law does not describe the full crack-growth curve.
Paris and Erdoğan argued for assessing crack growth over broad rate ranges and with multiple specimens, rather than presenting a narrow fitted segment as a universal law. That caution remains important for steel structures. A curve measured in air at one R and frequency may support interpolation within comparable conditions; it does not automatically support extrapolation to a wet, slow, variable-amplitude service spectrum. NIST’s separate treatment of fatigue-crack-growth data in 5% Ni steel weldments illustrates why the reported material form and weld condition must remain visible.
Transport-aircraft practice makes the distinction explicit. FAA AC 25.571-1D places crack-growth analysis, inspection planning and damage-tolerance evaluation within a test-supported compliance framework, while 14 CFR 25.571 requires consideration of probable fatigue-damage locations and modes, repeated-load analyses supported by test evidence, and crack-growth-based inspection thresholds where applicable. Structural assessment therefore uses a law selected for a defined purpose and validated against relevant loading, not a Paris fit detached from its test conditions.
Beyond Paris: Crack-Growth Laws Used in Damage Tolerance
The Paris–Erdoğan relationship is important, but it is not a complete description of fatigue crack growth. Their 1963 paper introduced the empirical form
where is crack-growth rate, is the stress-intensity-factor range, is the intercept-related coefficient, and is the slope of a log–log plot. Some reports use instead of . The equation is mainly a middle-regime description: it approximates the roughly straight portion of a log–log crack-growth curve, between near-threshold behavior and the rapid acceleration preceding fracture instability.
That limitation matters in damage-tolerance analysis. ASTM E647-23 covers fatigue crack-growth-rate determination “from the near-threshold regime through Kmax-controlled instability,” while ISO 12108:2018 specifies testing from to the onset of rapid unstable fracture. A fitted Paris line therefore represents only part of the measured behavior unless its range and intended use are stated. P. C. Paris and F. Erdoğan also argued for assessment over broad crack-growth-rate ranges and with multiple specimens, not for treating a narrow fitted segment as a universal material constant.
The later calculation is a structural-modeling decision. The selected law must match the test data, stress history, crack geometry, environment, stress ratio, and the failure criterion adopted for the component.
Threshold and fracture-instability corrections
At low , crack growth may approach a threshold rather than continuing according to a straight Paris line. A simple Paris extrapolation can predict growth where the test shows negligible or nonpropagating behavior. That is unsafe when it underestimates life, but it can also be excessively conservative when used outside its measured range. The threshold itself is not a single grade-wide number: it varies with stress ratio , crack-closure effects, surface condition, loading history, residual stress, temperature, corrosion, and test procedure.
Threshold measurement is also standards-dependent. TWI notes that ASTM E647 and ISO 12108 use different threshold and decreasing- criteria. Consequently, a value labeled should not be transferred between databases without checking how the test approached the threshold, how crack growth was verified, and whether the force ratio remained constant. ISO 12108:2018 is directed primarily at isotropic metallic materials under predominantly linear-elastic mode-I loading at constant force ratio ; those conditions define the meaning of the reported result.
At the upper end of the curve, crack growth accelerates as approaches the material’s fracture-toughness condition. A Paris fit can miss that curvature and may produce an unrealistically long residual life if integration continues toward a critical crack size. Damage-tolerance calculations therefore commonly impose a fracture-instability limit separately, using an allowable , a critical stress-intensity factor, a J-integral or elastic-plastic fracture criterion where appropriate, or a prescribed residual-strength requirement.
Some crack-growth laws include both threshold and instability terms. The NASGRO equation is a widely used example in aerospace crack-growth software; its terms modify the Paris-like numerator for threshold behavior and the denominator for the approach to fracture instability. Forman-type equations likewise introduce or a fracture-toughness term so that growth accelerates as the critical condition is approached. These are not automatic replacements for testing. Their parameters require a defined dataset, material condition, environment, and calibration method. A law that reproduces one steel’s compact-tension data may not reproduce weld-metal, heat-affected-zone, or full-scale structural data.
R-ratio and Kmax-sensitive models
The Paris form contains , but no explicit . Two tests with the same and different can have different rates because the maximum stress intensity, crack closure, mean stress, and plastic-zone history differ. This effect is especially significant in steels with appreciable closure, in welded structures with residual stress, and when service loading contains high tensile peaks.
A first extension is an -dependent correction to the Paris coefficient or exponent. Walker-type relations, for example, modify the effective range with a function of , commonly written in a form involving . The exponent is fitted, not supplied by the steel designation. Such a relation can describe a family of constant-amplitude tests, but it should not be treated as proof that all load histories with the same nominal will behave alike.
Forman-type models place greater emphasis on , often combining a Paris-like term with a denominator that becomes small as approaches fracture toughness. NASGRO-style models add explicit treatment of threshold, stress ratio, and near-instability curvature. Other engineering rules, including mean-stress or closure-based corrections, may be selected when the available data support them. Their names do not remove the need to define units, crack geometry, force ratio, environment, and the upper-bound treatment of overloads.
The distinction is practical. A constant-amplitude test on a cracked specimen supplies a growth relation for a controlled loading path. A real aircraft or pressure structure experiences spectrum loading, retardation after overloads, residual stresses, and sometimes multiple interacting cracks. Applying an -ratio correction outside its calibration range can give a precise-looking but unsupported life prediction.
Rules discussed in FAA and AFGROW practice
The FAA/Volpe National Transportation Systems Center Damage Tolerance Assessment Handbook presents fatigue crack propagation as a family of usable rules rather than a single mandatory equation. Its framework introduces fracture mechanics, crack-growth data, spectrum integration, residual strength, and inspection intervals, with the selected growth law depending on the assessment purpose and available evidence. AFGROW similarly states that data used for standard damage-integration analyses are generally obtained from constant-amplitude tests on cracked specimens, with most such tests covered by ASTM E647.
In practice, an analyst may use a Paris relation for the measured middle regime, a threshold-corrected rule for small- growth, an -ratio or -sensitive equation for varying mean stress, and a fracture-instability criterion to terminate the integration. Software may offer Forman, Walker, NASGRO, tabular interpolation, or other options, but the menu is not a material specification. The analyst must document which rule was selected, how its coefficients were fitted, what data were excluded, and whether lower-bound or mean behavior is being used.
That discipline aligns with FAA AC 25.571-1D and 14 CFR 25.571. Transport-aircraft damage-tolerance evaluations address probable fatigue-damage locations and modes, repeated-load analyses supported by test evidence, crack-growth calculations, residual strength, and inspection planning. The governing question is not “What is the Paris constant for this steel?” It is whether the chosen crack-growth representation, combined with geometry, loading spectrum, uncertainty treatment, and inspection capability, supports the required structural decision.
NIST examples show why the distinction persists. A 2001 study of two ferrite–pearlite pipeline steels used curved M(T) specimens and analyzed measured-rate scatter by attributing it to the Paris-law constant . A 1976 NIST report on 5% Ni steel weldments described as the intercept and as the slope of the log–log fit. Those fitted quantities describe particular experiments and material conditions. They do not convert Paris law into an independent property of every component made from the same nominal steel grade.
From Crack-Growth Data to Damage-Tolerance Assessment
Crack-growth integration from initial to critical size
A fatigue-crack-growth test produces a rate relation; a damage-tolerance assessment uses that relation to predict structural life. Those are different operations. The measured quantity is usually crack extension per cycle, , while the assessment must determine how many service cycles are required for a crack to grow from an assumed or detected initial size to a limiting size .
For the Paris region, the commonly used relation is
where is the intercept and , called in some reports, is the slope of a log–log plot of against . P. C. Paris and F. Erdoğan introduced this empirical relationship in their 1963 paper. It is useful, but only within the range represented by the data. It does not by itself describe threshold behavior, crack closure effects, near-instability growth, or every loading sequence.
The integration step combines the measured relation with a stress-intensity solution for the actual structural detail:
Here, represents geometry, crack shape, free surfaces, fastener holes, weld toes, stiffeners, and other boundary effects; is the applied stress range. Substitution gives
for constant-amplitude loading in the Paris regime. The result is a calculated number of cycles, not a material constant. Change the crack geometry, stress ratio, residual stress field, environmental condition, or assumed starting flaw, and the predicted life changes even when and remain unchanged.
Real service spectra require the calculation to proceed load block by load block. For each stress range and maximum stress, the analyst calculates , , and , selects a crack-growth rule, advances the crack, updates the geometry factor, and repeats the process. AFGROW states that fatigue-crack-growth-rate data used for standard damage-integration analyses are generally obtained from constant-amplitude tests on cracked specimens, with most such tests covered by ASTM E647. The service-life model therefore extends laboratory results into a variable-amplitude problem; it does not simply reproduce the test.
The selected rate law must also match the part of the curve being traversed. ASTM E647-23 covers determination of fatigue crack-growth rates from the near-threshold regime through -controlled instability. ISO 12108:2018 specifies testing from the threshold stress-intensity-factor range, , to the onset of rapid unstable fracture, primarily for isotropic metallic materials under predominantly linear-elastic mode-I loading at constant force ratio . TWI reports that ASTM E647 and ISO 12108 use different threshold and decreasing- criteria. Consequently, a threshold value cannot be transferred between standards without checking how it was established.
The upper endpoint is equally important. As the crack grows, may approach the material’s fracture toughness or a reduced allowable value for the relevant constraint, temperature, thickness, and environment. The critical size is therefore set by a residual-strength requirement, not merely by the end of a Paris-law fit. For a simple linear-elastic check, the condition may be expressed as
but may be lower than a laboratory value when plasticity, geometry, interaction with another crack, corrosion, or unstable tearing affects the structure. Residual-strength analysis asks whether the cracked component can still carry the specified limit or ultimate load. Crack-growth integration asks how long it takes to reach the size at which that requirement is no longer met. Both are necessary.
Initial flaw assumptions control the first part of the integral. A welded steel detail may be assessed from a weld toe or lack-of-fusion indication; a rolled plate may be assigned a manufacturing flaw, corrosion pit, or inspection-sized crack; a machined specimen may start from a deliberately sharp fatigue precrack. The assumed flaw must be tied to manufacturing quality, inspection capability, stress concentration, and the selected crack shape. Treating as an arbitrary small number can produce a large and unjustified life increase because the early-growth portion may occupy many cycles, particularly near threshold.
Inspection thresholds and intervals

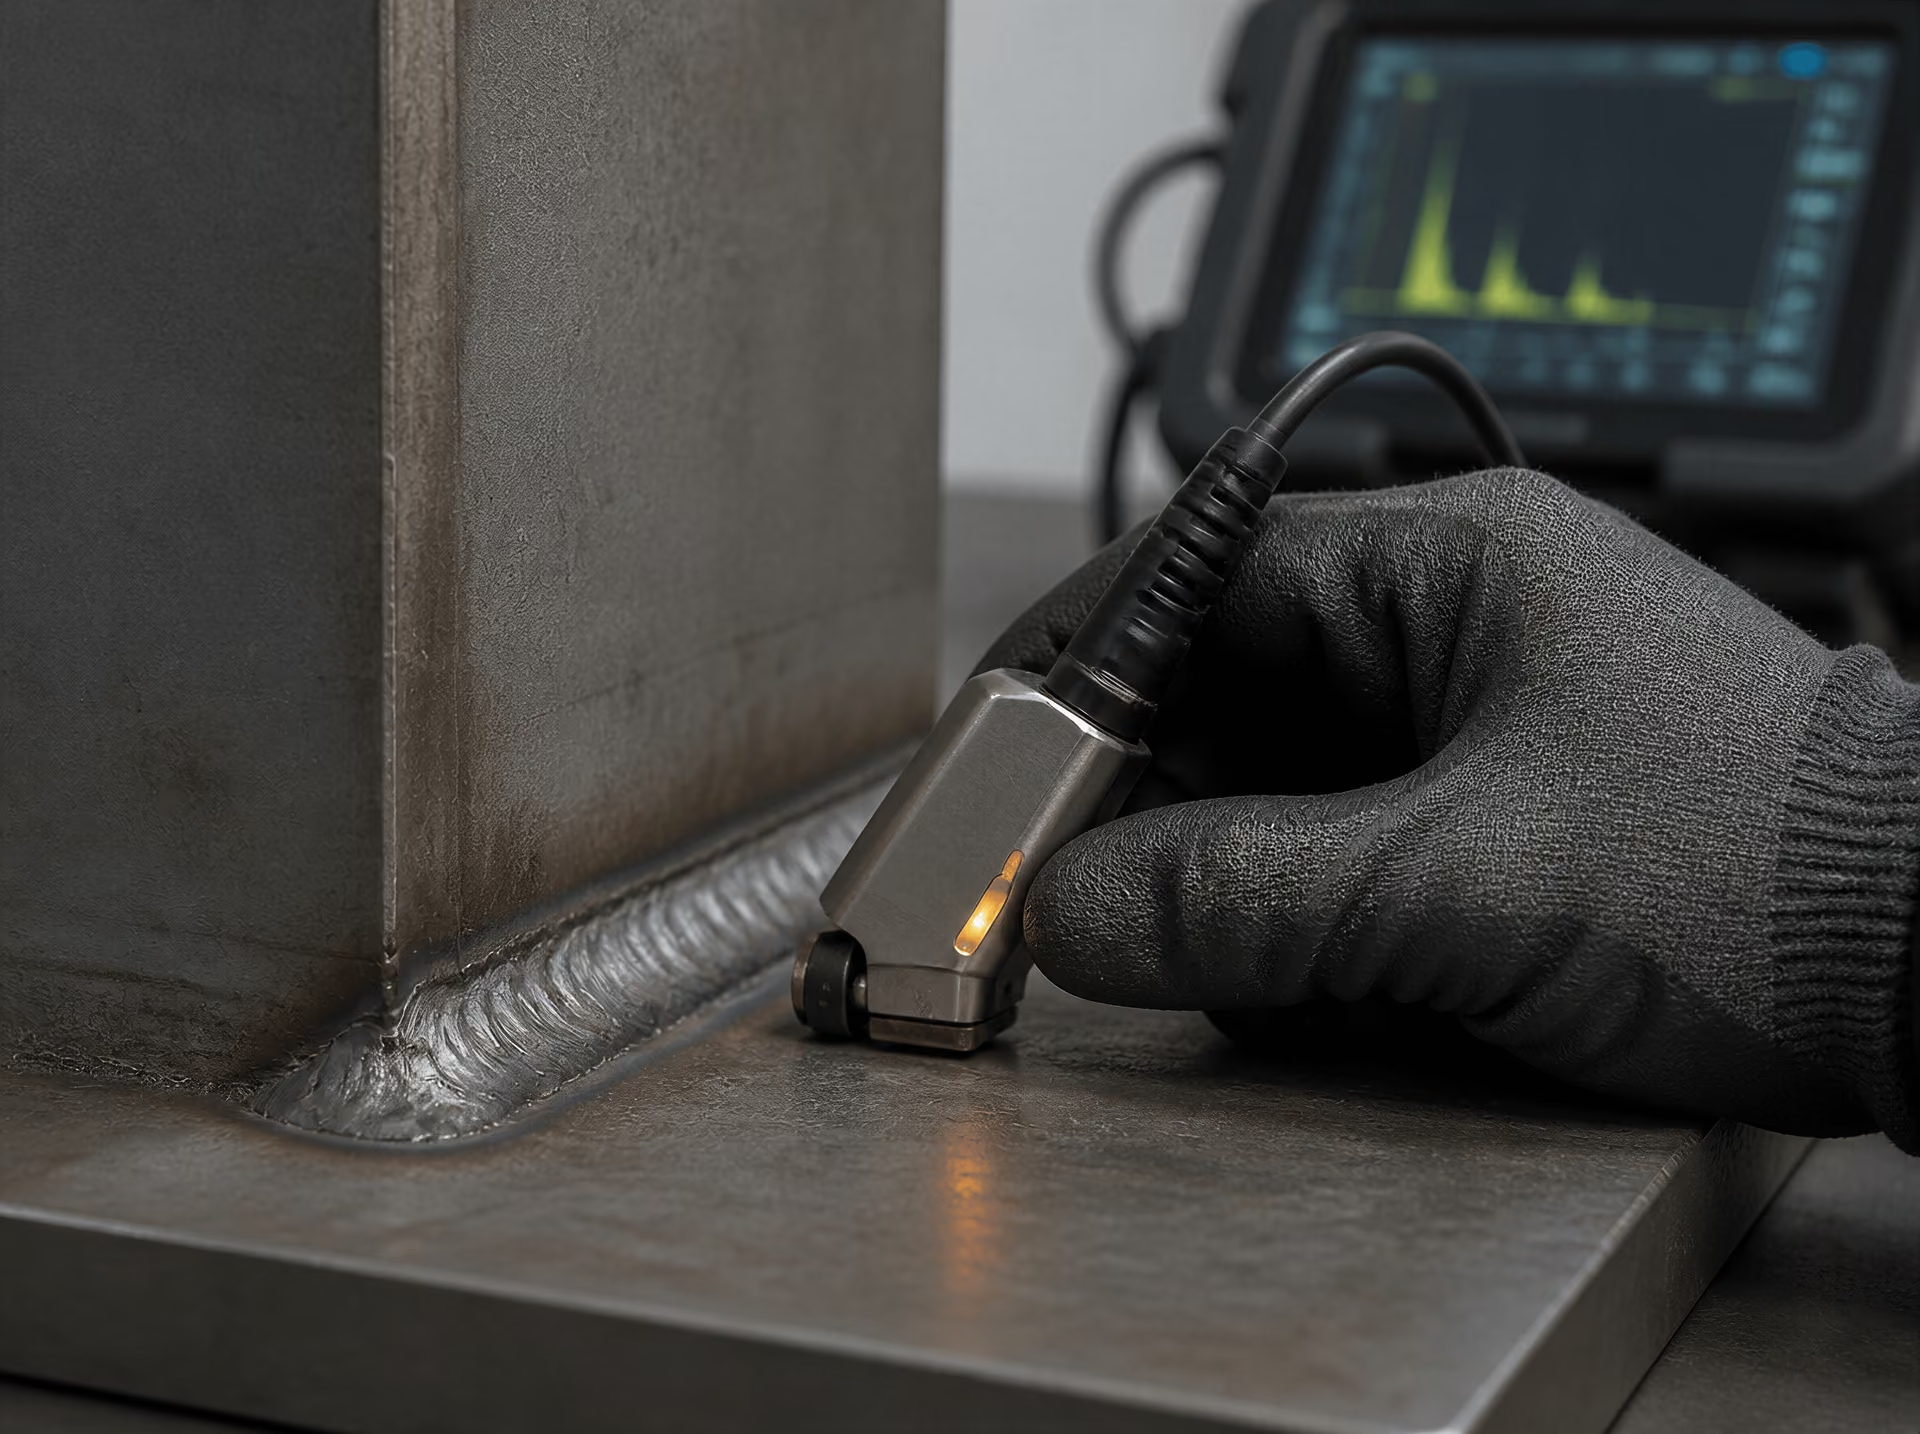
An inspection program turns the crack-growth calculation into a maintenance decision. The inspection threshold is the crack size or detectable damage condition at which an inspection method is expected to find a relevant flaw with the required probability. It is not automatically . A crack can be below the threshold-growth regime and still be structurally significant if residual strength is low, if a neighboring crack may link with it, or if the inspection method cannot reliably resolve its size.
| Assessment stage | Question answered | Typical controlling information |
|---|---|---|
| Initial flaw a0 | What flaw or detected crack is assumed? | Manufacturing quality, inspection capability and crack shape |
| Detectable size adet | When should inspection find it? | Inspection method, sizing error and detection probability |
| Critical size ac | When is residual strength no longer adequate? | Kmax, fracture resistance, geometry and applied load |
| Integration | How many cycles separate the sizes? | Crack-growth law, spectrum, geometry and uncertainty |
The interval must leave sufficient margin between detectable growth and the critical condition. A simplified sequence is:
The calculated cycles from to describe the opportunity for the flaw to become detectable. The cycles from to provide the available inspection interval, subject to safety factors, spectrum uncertainty, sizing error, missed detection, and the consequences of unstable fracture. An assessment may require the interval to be shorter than the nominal calculated growth period so that a crack found near the detection limit is repaired before reaching .
Crack-growth scatter must be handled explicitly. NIST’s 2001 study of two ferrite–pearlite pipeline steels tested with curved M(T) specimens analyzed “the scatter in the measured rates” by attributing it to the Paris-law constant . That approach illustrates the issue: two nominally identical components may not follow the mean fitted curve. A conservative upper-bound curve, confidence limit, or probabilistic distribution may be selected instead, depending on the safety case. The 1976 NIST report on 5% Ni steel weldments described as the intercept and as the slope of the log–log fit, but those fitted parameters remain tied to the weldment condition, test procedure, and fitted range.
Inspection planning also depends on the failure mode. A through crack in a tension panel, a surface crack at a weld toe, and multiple cracks near a fastener hole do not share one geometry factor or one detection problem. Crack interaction, crack turning, residual stresses, repair details, and load redistribution may require a model beyond a single isolated-crack Paris calculation.
FAA AC 25.571-1D and 14 CFR 25.571
Transport-aircraft damage tolerance places this calculation inside a larger compliance framework. FAA AC 25.571-1D provides guidance for damage-tolerance and fatigue evaluation of transport-airplane structures, including crack-growth analysis and inspection planning. The advisory circular is guidance rather than a replacement for the regulation, but it identifies the evidence and analytical links expected in a substantiated assessment.
The governing rule, 14 CFR 25.571, requires attention to probable fatigue-damage locations and modes, including sites where repeated loading, stress concentration, joints, cut-outs, attachments, or manufacturing details can initiate cracking. It also calls for repeated-load evaluations supported by tests where appropriate, rather than relying only on an abstract material curve. Test evidence can establish the behavior of representative structure, load paths, repairs, joints, and details that a compact-specimen result cannot capture.
Under this framework, the analyst defines likely flaw locations and sizes, applies representative flight and ground-load spectra, calculates crack extension, checks residual strength, and establishes inspection thresholds and intervals where inspection is the controlling safeguard. The damage-tolerance result is therefore a chain: a standards-defined crack-growth measurement, a geometry- and spectrum-specific integration, a residual-strength limit, and an inspection plan supported by test evidence. Paris-law constants enter that chain, but they do not define it.
Quality-Control Checklist for a Defensible Steel Test
A fatigue-crack-growth result is defensible only when another engineer can reconstruct what was tested, how it was tested, and where the reported equation stops being supported by measurements. ASTM E647-23 covers fatigue-crack-growth rates from the near-threshold regime through -controlled instability, while ISO 12108:2018 covers testing from to rapid unstable fracture. They are related standards, not interchangeable labels: TWI notes that ASTM E647 and ISO 12108 use different threshold and decreasing- criteria.
Material and specimen documentation
Record the steel designation exactly as certified. “Carbon steel” or “high-strength steel” is not enough. State whether the material is ASTM A36, ASTM A516 Grade 70, API 5L X65, EN 10025-2 S355J2, or another designation, and attach the material certificate, heat or cast number, product specification, and product form. Plate, hot-rolled bar, seamless pipe, welded pipe and forged product can have different microstructures, residual stresses and crack-growth behavior even when nominal strength values appear similar.
Minimum material and specimen records
- Material identity Grade, heat or cast number, product specification and product form.
- Location and orientation Sampling location and clear L-T, T-L or equivalent orientation.
- Condition Heat treatment, weld region, microstructure and residual-stress state.
- Geometry Specimen designation, thickness, width, ligament, notch and grip arrangement.
- Pre-crack Starter-notch method, pre-crack conditions, final length and crack-front checks.
The record should include product thickness, width, diameter where relevant, rolling direction, transverse direction and specimen orientation using a clear notation such as L-T or T-L. State the sampling location within the plate, pipe or weldment. For a welded specimen, identify the weld process, filler classification, weld metal, fusion boundary, heat-affected zone and parent-metal region. A “welded steel” result without the crack location is too vague for later structural use.
List the heat treatment in full: normalized, quenched and tempered, annealed, stress-relieved or as-received condition; treatment temperature and holding time should be retained when known. Include yield strength, ultimate tensile strength, elongation, hardness, chemical analysis and, where relevant, Charpy impact results. Metallographic observations should identify ferrite-pearlite, bainitic, martensitic or other relevant constituents rather than treating the grade name as a complete description.
Describe the specimen geometry by standard designation and dimensions. Examples include compact tension, C(T), middle-crack tension, M(T), and single-edge-notch bend, SE(B), with thickness, width, ligament, notch radius and grip arrangement. Record the machining method and final surface condition. State whether side grooves were used, their depth, angle and purpose. The NIST study of two ferrite-pearlite pipeline steels used curved M(T) specimens; that detail matters because curvature changes the stress-intensity calculation and cannot be removed from the result by quoting only and .
Document fatigue pre-cracking separately from the main test. Give the starter-notch method, pre-crack load ratio, frequency, waveform, maximum force, final pre-crack length and any required straightness or symmetry checks. A machined notch is not a fatigue crack. The transition from notch to naturally grown crack can affect the first reported data points.
Machine, environment and crack-monitoring records
Identify the test frame, load cell, grips, software version and calibration dates. Record force and displacement calibration, alignment checks, compliance verification and the method used to calculate stress intensity. State whether the force ratio was constant:
Also report frequency, waveform, maximum and minimum force, loading control mode, cycle-count method and interruptions. A constant-amplitude result is not automatically transferable to a variable-amplitude spectrum. AFGROW states that data used for standard damage-integration analyses generally come from constant-amplitude tests on cracked specimens, which makes the loading history part of the evidence rather than an incidental machine setting.
Environment requires the same precision. Record laboratory air or immersion, temperature, relative humidity, pressure where relevant, solution identity and concentration, pH, dissolved oxygen, flow rate, specimen preconditioning and exposure duration. For aqueous testing, name the compound rather than writing “salt water”: for example, sodium chloride concentration in grams per litre. State whether corrosion products, hydrogen charging, cathodic protection or inhibitor additions were present. Report whether the crack was tested under open-circuit or controlled electrochemical conditions.
Explain how crack length was measured: compliance, potential drop, optical microscope, travelling microscope, digital image correlation or another method. Give calibration details, resolution, data-smoothing rules, crack-front assumptions and the method used to convert crack-length increments into . Record the number of readings per cycle interval and how missed or unstable readings were treated. If the crack front was curved, branched or asymmetric, preserve the raw observations instead of reporting a single unquestioned length.
Reporting the curve without overclaiming
Publish the measured values and associated , , crack length and cycle count before presenting a fitted equation. Identify exclusions and their technical reasons. Show specimen-to-specimen scatter, not only a mean line. The NIST 2001 pipeline-steel study analysed “the scatter in the measured rates” by attributing it to the Paris-law constant ; that approach is useful only when the underlying observations remain visible.
State the fitted range in both and , the number of points, number of specimens, regression method, weighting, logarithm base and confidence or prediction interval. The Paris and Erdoğan 1963 relationship is commonly written
Here is the intercept and , or in some reports, is the slope of the log–log plot. Give units for , and ; changing MPa√m to ksi√in changes the numerical intercept. Do not call and universal steel constants. They describe a specified material condition, orientation, geometry, , environment, measurement procedure and fit interval.
Mark the validity limits: plane-strain requirements, thickness and ligament restrictions, small-scale yielding assumptions, crack-length range, maximum , threshold procedure and onset of instability. ASTM E647-23 and ISO 12108:2018 differ in threshold and decreasing- practice, so the adopted standard and deviations must appear beside the curve.
Finally, separate three products: measured data, fitted Paris parameters, and any extrapolated design curve. A design curve may include scatter factors, conservative bounds, threshold assumptions or a different crack-growth rule for structural assessment. It is not additional test data. FAA AC 25.571-1D and 14 CFR 25.571 place crack-growth analysis, probable damage locations, test-supported repeated-load evaluation and inspection planning within damage-tolerance compliance; those decisions require assumptions beyond a laboratory fit. Traceability is part of the result.
References
- [1] ISO 12108:2018: Metallic materials — Fatigue testing — Fatigue crack growth method. ISO standard, 2018. https://www.iso.org/standard/73809.html
- [2] Fatigue crack growth testing. TWI technical knowledge, 2024. https://www.twi-global.com/technical-knowledge/job-knowledge/fatigue-crack-growth-testing
- [3] Damage Tolerance Design Handbook. AFGROW Damage Tolerance Design Handbook, 2024. https://www.afgrow.net/applications/DTDHandbook/Sections/page7_2_2_1.aspx
- [4] 14 CFR 25.571: Damage-tolerance and fatigue evaluation of structure. 14 CFR, 2024. https://www.ecfr.gov/current/title-14/chapter-I/subchapter-C/part-25/subpart-C/section-25.571
- [5] Fatigue Crack Growth Rates in Pipeline Steels Using Curved M(T) Specimens. NIST publication, 2001. https://www.nist.gov/publications/fatigue-crack-growth-rates-pipeline-steels-using-curved-mt-specimens
- [6] Fatigue Crack Growth in 5% Ni Steel Weldments. NBSIR 76-843, 1976. https://nvlpubs.nist.gov/nistpubs/Legacy/IR/nbsir76-843.pdf