


What Steel Cleanliness Means—and What an Inclusion Rating Does Not Mean
Cleanliness as a population of nonmetallic particles
Steel cleanliness describes the population of nonmetallic inclusions in a steel product, not a single universal grade. A nonmetallic inclusion is an insoluble impurity particle formed during steelmaking or casting and trapped in the metal as it solidifies. Oxides, sulfides, silicates, aluminates, and complex globular particles can enter this population. Some form through deoxidation reactions; others come from slag, refractory erosion, mold flux, or reoxidation.
The variables behind a cleanliness result
- Composition
- What an inclusion contains, such as manganese sulfide, alumina, calcium aluminate, or a calcium-modified oxide.
- Size
- The dimensions or equivalent area of an inclusion.
- Number
- How many particles occur in a specified volume or examined area.
- Distribution
- Whether particles are uniformly dispersed, clustered, aligned in stringers, or concentrated in bands.
- Location
- Where inclusions occur, such as near the surface, at the centerline, or along segregation zones.
Several variables must be separated. Composition identifies what an inclusion contains, such as manganese sulfide, alumina, calcium aluminate, or a calcium-modified oxide. Size concerns its dimensions or equivalent area. Number describes how many particles occur in a specified volume or examined area. Distribution asks whether particles are uniformly dispersed, clustered, aligned in stringers, or concentrated in particular bands. Location identifies where they occur: near the surface, at the centerline, along segregation zones, between powder-forged particles, or in a region that will become a highly stressed part of a component.
These variables do not move together. A heat may contain many very small oxides but no unusually large particle, while another may have a low average count and one damaging inclusion. A rolled sulfide stringer and a compact oxide of the same maximum dimension will not produce the same stress concentration or respond identically during working. ASTM B796:2020 makes the related point for near-full-density powder-forged material: inclusion composition, size, distribution, and location strongly influence the resulting material.
Working changes the appearance of inclusions. Viscous sulfides may elongate during rolling, brittle oxides may fracture, and some particles may remain angular or become more globular after calcium treatment. The observed population therefore reflects both steelmaking history and deformation history. A cleanliness result is meaningful only alongside the product form, sampling position, reduction history, examined area, and test method.
Why a rating is not a direct chemical assay
A conventional inclusion rating is a method-defined observation of morphology and extent. It is not a chemical analysis of every particle. ASTM E45-25 provides four macroscopic and five microscopic methods for determining and reporting inclusion content in wrought steel. Its familiar microscopic categories are A, B, C, and D: A-sulfide, B-alumina, C-silicate, and D-globular-oxide types. Those labels describe appearance and morphological class under the method; they do not prove that every particle in a category has one pure chemical identity.
The ASTM E45 reference charts use thin and heavy series pictures at 100× magnification, with a specimen field area of approximately 0.50 mm². A reported result such as “B 1.5 heavy” therefore means that the observed field resembled a specified chart level under a specified examination procedure. It does not mean that the steel contains a chemically measured concentration of alumina equal to a universal threshold. Nor does it establish the largest inclusion anywhere in the heat.
| Standard | Classification or scope | Key limitation |
|---|---|---|
| ASTM E45-25 | A-sulfide, B-alumina, C-silicate, D-globular oxide; macroscopic and microscopic methods | Morphological reporting classes, not a complete chemical assay |
| JIS G 0555:2020 | Type A: viscous deformation; Type B: granular and discontinuous; Type C: irregularly dispersed | Letter designations are not interchangeable with ASTM categories |
| DIN EN 10247:2017 | Micrographic examination by standard pictures | Result depends on preparation, field selection, and picture framework |
| ISO 4967:2026 | Micrographic method for rolled or forged products with reduction ratio of at least 3 | Scope is linked to prior deformation |
| SAE J422:201801 | Quantitative microscopic practice | Photomicrographs are not intended for resulfurized grades or high-carbon bearing-quality steels generally classified using ASTM E45 |
Other standards classify the same microstructure differently. JIS G 0555:2020 uses Type A for inclusions formed by viscous deformation during working, Type B for granular and discontinuous inclusions, and Type C for irregularly dispersed inclusions without viscous deformation. DIN EN 10247:2017 specifies micrographic examination by standard pictures, while ISO 4967:2026 specifies the corresponding international method for rolled or forged steel products having a reduction ratio of at least 3. The category names cannot be transferred between standards without checking the definitions, preparation, magnification, field selection, and reporting rules.
A chemical question requires another tool. Scanning electron microscopy with energy-dispersive X-ray analysis (SEM/EDS) can characterize individual particles and distinguish, for example, an alumina-rich oxide from a calcium aluminate or a complex manganese-containing inclusion. The DOE-sponsored ASCAT project used computer-controlled scanning electron microscopy with X-ray analysis to relate individual inclusion size, composition, and distribution to overall cleanliness. Automated image analysis can count and size particles across many fields, but its thresholding rules and contrast limits still affect the result.
Separating cleanliness, total oxygen, and mechanical performance
Total oxygen and inclusion cleanliness overlap, but they are not interchangeable measurements. Total oxygen measures oxygen present in the analyzed steel sample, including oxygen bound in oxide inclusions and, depending on the procedure, dissolved oxygen. It does not describe particle shape, size distribution, location, or whether oxide is concentrated in a few large inclusions. Two heats with similar total oxygen can therefore have different inclusion populations and different risks.
A chart rating also cannot predict component life by itself. Fatigue strength, fracture toughness, rolling-contact fatigue, ductility, machinability, and forgeability depend on steel grade, matrix structure, heat treatment, stress state, surface condition, loading spectrum, and component geometry as well as inclusions. A large inclusion in a highly stressed subsurface region may matter more than many small particles elsewhere. Location changes the answer.
For very clean bearing steels, conventional ASTM and JIS ratings may fail to distinguish heats because the inspected fields contain few or no particles at chart resolution. The peer-reviewed JIS study showed why maximum inclusion size expressed as √area can be more informative when evaluated with extreme-value statistics. ASTM E2283-08(2019), under ASTM Subcommittee E04.09 alongside ASTM E45-25, addresses this type of extreme-value analysis. The question then changes from “What chart class appeared in these fields?” to “What size of rare inclusion could plausibly occur in the larger inspected or produced volume?”
No single result answers every cleanliness question. Chart ratings compare morphology under a defined method; image analysis supplies counts and size distributions; SEM/EDS identifies particle chemistry; total oxygen measures an aggregate oxygen quantity; extreme-value methods address rare, large inclusions. Treating any one of them as a universal pass/fail number confuses different measurements and can assign a service-life prediction that the test was never designed to provide.
How Nonmetallic Inclusions Form and Change During Steel Processing

Sources during steelmaking and casting
The National Institute of Standards and Technology (NIST) describes nonmetallic inclusions as insoluble impurity particles formed during steelmaking and casting and trapped during solidification. This definition matters because an inclusion is not simply “dirt” already present in the charge. Its composition and shape can develop through reactions among molten steel, slag, refractories, alloy additions, and the atmosphere.
Oxide inclusions commonly form when dissolved elements react with oxygen. Aluminum-killed steel, for example, can produce alumina, Al₂O₃, when aluminum removes dissolved oxygen from the melt. Deoxidation products may collide and agglomerate, or they may be modified by calcium treatment into calcium-aluminate phases with different melting and deformation behavior. Silicate inclusions can arise from steel–slag reactions, refractory attack, or complex oxide reactions. Entrained slag and refractory particles provide another route, particularly when turbulence draws the slag layer into the metal or when a nozzle, ladle lining, or submerged-entry system sheds material.
Sulfide inclusions form mainly when sulfur combines with manganese and other elements during cooling. Manganese sulfide, MnS, is especially important in low-alloy and free-machining steels. In a resulfurized grade, the intended sulfide population can be much larger than in a low-sulfur bearing steel, so a numerical comparison without the grade, product form, and test method can mislead. Nitride and carbonitride particles may also precipitate during cooling or later thermal treatment, although standard inclusion ratings do not necessarily identify them chemically.
NIST’s IMPACTS description identifies inclusion composition, size, and number as cleanliness parameters. Distribution is equally consequential: a few large particles concentrated in one region do not present the same risk as the same number dispersed through a section. Total oxygen measures the oxygen carried by oxide populations, but it does not reveal the size of the largest inclusion, its chemistry, or whether particles are clustered. Automated image analysis and scanning electron microscopy with energy-dispersive X-ray analysis (SEM/EDS) answer different questions from a total-oxygen test.
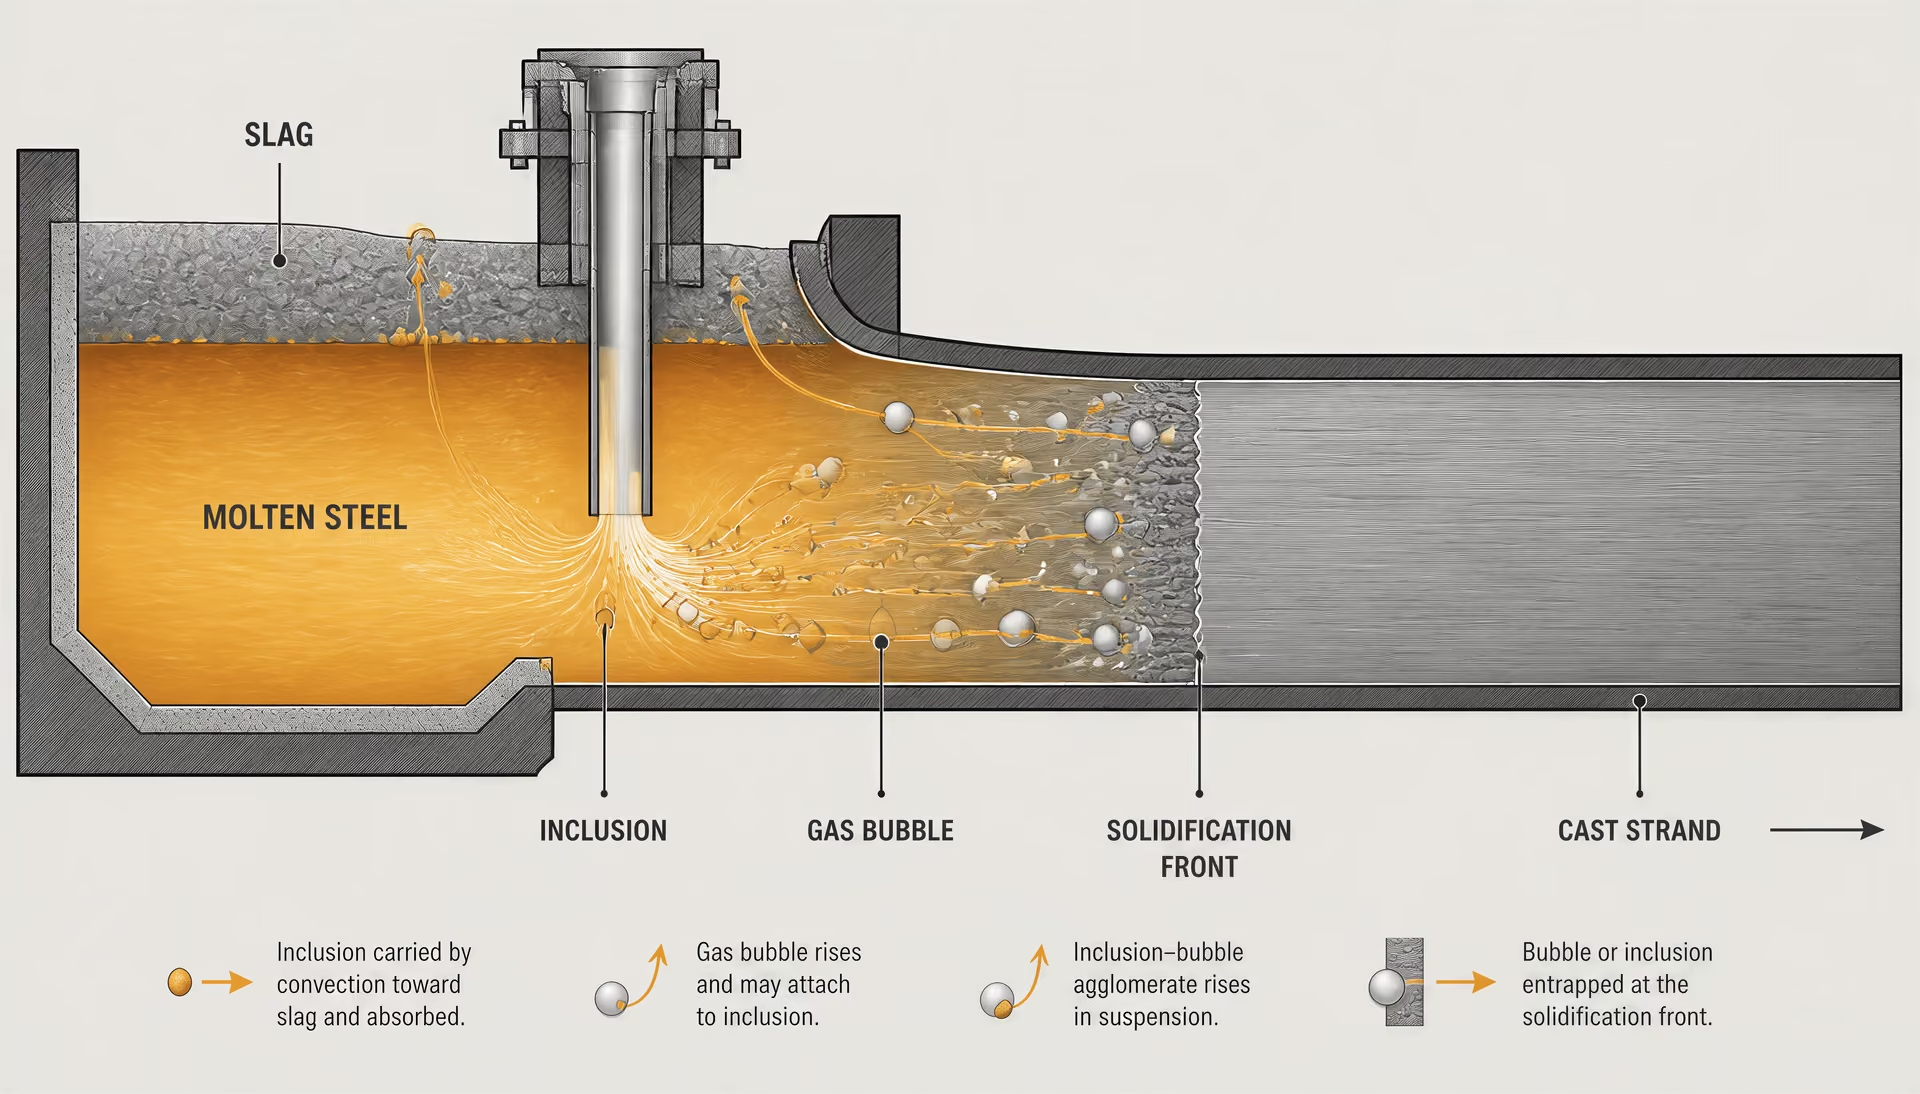
Casting determines where those particles go. During continuous casting, inclusions may float into the slag, attach to bubbles, be captured by the solidification front, or remain suspended until they are engulfed. Flow patterns, casting speed, steel superheat, electromagnetic stirring, and mold flux behavior all affect this competition. The final inclusion population therefore records processing history before any rolling begins.
Entrapment during solidification
As a steel strand, billet, or ingot freezes, the solidification front rejects some dissolved elements into the remaining liquid. Sulfur, oxygen-bearing species, and other solutes can become concentrated in interdendritic regions, where new inclusions form or existing particles become trapped. A particle is more likely to be engulfed when the interface advances faster than the particle can move away, although particle size, interfacial energy, fluid flow, and local chemistry also matter.
This creates spatial variation. Inclusions may be concentrated near the centerline, aligned with interdendritic segregation, or distributed unevenly across a billet. Porosity and shrinkage can provide additional sites for oxide accumulation. The same heat can therefore produce different test results depending on whether a specimen is taken from the center, quarter-thickness, surface region, longitudinal plane, or transverse plane.
Location also changes the engineering consequence. A small oxide isolated in the matrix may have little effect, while a cluster of alumina near a fatigue-critical surface can initiate a crack. The risk is often controlled by a maximum or near-maximum inclusion rather than by the average count. ASTM Subcommittee E04.09 lists ASTM E45-25 and ASTM E2283-08(2019), the latter addressing extreme-value analysis of nonmetallic inclusions in steel. A peer-reviewed study on bearing steels reported that conventional ASTM and JIS ratings may fail to distinguish very clean materials; expressing maximum inclusion size as √area and applying extreme-value statistics can separate populations that look identical under a routine chart rating.
The solidification structure also determines how later working will expose inclusions. A particle trapped between dendrites may be elongated along the product axis during reduction. Another particle in a less constrained region may fracture, disperse, or retain a compact form.

Deformation during rolling and forging
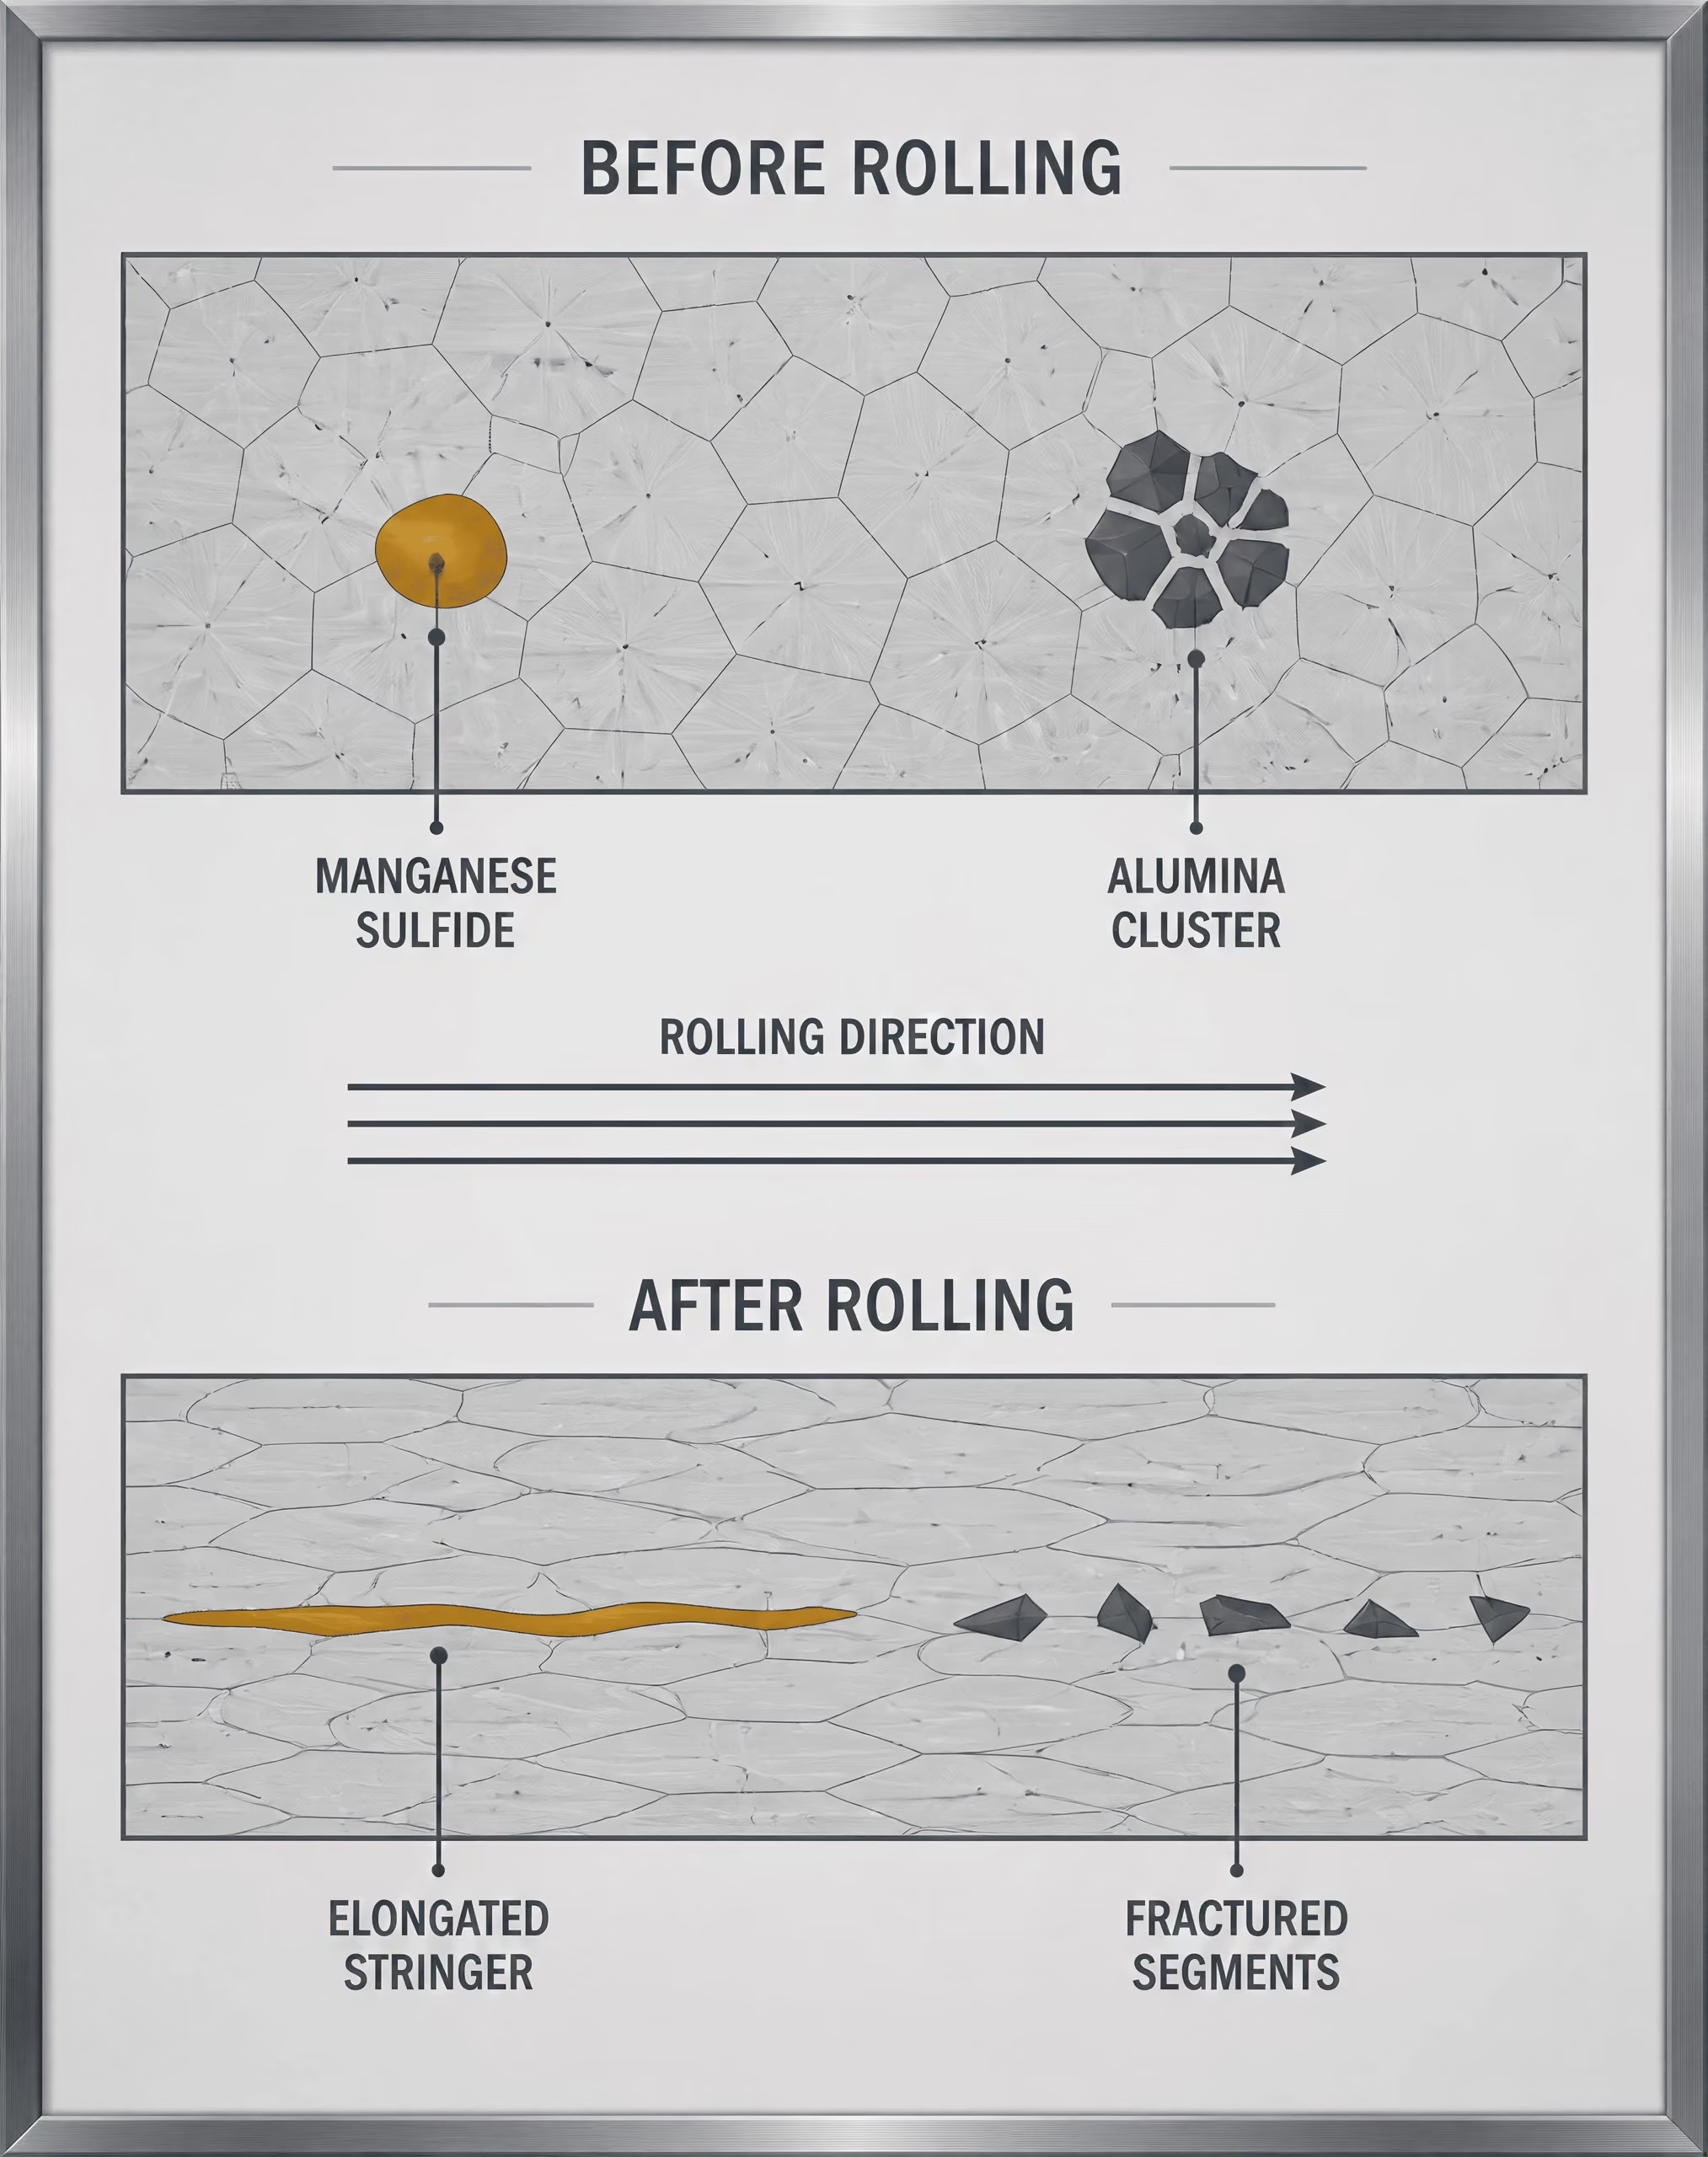
Rolling and forging do not remove every inclusion. They alter its geometry, orientation, spacing, and sometimes its internal structure. A ductile sulfide such as MnS can deform with the surrounding steel, becoming a long, narrow stringer parallel to the rolling direction. Oxides such as alumina are generally harder and less ductile than the matrix. They may fracture into segments, rotate, debond from the steel, or remain comparatively globular. Some silicates soften at hot-working temperatures and can elongate; others behave more like brittle particles. Chemistry controls the response.
This is why sulfide-like stringers differ from globular oxides in both appearance and effect. A longitudinal section through rolled steel can show MnS as thin, continuous-looking lines, whereas a transverse section may show short dots or flattened spots. An alumina cluster may appear as several angular fragments in one plane and as a single irregular particle in another. The population has not necessarily changed in number; the section has changed its intersection with three-dimensional objects.
Reduction ratio matters. A heavily rolled product can spread inclusions over a longer distance and reduce their apparent thickness, while forging may break clusters and redistribute particles through repeated compression. Conversely, insufficient working can leave concentrated clusters or shrinkage-related defects. ISO 4967:2026 specifies a micrographic method for rolled or forged steel products with a reduction ratio of at least 3, a scope that links the observation method to prior deformation rather than treating every cast condition as equivalent.
Standards encode these morphology effects differently. ASTM E45-25 provides four macroscopic and five microscopic methods for determining and reporting inclusion content in wrought steel. Its microscopic categories A, B, C, and D are morphological reporting classes, not direct chemical identifications. The ASTM E45 reference charts associate A with sulfide, B with alumina, C with silicate, and D with globular oxide; the thin and heavy series are rated at 100× magnification over a specimen field of approximately 0.50 mm². Those labels are useful observations, but an A-type line is not a chemical assay for MnS.
DIN EN 10247:2017 uses standard pictures for micrographic examination, while ISO 4967 specifies the corresponding international method. JIS G 0555:2020 instead defines Type A as inclusions formed by viscous deformation during working, Type B as granular and discontinuous inclusions, and Type C as irregularly dispersed inclusions without viscous deformation. The categories overlap in purpose but are not interchangeable grades.
Consequently, two laboratories can inspect material from the same heat and report different-looking inclusion populations if they use different planes, magnifications, fields of view, reduction histories, or standards. A chart rating describes what the selected method sees. SEM/EDS can identify composition and morphology particle by particle; image analysis can quantify size and distribution; total oxygen estimates oxygen-bearing content; extreme-value analysis addresses the largest particles. None replaces the others.
ASTM E45: Methods, Categories, and Reference-Chart Ratings
ASTM E45-25 is a family of macroscopic and microscopic methods rather than one universal steel-cleanliness grade. Strong evidence
[1] ASTM E45: Standard Practice for Determining the Inclusion Content of Steel. ASTM International. ASTM International standard, 2025.ASTM E45-25 is not a single microscope procedure and does not assign one universal cleanliness grade to a steel. It is a family of methods for determining and reporting nonmetallic inclusion content in wrought steel. ASTM International states that the 2025 edition provides four macroscopic methods and five microscopic methods. The selected method changes the observation, the area examined, the sensitivity to inclusion size and shape, and the form of the reported result.
That distinction matters because inclusions are insoluble particles formed during steelmaking or casting and trapped as the metal solidifies. A rating can describe what appears in a prepared section without fully identifying the particles’ chemistry or predicting their effect in every application. NIST’s IMPACTS work identifies composition, size, and number as important cleanliness parameters; distribution and location also affect how inclusions behave during rolling, forging, machining, fatigue, and fracture.
What the ASTM E45 method groups reveal
- Macroscopic methods Reveal segregation, clusters, streaks, large inclusions, and other larger-scale discontinuities over relatively large areas.
- Microscopic methods Examine polished and etched sections at specified magnification against rating criteria or measured inclusion quantities.
- Chart comparison Provides a standardized visual comparison but remains sensitive to field selection and operator judgment.
- Automated image analysis Can measure inclusion length, width, area fraction, equivalent diameter, aspect ratio, and number density.
The four macroscopic and five microscopic methods
The macroscopic methods examine a relatively large area or a larger-scale indication in the steel. They are useful for detecting segregation, clusters, streaks, large inclusions, and other discontinuities that may be missed in a small microscope field. Depending on the method and product, examination may involve a fracture surface, a macroetched surface, a deep-etched section, or another prepared area intended to reveal larger-scale discontinuities. These methods answer a different question from a polished-section inclusion count: not “how many particles occur in this small field?” but “does the product contain conspicuous or unusually concentrated discontinuities over the examined region?”
The microscopic methods examine polished and etched sections at specified magnification and compare observed inclusions with defined rating criteria. ASTM E45 includes chart-based ratings and methods based on counting or measuring inclusions; the five microscopic methods therefore should not be treated as interchangeable versions of the same test. One may emphasize the worst field, another may record inclusion numbers or lengths over a defined area, and another may use automated image analysis. The result depends on section orientation, sampling plan, field selection, microscope settings, threshold rules, and whether the procedure reports a maximum observation or an average.
A chart rating is especially sensitive to field selection. If an operator searches for and reports the worst field, a localized inclusion stringer can control the result. If fields are selected systematically and averaged, the same steel may receive a lower numerical description while still containing the same local feature. Neither result is automatically “right” without knowing the method requested by the material specification.
Automated analysis adds measurements of length, width, area fraction, equivalent diameter, aspect ratio, and number density, but automation does not remove the method problem. Polishing scratches, etching contrast, pores, carbide particles, and touching inclusions can be classified incorrectly unless the imaging and verification rules are controlled. The DOE-sponsored ASCAT project showed the value of computer-controlled scanning electron microscopy with X-ray analysis for relating individual inclusion size and composition to distribution. That is characterization, not merely a conventional E45 chart comparison.
A, B, C, and D morphological categories
The familiar ASTM E45 microscopic categories are morphological reporting classes. They describe how an inclusion or inclusion string appears in the polished section.
A-sulfide refers to elongated, deformable inclusions commonly associated with sulfide stringers. The ASTM adjunct identifies the A type as sulfide. In a rolled product, these inclusions typically show a long dimension parallel to the working direction.
B-alumina describes angular, often brittle-looking inclusions or clusters associated in the reference charts with alumina. They can appear as discrete particles, aligned groups, or broken clusters, and their shape may reflect deformation and fragmentation during working.
C-silicate describes elongated, deformable inclusions identified in the adjunct with silicate. Like A inclusions, C inclusions may form stringers, but their morphology and chart position distinguish them from the A series.
D-globular-oxide covers generally rounded or globular oxide inclusions. The ASTM reference charts identify the D type as globular oxide, with ratings based on the size, number, and appearance of particles in the viewed field.
These names must not be read casually as complete chemical identifications. “B-alumina,” for example, is an ASTM reference designation linked to a characteristic morphology and chart class; it does not prove that every particle in that class consists of pure Al₂O₃. Inclusions may contain mixed oxides, sulfides, silicates, calcium aluminates, spinel phases, entrained slag, or reaction products. Confirmation of chemistry requires another technique, commonly scanning electron microscopy with energy-dispersive X-ray spectroscopy (SEM/EDS), and even SEM/EDS requires care because small particles can be affected by the surrounding steel matrix.
Other standards use different category systems. JIS G 0555:2020 uses Type A for inclusions formed by viscous deformation during working, Type B for granular and discontinuous inclusions, and Type C for irregularly dispersed inclusions without viscous deformation. Those Type A, B, and C labels are not interchangeable with ASTM E45’s A, B, C, and D designations.
Thin and heavy series at the reference field
| ASTM E45 category | Reference description | Series |
|---|---|---|
| A | Sulfide | Thin and heavy |
| B | Alumina | Thin and heavy |
| C | Silicate | Thin and heavy |
| D | Globular oxide | Thin and heavy |
The ASTM E45 adjunct reference charts rate A-sulfide, B-alumina, C-silicate, and D-globular-oxide inclusions in thin and heavy series. “Thin” and “heavy” describe the amount and visual severity of the inclusion population represented by the reference picture; they are not separate chemical types.
The chart comparison is made at 100× magnification over a specimen field area of approximately 0.50 mm². That fixed reference field gives the chart number a defined scale. It does not mean that the entire billet, bar, plate, or forging contains only the particles visible in one field. A rating is an observation from sampled sections and fields, so the sampling location and orientation remain critical. Longitudinal sections may expose stringers differently from transverse sections, while a sparse population of large particles may escape a small-area examination entirely.
This limitation is why an E45 chart result should not be converted into a universal pass/fail statement without the governing product specification. A steel reported as D 1.0, for example, has a result tied to the D category, the thin or heavy series, the magnification, the reference field, the section examined, and the selected rating procedure. It is not a single cleanliness percentage and says nothing by itself about maximum inclusion size outside the inspected fields.
For very clean bearing steels, conventional ASTM or JIS ratings may fail to distinguish meaningful differences because too few inclusions appear in the chart fields. Extreme-value analysis can address a different risk: the likely largest inclusion in a sampled volume. ASTM E2283-08(2019), listed with ASTM E45-25 under ASTM Subcommittee E04.09, addresses extreme-value analysis of nonmetallic inclusions in steel. A Japanese study reported that maximum inclusion size expressed as √area can be evaluated with extreme-value statistics. ISO 4967:2026 likewise specifies a micrographic method using reference charts or image analysis for rolled or forged steel products with a reduction ratio of at least 3.
Thus, E45 chart ratings remain useful for standardized morphology-based comparison, but they are not chemical assays, total-oxygen measurements, or guarantees against a rare large inclusion. Each answers a narrower question.
ISO 4967 and DIN EN 10247: The Micrographic Standard-Picture Framework
ISO 4967:2026 scope and reduction ratio
ISO 4967:2026 defines a micrographic method for assessing nonmetallic inclusions in rolled or forged steel products having a reduction ratio of at least 3. That qualification is not a minor detail. Rolling and forging alter the shape and spacing of entrapped particles, so the method assumes that the product has undergone enough working to produce the inclusion morphology to which the procedure applies. A cast steel section, or a product with less deformation, should not automatically be assigned the same meaning under this standard.
The method examines a prepared and etched or unetched polished section by comparison with standard reference charts, or by image analysis where the procedure and reporting system support it. The result is therefore a description of what appears in selected microscopic fields, not a direct chemical assay of the steel. Nonmetallic inclusions are insoluble particles formed during steelmaking or casting and retained during solidification. Their composition, size, number, morphology, distribution, and location can all affect performance, yet a conventional chart rating captures only some of these variables.
Reduction also changes morphology in a direction-dependent way. A manganese sulfide particle may become an elongated stringer, while a hard alumina cluster may fracture, spread, or remain as a compact group. A rating made on a longitudinal section can therefore differ materially from one made on a transverse section. The sampling direction, section location, and number of fields must accompany the rating if another laboratory is to interpret it correctly.
ISO 4967:2026 does not create one universal cleanliness grade. It establishes a method and its conditions. A reported result might distinguish inclusion classes and severity, but the significance of that result depends on the product, steel grade, inspection plane, and acceptance specification. Total oxygen can indicate the overall oxygen-bearing inclusion burden, but it cannot identify particle shape or tell whether a small number of large inclusions are present. Conversely, a micrographic rating can show morphology without proving the chemical identity of every particle.
DIN EN 10247:2017 and standard pictures
DIN EN 10247:2017 is the German adoption of the European standard EN 10247:2017, titled Micrographic examination of non-metallic inclusions in steels using standard pictures. “DIN EN” indicates that the European document has been adopted into the German standards system; it is not simply an informal German translation of an unrelated national procedure. Its standard-picture framework is closely related to the international micrographic approach specified by ISO 4967.
The operator compares observed fields with reference pictures representing inclusion appearance and severity. In practice, this means judging features such as length, thickness, angularity, continuity, clustering, and apparent deformation. The picture series provides a shared visual language, but it does not turn appearance into chemistry. A dark, elongated feature may be consistent with a sulfide stringer, for example, while a compact angular group may suggest alumina; confirmation would require a method such as scanning electron microscopy with energy-dispersive X-ray analysis (SEM/EDS).
The familiar ASTM E45-25 system illustrates the same limitation from another standards family. ASTM E45-25 provides four macroscopic and five microscopic methods for determining and reporting inclusion content in wrought steel. Its microscopic categories A, B, C, and D describe morphology rather than directly identifying composition. The ASTM E45 adjunct charts identify A-sulfide, B-alumina, C-silicate, and D-globular-oxide types, with thin and heavy series rated at 100× magnification over a field area of approximately 0.50 mm². Those labels and chart values must not be transferred to DIN EN 10247:2017 or ISO 4967 as though the scales were interchangeable.
JIS G 0555:2020 demonstrates why designation systems require care. It uses Type A for inclusions formed by viscous deformation during working, Type B for granular and discontinuous inclusions, and Type C for irregularly dispersed inclusions without viscous deformation. Similar visual features can receive different names, classes, or limits under different standards.
Reference charts versus image analysis
Standard-picture comparison is fast, familiar, and useful for production control. It also contains operator judgment. Two examiners may select different fields, place a borderline field into different severity classes, or interpret a cluster differently. Field selection is especially important because inclusions are not uniformly distributed through a bar or billet. A small inspected area can miss a rare large particle entirely.
Image analysis replaces some visual judgment with measured quantities such as inclusion area fraction, equivalent diameter, length, width, aspect ratio, and count per unit area. It does not remove method dependence. Specimen preparation controls scratches, pull-outs, edge rounding, and surface relief. Magnification controls the smallest detectable particle. Illumination, focus, camera calibration, and field-selection rules affect segmentation. Thresholding can merge adjacent particles, reject faint inclusions, or classify polishing damage as an inclusion. Reporting conventions then determine whether the result is expressed as a count, area fraction, maximum dimension, size distribution, or class frequency.
Consequently, an ISO 4967:2026 chart rating and an image-analysis result should not be treated as interchangeable measurements. They may examine the same steel while answering different questions. Image analysis can quantify many fields, whereas a chart method may align more directly with a purchasing or process specification. SEM/EDS adds composition and morphology for individual particles; ASTM E2283-08(2019) addresses extreme-value analysis when the largest inclusion is the concern. A peer-reviewed JIS study found that conventional ASTM and JIS ratings may fail to separate very clean bearing steels, while maximum inclusion size expressed as √area can be evaluated with extreme-value statistics. The correct result is therefore the one whose method, specimen, and reporting conventions match the failure question.
JIS G 0555 and SAE J422: Similar Questions, Different Classification Boundaries
JIS G 0555:2020 and SAE J422:201801 both examine nonmetallic inclusions in polished steel, but they do not define cleanliness through identical categories or reporting logic. Each produces a method-dependent observation. The result depends on specimen location, surface preparation, magnification, field examined, inclusion morphology, and the rules used to assign a class or quantity. A “JIS cleanliness rating” therefore cannot be treated as a direct equivalent of an SAE or ASTM rating without comparing the standards themselves.
JIS Type A, Type B, and Type C
JIS G 0555:2020 classifies inclusions by their appearance after working and by the way they are distributed in the steel matrix. The classification is morphological, not a direct chemical identification.
Type A inclusions are formed by viscous deformation during working. In rolled or forged steel, they commonly appear as elongated or string-like particles aligned with the working direction. Manganese sulfide (MnS) is a frequent example of an inclusion that can produce this appearance, particularly in steels with sufficient sulfur and favorable hot-working behavior. The classification, however, describes the observed deformation pattern; it does not establish that every Type A indication is chemically MnS.
Type B inclusions are granular and discontinuous. Rather than forming a long, continuous stringer, they appear as separate particles or short groups of particles. Alumina-rich deoxidation products may produce this type of appearance, although chemical confirmation requires a method such as scanning electron microscopy with energy-dispersive X-ray spectroscopy (SEM/EDS). Clusters of small particles can matter even when their individual dimensions are modest, because the cluster may act as a concentrated defect field.
Type C inclusions are irregularly dispersed and show no viscous deformation. Their random or scattered appearance distinguishes them from the aligned Type A population. Oxide or silicate particles may be encountered in this category, but again, the Type C designation is based on morphology and distribution rather than a chemical assay.
This distinction matters when inclusion shape controls fatigue or fracture behavior. A thin, elongated sulfide and a compact oxide particle may occupy similar projected areas while producing different stress concentrations, crack paths, and effects on machinability. JIS G 0555 records the visual class established by its procedure; it does not collapse composition, size, location, and mechanical consequence into one universal cleanliness number.
SAE J422 quantitative microscopic practice
SAE J422:201801 approaches the question as a quantitative microscopic practice for determining steel cleanliness. Instead of treating a reference image as a complete description of the material, the examination counts and measures inclusion indications within defined microscopic observations. The reported result is consequently tied to sampling area, magnification, measurement rules, and the population of inclusions visible under those conditions.
That is a different boundary from simply assigning JIS Type A, B, or C. A JIS class primarily communicates deformation and dispersion characteristics. SAE J422 can quantify the observed inclusion population, but the numerical result still represents only the inspected sections and the practice’s detection limits. A small number of large inclusions may be more consequential than many fine particles, while an average count can conceal a rare, damaging maximum-size particle. Extreme-value methods address that separate question; ASTM E2283-08(2019), under ASTM Subcommittee E04.09, concerns extreme-value analysis of nonmetallic inclusions in steel.
SAE J422:201801 also states a direct scope limitation: its photomicrographs are “not intended for resulfurized grades or high-carbon bearing-quality steels generally classified using ASTM E45.” That sentence prevents a common misuse. The photographs and quantitative practice should not be applied as though they were the controlling classification system for those steel families.
Resulfurized and bearing-quality exclusions
Resulfurized grades contain deliberately increased sulfur, commonly to improve machinability. Their manganese sulfide population can be substantially different in amount, aspect ratio, and distribution from the inclusion population in low-sulfur clean steels. A rating method developed around ordinary inclusion morphology may therefore report a high apparent inclusion content without distinguishing intended sulfide engineering from harmful oxide contamination.
High-carbon bearing-quality steels present another boundary. Bearing performance can depend strongly on rare, very large oxide inclusions, not merely on the field-average population. Conventional chart ratings may fail to distinguish very clean bearing steels because the method samples limited areas and compresses different size distributions into similar ordinal ratings. A peer-reviewed JIS study reported this limitation and discussed maximum inclusion size through the square-root-of-area parameter, √area, combined with extreme-value statistics.
ASTM E45-25 itself provides four macroscopic and five microscopic methods for determining and reporting inclusion content in wrought steel. Its adjunct reference charts identify A-sulfide, B-alumina, C-silicate, and D-globular-oxide types, using thin and heavy series at 100× over a field of approximately 0.50 mm². Those labels are not interchangeable with JIS Type A, Type B, and Type C, despite the shared letters.
The practical rule is simple: do not convert ratings by letter, number, or presumed cleanliness rank alone. Check the steel grade, inclusion population, reduction history, specimen orientation, inspected area, magnification, and exclusion clauses first. Where the question concerns chemistry, use SEM/EDS; where it concerns total oxygen, measure total oxygen; where it concerns the largest damaging particle, use an appropriate extreme-value or √area method. Each answers a different question.
Specimen Preparation, Microscopy, and Reporting Discipline
Sampling direction and metallographic preparation
An inclusion result begins with the specimen, not the microscope. The sampling plan should state whether the section is longitudinal, transverse, or taken through another defined plane, because working changes both inclusion shape and spacing. A rolled sulfide may appear as a long band on a longitudinal section but as a short particle, or nearly a dot, on a transverse section. The two observations describe the same three-dimensional feature from different directions.
The product form also matters. ASTM E45-25 addresses inclusion content in wrought steel and provides four macroscopic and five microscopic methods for determining and reporting it. ISO 4967:2026 specifies a micrographic method for rolled or forged products with a reduction ratio of at least 3. A result obtained from a heavily reduced bar should not be presented as though it represented an as-cast product, powder-forged material, or an unspecified steel form. The sampling location—surface, quarter-thickness, center, or another stated position—must accompany the result, since inclusions can segregate or concentrate at particular regions.
The cut face should be identified relative to the principal working direction before preparation. Cutting can smear soft constituents, pull out particles, or introduce scratches that resemble elongated inclusions. Grinding and polishing should produce a flat, clean surface with scratches and deformation removed sufficiently for the selected examination method. Excessive relief around hard oxides can distort apparent dimensions; polishing damage can break or dislodge inclusions; residue from cloths, abrasives, mounting compounds, or handling can be mistaken for foreign matter. Cleaning between preparation stages and protection of the finished surface are therefore part of measurement control, even where a standard does not prescribe one universal preparation sequence.
Etching requires similar restraint. If the purpose is an inclusion rating, the report should state whether the surface was examined unetched or after a specified etchant, because the matrix contrast and the apparent boundary of an inclusion can change. A polished section that is technically readable but contaminated or heavily scratched is not rescued by a higher microscope magnification. Preparation quality sets the limit.
Two-dimensional fields and inclusion morphology
A metallographic field is a two-dimensional sample of a three-dimensional population. It cannot, by itself, establish the true volume, maximum length, or spatial distribution of every inclusion in the product. Field selection therefore affects the result. Examining only visually clean regions can understate dispersed inclusions; deliberately selecting the dirtiest field can overstate ordinary cleanliness while possibly answering a separate worst-location question. The method, sampling plan, and field-selection rule should determine which practice is appropriate.[2] ASTM E45 Adjunct Reference Charts for Inclusion Rating. ASTM International. ASTM International adjunct, 2025.
Magnification and field area are not interchangeable. The ASTM E45 adjunct reference charts use 100× magnification and a specimen field area of approximately 0.50 mm². They identify morphological chart categories as A-sulfide, B-alumina, C-silicate, and D-globular-oxide, with thin and heavy series pictures for rating. These labels describe appearance and morphology under the method; they are not direct chemical assays. An inclusion that looks like a B-type particle is not chemically proven to be alumina merely because the chart calls that category “B-alumina.”
Shape, continuity, deformation, and dispersion carry metallurgical information. JIS G 0555:2020 uses Type A for inclusions formed by viscous deformation during working, Type B for granular and discontinuous inclusions, and Type C for irregularly dispersed inclusions without viscous deformation. Those categories should not be silently converted into ASTM E45 A, B, C, or D grades. The designations belong to different classification systems.
Chart comparison is useful when the field size, magnification, specimen orientation, and rating procedure match the selected standard. Image analysis answers a different question. Thresholding can measure area fraction, particle count, length, width, aspect ratio, or size distribution across a larger area, but its output depends on illumination, focus, segmentation thresholds, calibration, and rules for touching particles. The report should preserve those choices. Automated scanning electron microscopy with X-ray analysis, as developed in the DOE-sponsored ASCAT project, adds composition to measurements of individual inclusion size and distribution. Total oxygen provides a bulk oxygen-related indicator, not a map of inclusion morphology or location. Extreme-value analysis, including the √area approach discussed in peer-reviewed JIS work and addressed by ASTM E2283-08(2019), targets unusually large particles rather than an average chart field.
What a defensible report should identify
A defensible report names the standard in full, including edition or year: for example, ASTM E45-25, ISO 4967:2026, DIN EN 10247:2017, or JIS G 0555:2020. It identifies the product form and, where relevant, the reduction condition; ISO 4967:2026 applies to rolled or forged products with a reduction ratio of at least 3. The document also records heat or lot identification, sampling location, section orientation relative to rolling or forging, and whether the surface was etched.
The rating system must be explicit. State the categories used, such as ASTM E45 A, B, C, and D with thin or heavy series, or JIS G 0555 Type A, Type B, and Type C. State the magnification, chart or image-analysis protocol, field size when specified, number or area of fields examined, and the rule used to select those fields. If several specimens or orientations were examined, report them separately rather than collapsing them into one unexplained number.
Chemical characterization requires its own description. A report using SEM/EDS should identify that method and indicate whether results are qualitative or quantitative; a total-oxygen result should identify the analytical method and specimen basis. If image analysis was used, record calibration, segmentation criteria, particle-size definition, treatment of touching particles, and the analyzed area. A maximum-inclusion result should state whether size is reported as length, equivalent diameter, or √area and whether an extreme-value procedure was applied.
Without these details, “clean steel” is an incomplete result. The number may be reproducible within one laboratory while remaining incomparable with a chart rating, a total-oxygen value, or a maximum-particle estimate made under another standard.
Why Conventional Ratings Can Miss the Largest and Rarest Inclusion
A steel cleanliness rating is not a direct statement that a heat contains, for example, “Grade 1” inclusions and therefore has a known maximum defect size. It is the result of a defined observation method applied to a defined specimen area. Change the magnification, inspected area, inclusion class, reporting rule, or sampling location and the reported cleanliness can change without any change in the steel itself.
This matters most in bearing steels, where fatigue damage may begin at one unusually large inclusion rather than at the average particle population. Nonmetallic inclusions are insoluble particles formed during steelmaking or casting and trapped during solidification. Their composition, size, number, morphology, distribution, and location all influence their effect. Total oxygen can indicate the overall oxide burden, while automated optical analysis or SEM/EDS can describe individual particles; neither result is interchangeable with a chart rating.
Average appearance versus extreme inclusion size
Conventional microscopic ratings are good at describing what a typical inspected field looks like. They are less effective at answering a different question: what is the largest inclusion likely to occur in the entire product volume?
ASTM E45-25 provides four macroscopic and five microscopic methods for determining and reporting inclusion content in wrought steel. Its microscopic reference charts identify A-sulfide, B-alumina, C-silicate, and D-globular-oxide types. At 100× magnification, the charts use thin and heavy series pictures over a specimen field area of approximately 0.50 mm². That procedure creates a repeatable comparison, but it also limits the observation to a small sampled area and to the visual categories defined by the method.
The same limitation appears in JIS G 0555:2020, although its categories are organized differently. Type A covers inclusions formed by viscous deformation during working, Type B covers granular and discontinuous inclusions, and Type C covers irregularly dispersed inclusions without viscous deformation. These are morphology and distribution classes, not complete chemical identifications. A Type B rating does not, by itself, prove that every particle is alumina, just as an ASTM D rating does not establish a single oxide compound by chemical assay.
Conventional ASTM and JIS ratings may fail to distinguish very clean bearing steels that differ in their largest inclusions. Limited evidence
The peer-reviewed study examining JIS cleanliness ratings for very clean bearing steels showed why this distinction matters. Conventional ASTM and JIS results could fail to separate steels that differed in their largest inclusions, even when both appeared exceptionally clean under routine rating procedures. A low average count or favorable chart appearance can coexist with one rare, high-consequence particle. If the inspected fields do not contain that particle, the rating records the ordinary appearance, not the extreme tail of the size distribution.
That is a sampling problem, not necessarily a flaw in the chart method. A chart rating asks how much inclusion content is visible in a prescribed field and category. It does not promise an estimate of the maximum particle in a bearing ring, bar, or large production heat. The probability of finding a rare inclusion rises with inspected area and volume. A test that examines a few square millimetres cannot provide the same information as one that statistically represents a large steel volume.

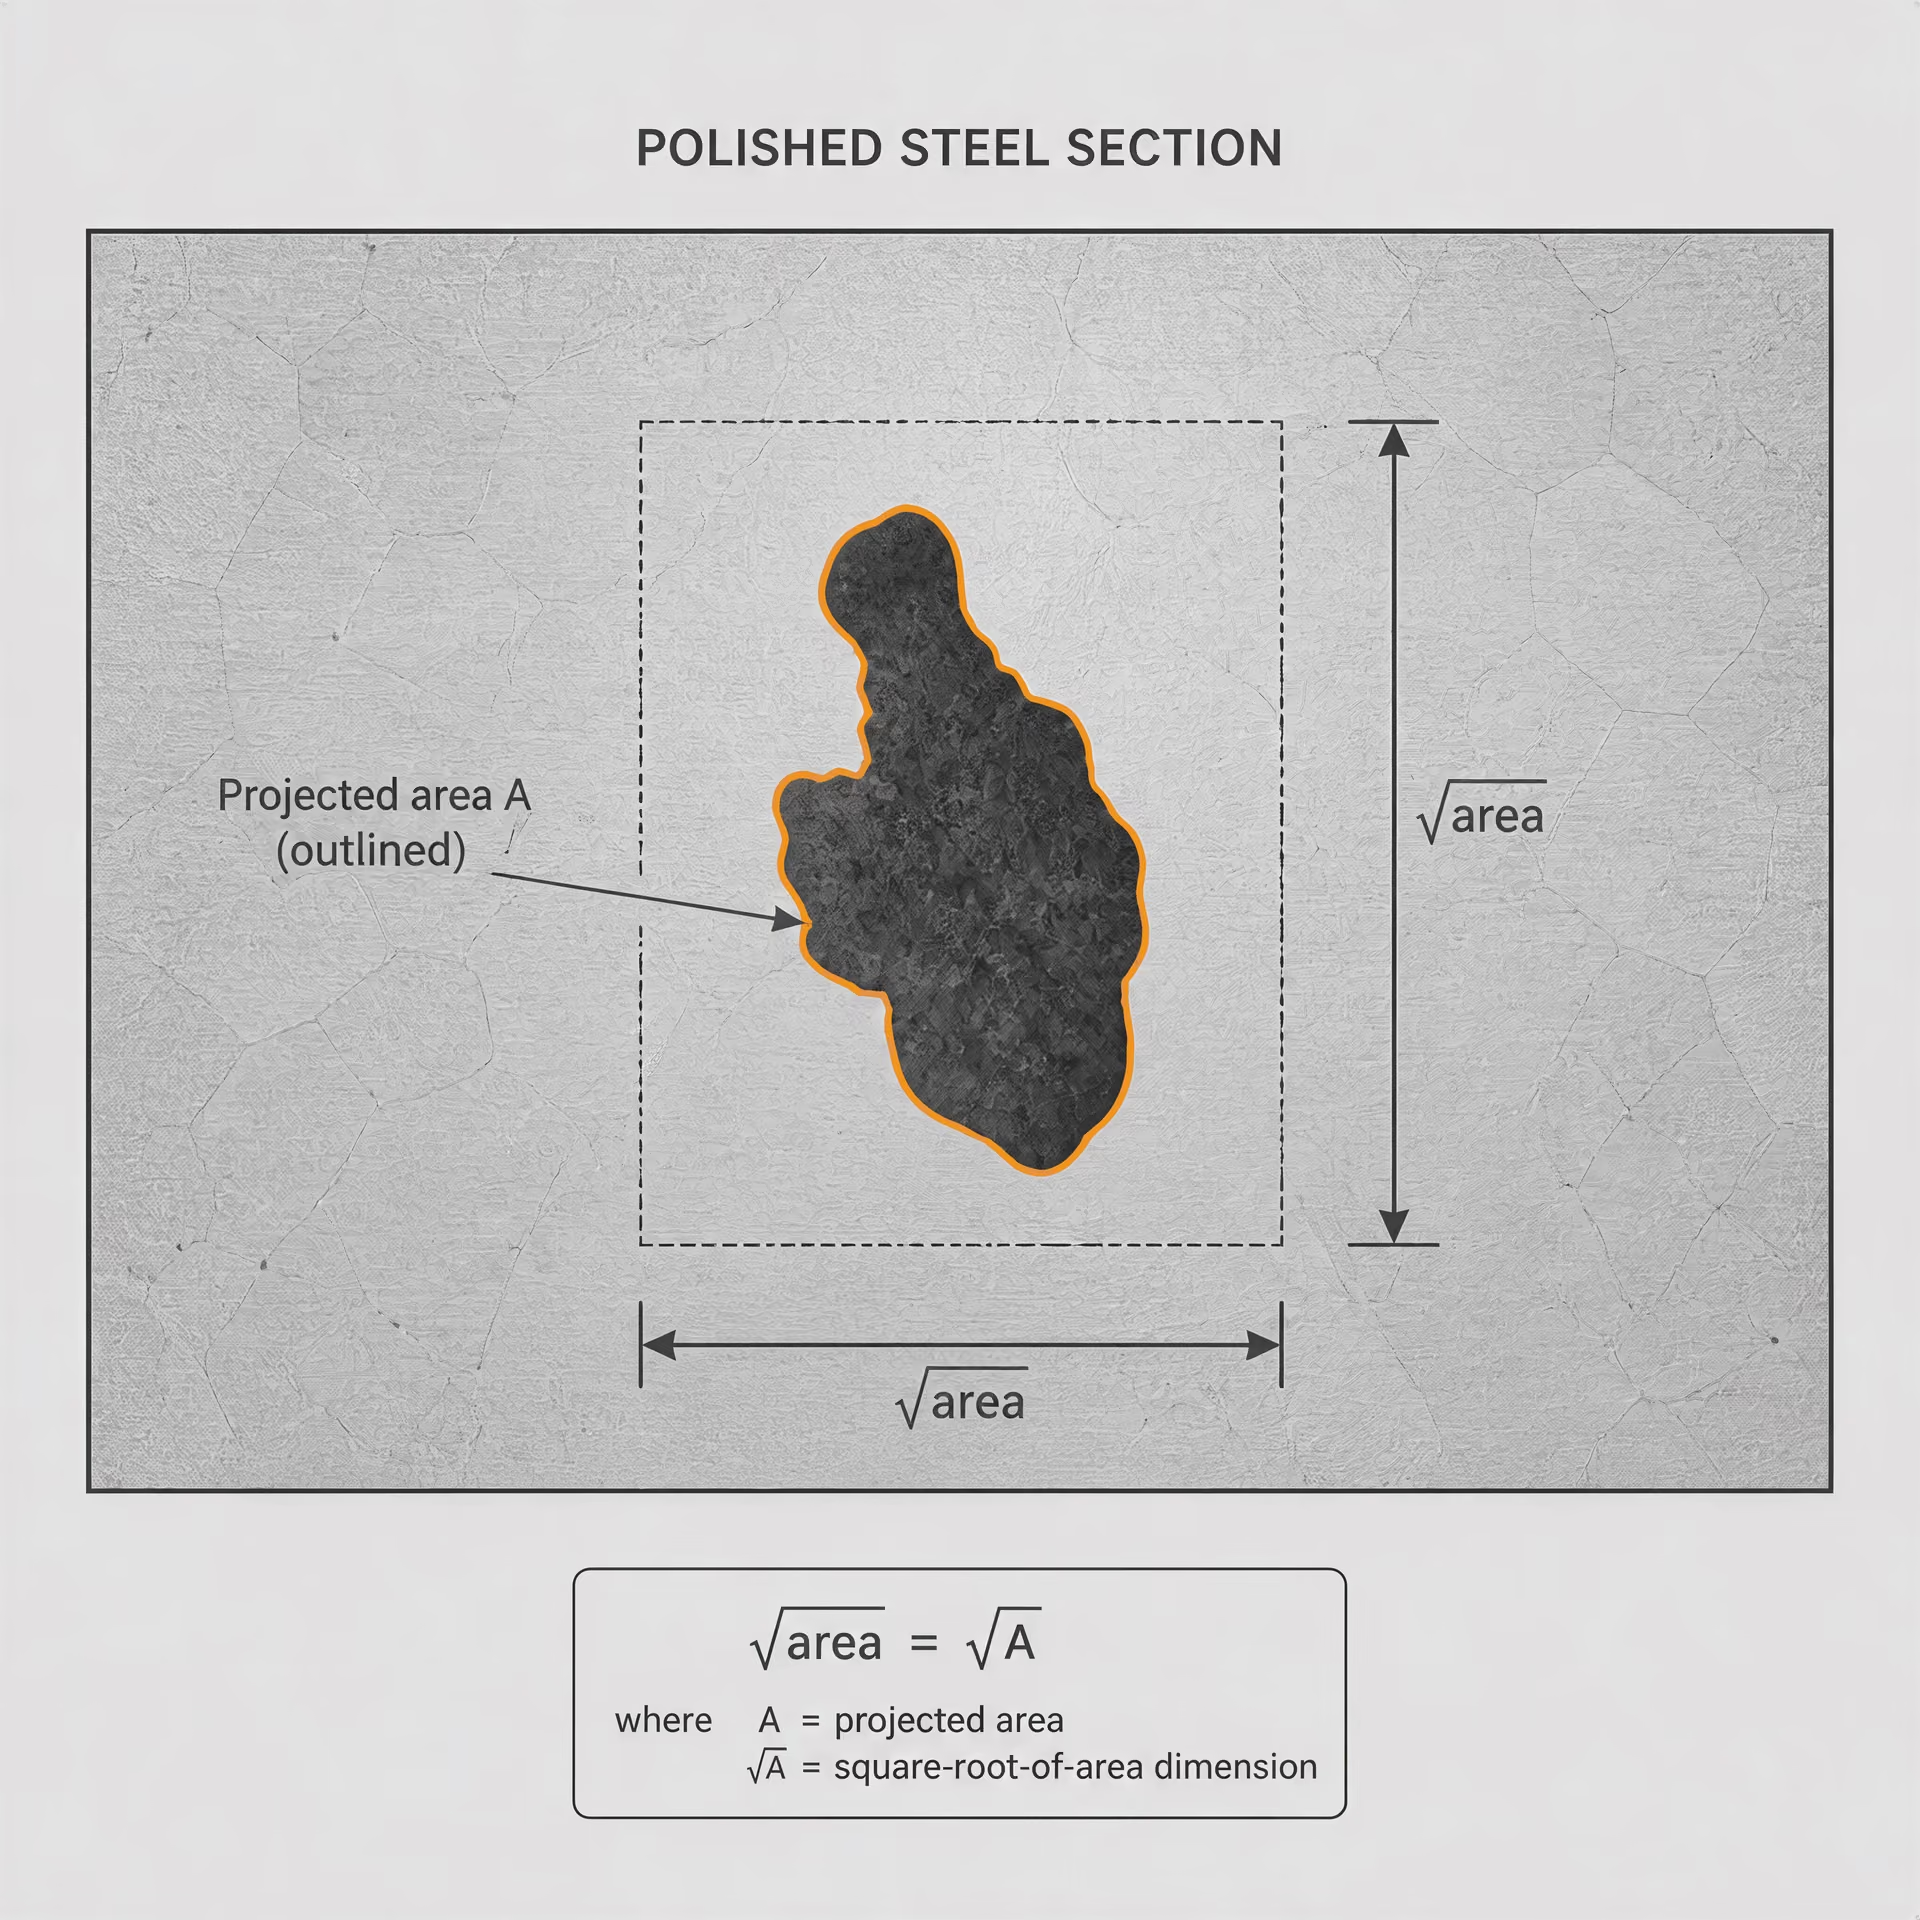
The √area concept
√area The square root of an inclusion's projected two-dimensional area on a polished section, used as a practical size parameter in extreme-value and fatigue-sensitive inclusion analysis.
For extreme inclusion assessment, maximum inclusion size is often expressed as √area, written as the square root of the inclusion’s projected area. If an inclusion occupies a polished cross-sectional area , its size parameter is
If is measured in square micrometres, √area is reported in micrometres. A roughly circular inclusion with a projected area of 400 µm² therefore has √area = 20 µm. The parameter is not a claim that the inclusion is a sphere or that its actual three-dimensional volume has been measured. It is a practical two-dimensional descriptor of the defect presented by the polished section.
This measure became important in inclusion-sensitive fatigue analysis because crack initiation depends on more than an inclusion count. A large, hard, poorly bonded oxide can create a severe local stress concentration, particularly near the surface or at a location subjected to high cyclic stress. Shape, hardness, elastic mismatch, surrounding matrix condition, and position remain important. √area does not replace those variables; it supplies a consistent size variable for comparing unusually large observed particles.
The JIS bearing-steel study used maximum √area as an extreme-value variable rather than treating it as another average cleanliness index. That change in question is decisive. Instead of asking how many inclusions occur in an ordinary field, the analyst asks how the largest observed values behave as the inspected area increases and what maximum size may be expected at a specified risk level.
A steel can therefore have few inclusions overall and still require attention because its largest √area value is high. Conversely, a steel with more small sulfides may receive a less favorable routine count while posing less fatigue risk than a steel containing a single large calcium-aluminate or alumina cluster. Chemistry still matters: SEM/EDS may distinguish alumina, calcium aluminates, silicates, sulfides, and complex oxide inclusions that an optical chart groups only by appearance.
ASTM E2283 and extreme-value analysis
ASTM E2283-08(2019) addresses extreme-value analysis of nonmetallic inclusions in steel. It belongs to the jurisdiction of ASTM Subcommittee E04.09, which also covers ASTM E45-25. The two standards therefore sit within the same ASTM technical area but answer different measurement questions. ASTM E45 supplies established methods for determining and reporting inclusion content; ASTM E2283 addresses the statistical treatment of rare, large inclusions.
Extreme-value analysis does not magically reveal an unseen particle. It estimates the distribution of maxima from measured observations, so the result depends on specimen preparation, inspected area, sampling plan, detection threshold, and whether the observations are independent and representative. A polished longitudinal section may show elongated inclusions differently from a transverse section. Surface-near particles may be more damaging than particles deep in the section, while a large cluster may be counted as one feature or many depending on the image-analysis rule.
For that reason, √area and ASTM E2283 are not replacements for every cleanliness measurement. Chart ratings remain useful for routine morphological comparison. Automated image analysis can quantify number, length, area, and distribution. SEM/EDS can identify composition. Total-oxygen analysis can track the bulk oxygen level. ASTM E2283 adds a way to estimate the significance of the largest and rarest observations.
The practical question should be stated before testing: is the purpose to compare average inclusion content, identify inclusion chemistry, verify a production trend, or estimate the maximum defect relevant to fatigue? A conventional rating may answer the first question well and the last one poorly. Clean-looking fields are evidence about those fields. They are not proof that the largest inclusion in the steel is small.
Automated Inclusion Analysis: Image Analysis, SEM, and X-Ray Characterization
Computer-assisted scanning and classification
Computer-assisted inclusion analysis converts a polished steel section into a measured image rather than a visual impression. A camera or microscope scans a defined area, separates particles from the steel matrix by contrast, and records each detected feature’s length, width, area, aspect ratio, orientation, and position. The software can then classify particles by shape or by rules derived from a reference standard. This is a more repeatable way to collect measurements than asking an operator to compare a field with a printed chart, especially when inclusions are numerous, small, or widely distributed.
Automation does not create a universal cleanliness number. ASTM E45-25 provides four macroscopic and five microscopic methods for determining and reporting inclusion content in wrought steel, and those methods answer different questions. Its microscopic reference charts use A-sulfide, B-alumina, C-silicate, and D-globular-oxide categories, with thin and heavy series rated at 100× over a specimen field of approximately 0.50 mm². These designations are primarily morphological reporting classes, not direct chemical identifications. A particle rated as a B-type inclusion has a shape and arrangement consistent with that class; the rating does not prove that every particle is chemically pure alumina.
Image analysis can reproduce such chart-based measurements, but it can also report quantities that a chart hides. It may count thousands of particles, calculate the size distribution, map their positions across a section, and distinguish elongated sulfide stringers from approximately globular oxides. ISO 4967:2026 permits standard reference charts or image analysis for rolled or forged steel products with a reduction ratio of at least 3. DIN EN 10247:2017 specifies a related European micrographic examination using standard pictures, while JIS G 0555:2020 assigns Type A, Type B, and Type C according to deformation, continuity, and dispersion rather than chemical composition.
The result still depends on the image-processing decisions. A threshold that detects a faint oxide halo may also include polishing scratches. A threshold set too high may discard small inclusions. Magnification, illumination, etching, focus, segmentation rules, minimum particle area, and treatment of touching particles all change the reported population. Calibration against a stage micrometer and control specimens is necessary; agreement between two software packages is not proof that either one has identified every inclusion.

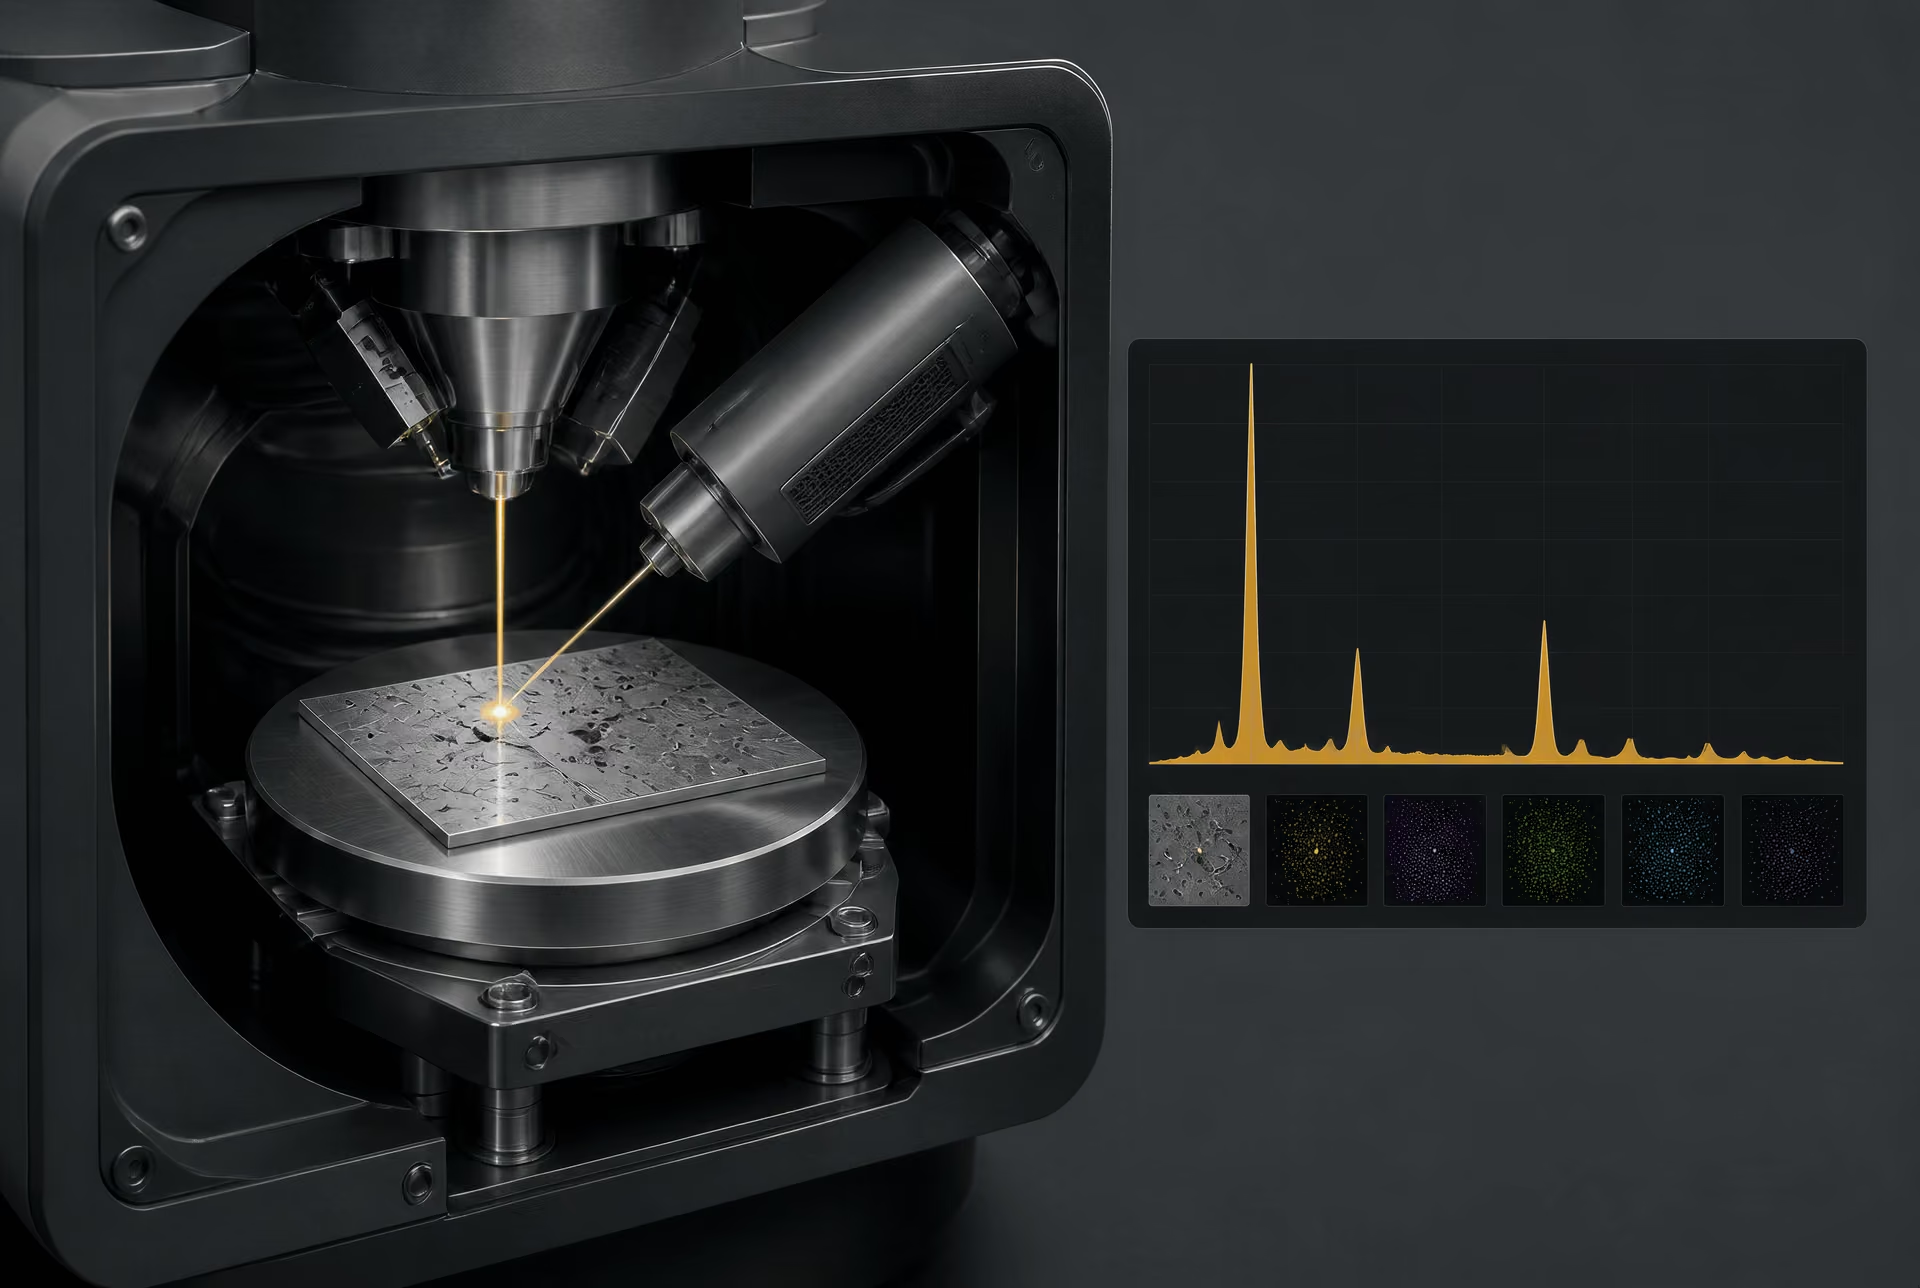
SEM with X-ray analysis
Scanning electron microscopy adds chemical sensitivity to the geometry obtained from optical imaging. In backscattered-electron mode, phases with higher average atomic number generally appear brighter than steel, while secondary-electron imaging emphasizes surface form. An energy-dispersive X-ray detector can then collect characteristic X-rays from a selected particle. The resulting spectrum may indicate manganese and sulfur in a manganese sulfide, aluminum and oxygen in an alumina-rich particle, calcium and oxygen in a calcium aluminate, or titanium and nitrogen in a titanium nitride. The analysis can also reveal mixed or layered particles that look similar in an optical micrograph.
The DOE-sponsored ASCAT project is a named example of this approach. ASCAT developed a computer-controlled scanning electron microscopy system with X-ray analysis to characterize individual inclusions and relate their size, composition, and distribution to overall steel cleanliness. That distinction matters. A morphology-only rating records what an inclusion looks like after working and polishing; ASCAT-style characterization asks what each particle contains, how large it is, and where particles of that chemistry occur.
SEM/EDS is not a perfect chemical assay. The interaction volume can extend below a small inclusion into the steel matrix, so an analysis of a particle only a few micrometres across may contain iron from surrounding material. Surface contamination, roughness, detector geometry, accelerating voltage, standard selection, and matrix corrections affect quantitative results. Light elements may be difficult to measure accurately, and an EDS spectrum commonly supports a composition class rather than a precise stoichiometric formula. Confirming oxygen, carbon, or nitrogen may require suitable standards or complementary methods such as wavelength-dispersive spectroscopy.
Total-oxygen analysis measures another quantity altogether. It estimates the total oxygen retained in a steel sample, including oxygen in oxide inclusions and, depending on the procedure and sample condition, dissolved oxygen or other oxygen-bearing contributions. It does not identify each inclusion, establish its morphology, locate it through the section, or reveal whether the oxygen is concentrated in a few large alumina clusters. Conversely, an automated image scan can miss inclusions below its detection limit while still describing the visible population in detail. Total oxygen and inclusion imaging therefore complement one another rather than substitute for one another.
Relating individual inclusions to a steel population
A measured particle is not automatically representative of the heat, strand, billet, or finished bar. Inclusions segregate during solidification, align during rolling, and may cluster near the centerline, quarter-thickness region, surface, or a particular sampling plane. Location can control failure risk even when the average count is low. ASTM B796 makes the same point for ferrous powders intended for powder forging: inclusion composition, size, distribution, and location strongly influence near-full-density material.
Minimum controls for automated inclusion analysis
- Product orientation Specify the section direction relative to rolling or forging.
- Section location Record whether the scan is near the surface, at quarter-thickness, at the centerline, or elsewhere.
- Polished area and magnification Define the inspected area, field count, magnification, and detection limit.
- Image-processing rules Document thresholding, segmentation, minimum particle size, and treatment of touching particles.
- Reporting Preserve the full size and spatial distribution rather than reporting only an average.
A sound automated study defines the sampling plan before scanning. It specifies product orientation, section location, polished area, magnification, detection limit, number of fields, and whether particles intersecting an edge are included. It also records the full distribution rather than only an average. A steel with many small inclusions may behave differently from one containing a few large particles with the same total inclusion area.
Extreme-value methods address that difference. ASTM Subcommittee E04.09 lists ASTM E2283-08(2019), which concerns extreme-value analysis of nonmetallic inclusions in steel, alongside ASTM E45-25. A peer-reviewed JIS study reported that conventional ASTM and JIS ratings may fail to distinguish very clean bearing steels, where the largest inclusion can matter more than the field average. Maximum inclusion size expressed as √area can be evaluated with extreme-value statistics, linking observed particles to an estimated upper tail rather than pretending that a limited scan found the largest possible defect.
Automation improves consistency and data volume. It does not remove sampling error, threshold choices, calibration requirements, or the need to interpret what a reported population means for the product and its failure mechanism. The useful result is therefore not a single “clean” grade, but a documented measurement of specified particles under a specified method.
From Cleanliness Data to Engineering Interpretation
A cleanliness result is not a universal grade assigned to a heat of steel. It is an observation produced by a defined specimen, preparation method, examined area, magnification, classification system, and reporting rule. ASTM E45-25, for example, provides four macroscopic and five microscopic methods for determining and reporting inclusion content in wrought steel. Those methods do not answer precisely the same question. A chart rating may describe the most severe field observed under a prescribed comparison, whereas automated image analysis can measure many more particles and report their dimensions and spatial frequency.
The engineering interpretation must therefore connect the measured population with the failure mechanism. A steel with fewer inclusions is not automatically safer in every application if its remaining particles are larger, more angular, more brittle, or concentrated in a critical region. Conversely, a higher count of small, rounded inclusions may have a different effect from a lower count of elongated alumina clusters. One number cannot preserve all of that information.
Composition, size, distribution, and location as separate variables
Inclusion composition controls properties such as hardness, fracture resistance, deformability, and interfacial adhesion with the steel matrix. Manganese sulfide may deform during rolling, producing an elongated Type A population under JIS G 0555:2020. Alumina particles are generally hard and angular; silicates may deform or fragment during working; globular oxides have a different shape response. ASTM E45 chart categories A, B, C, and D are morphological reporting classes, not direct chemical assays. Its reference charts identify A-sulfide, B-alumina, C-silicate, and D-globular-oxide types, with thin and heavy series rated at 100× over a field of approximately 0.50 mm².
Size matters because stress concentration rises as an inclusion becomes larger relative to the surrounding microstructure and loaded section. The largest particle can dominate fatigue behavior even when the average field appears clean. An average diameter or mean inclusion count suppresses the tail of the size distribution—the small fraction containing the critical defect. ASTM E2283-08(2019), under ASTM Subcommittee E04.09, addresses extreme-value analysis for this reason. In bearing steels, maximum inclusion size is often expressed as √area, the square root of the inclusion’s projected area, and evaluated statistically rather than inferred from an ordinary average field.
Distribution is a separate variable again. Particles may be uniformly dispersed, aligned in rolling bands, grouped in clusters, or concentrated near a segregation zone. Two heats with the same total inclusion area can present different crack-initiation risks if one has isolated particles and the other has stringers or clusters. JIS G 0555:2020 distinguishes Type A inclusions formed by viscous deformation during working, Type B granular and discontinuous inclusions, and Type C irregularly dispersed inclusions without viscous deformation. These distinctions describe spatial and deformation behavior, not simply particle quantity.
Location determines whether a particle is exposed to a damaging stress field. An inclusion near the maximum shear region, a raceway contact zone, a machined surface, or a weld-affected area may matter more than an equal particle deep inside a lightly stressed volume. Sampling location must therefore represent the product geometry and process direction. Total oxygen can indicate the overall oxide burden, but it does not identify which particle is largest, where it lies, or whether it is an alumina cluster or a rounded oxide. SEM/EDS, automated inclusion analysis, and metallographic examination supply different parts of that answer.
Bearing steel and fatigue-sensitive applications
Bearing steel illustrates why cleanliness cannot be reduced to a single ranking. Rolling-contact fatigue repeatedly subjects a small subsurface volume to high cyclic shear and compressive stresses. A hard, angular inclusion or a cluster can initiate a crack, while a softer inclusion may deform and produce a different stress field. The relevant comparison is not merely “Heat A has fewer inclusions than Heat B.” It is whether the two heats have comparable chemistry, maximum √area, cluster frequency, orientation, and sampling confidence in the highly stressed material.
Conventional ASTM E45 and JIS ratings can fail to distinguish very clean bearing steels because chart classes and examined fields may not resolve the rare extreme particle that controls life. The peer-reviewed JIS study on bearing steel cleanliness therefore considered maximum inclusion size through extreme-value statistics. That approach estimates the likely largest inclusion in a specified volume from a measured population; it does not pretend that a small polished section has observed every possible defect.
Application claims must remain conditional. If failures originate at large oxide particles, extreme-value sizing and SEM/EDS characterization may be more informative than total oxygen. If elongated sulfides control anisotropic ductility or machinability, orientation and deformation class deserve greater weight. If surface-initiated fatigue dominates, near-surface sampling and location-specific inspection are essential. The method should follow the suspected mechanism.
Powder-forging implications under ASTM B796
ASTM B796 addresses nonmetallic inclusions in ferrous powders intended for powder forging, where compaction, sintering, and forging produce near-full-density material. Its central engineering point is direct: inclusion composition, size, distribution, and location strongly influence the resulting material. A powder inclusion is not automatically equivalent to an inclusion in cast or wrought steel. It may occur within an individual powder particle, at a particle boundary, or in a region altered during sintering and forging.
Composition affects whether the particle deforms, fragments, reacts, or remains as a brittle discontinuity during densification. Size affects the remaining pore or crack scale after forging. Distribution affects whether defects are isolated or linked into a damaging chain, while location determines proximity to residual porosity, prior particle boundaries, and the final component’s tensile or fatigue stress field. Near-full density reduces porosity, but it does not erase a large refractory oxide or a concentrated inclusion cluster.
ASTM B796 should therefore be read as a warning against transferring a wrought-steel chart rating directly to powder-forged material. The measured powder population and the finished part’s processing history must be connected. A suitable assessment may combine metallographic observation with image analysis and chemical identification, then examine whether the detected inclusions coincide with fracture origins or fatigue damage. The result is an engineering interpretation, not a universal cleanliness score.
How to Compare Results Across Standards Without Creating False Equivalences
A cleanliness rating is an observation produced by a defined test, not a universal material grade. Two laboratories can examine steel from the same heat and report different results without either result being incorrect. The difference may arise from the chart series, specimen plane, inspected area, magnification, inclusion definitions, or the way a large but rare particle is treated.
ASTM E45-25 illustrates the point. It provides four macroscopic and five microscopic methods for determining and reporting inclusion content in wrought steel (ASTM International, 2025). Its microscopic chart method assigns morphological categories—A, B, C, and D—to sulfide, alumina, silicate, and globular-oxide appearances. Those letters are not direct chemical identifications. An “A” rating does not prove that every particle is manganese sulfide, just as a “D” rating does not establish a particular oxide chemistry without analytical confirmation.
Questions to ask before comparing ratings
Before placing two reported numbers in the same table, record the following:
- Standard and edition: Was the result obtained under ASTM E45-25, ISO 4967:2026, DIN EN 10247:2017, JIS G 0555:2020, SAE J422:201801, or another document? Edition changes can alter definitions and procedure.
- Product form and reduction history: Was the material rolled, forged, bar, plate, powder-forged, or cast? ISO 4967:2026 applies to rolled or forged products with a reduction ratio of at least 3. A cast product or lightly worked product should not be treated as though it met that sampling basis.
- Specimen orientation: Was the section longitudinal, transverse, or through-thickness? Working elongates many inclusions, so the same steel can show different lengths and distributions on different planes.
- Magnification and field area: ASTM E45 reference charts use 100× magnification and a specimen field area of approximately 0.50 mm². A result based on another magnification or inspected area is not automatically equivalent.
- Rating series: Were thin and heavy series both available, or was only one series reported? A heavy-series observation represents a different population threshold from a thin-series observation.
- Category definitions: ASTM E45 uses A-sulfide, B-alumina, C-silicate, and D-globular-oxide chart types. JIS G 0555:2020 instead defines Type A as inclusions formed by viscous deformation during working, Type B as granular and discontinuous inclusions, and Type C as irregularly dispersed inclusions without viscous deformation. The shared letters do not carry shared meanings.
- Image-analysis settings: For automated work, record thresholding, segmentation rules, minimum detectable size, equivalent-diameter or area definition, touching-particle treatment, and whether pores or scratches were excluded.
- Chemistry measurement: Was inclusion composition measured by SEM/EDS, or was the result based only on reflected-light morphology? Total oxygen is a bulk indicator, not a count or identity for individual inclusions.
Location also matters. A dispersed population of small oxides and one inclusion cluster near a fatigue-critical surface can produce different engineering consequences even when their average count is similar. ASTM B796:2020 makes the same general point for ferrous powders intended for powder forging, identifying composition, size, distribution, and location as important influences on near-full-density material.
When chart grades are not numerically portable
ASTM E45, ISO 4967, DIN EN 10247, JIS G 0555, and SAE J422 should be treated as defined methods, not translation tables. ISO 4967:2026 specifies a micrographic procedure using reference charts or image analysis; DIN EN 10247:2017 is the German and European standard for micrographic examination using standard pictures. Their relationship does not mean that an ISO rating of 1.0 can be converted by arithmetic into a DIN, ASTM, or JIS rating.
SAE J422:201801 defines a microscopic practice for quantitative cleanliness determination, but its photomicrographs are not intended for resulfurized grades or high-carbon bearing-quality steels generally classified using ASTM E45. That limitation alone prevents a universal conversion rule.
Chart systems also compress information. They emphasize whether an observed field resembles a reference picture, while automated analysis can measure particle count, area, equivalent size, aspect ratio, and spatial position. The ASCAT project demonstrated the value of computer-controlled scanning electron microscopy with X-ray analysis by linking individual inclusion size and composition with distribution. These are different measurements, not interchangeable versions of one score.
Very clean bearing steels expose the problem. A peer-reviewed JIS study reported that conventional ASTM and JIS ratings may fail to distinguish such materials because the inspected fields contain few visible inclusions. In that situation, maximum inclusion size expressed as √area and evaluated with extreme-value statistics can be more informative than an average chart grade. ASTM E2283-08(2019), listed by ASTM Subcommittee E04.09 alongside ASTM E45-25, addresses this type of extreme-value analysis. A maximum-value estimate is not a substitute for a chart rating; it answers the question, “How large might the largest inclusion be in a larger material volume?”
A reporting template for steel-cleanliness data
A defensible report should preserve the method before presenting the number:
Material: grade, heat, product form, section size, and reduction history. Method: standard designation and edition; preparation method; specimen orientation; magnification; field area or scanned area; number and selection of fields. Rating: chart or image-analysis series; category definitions; observed rating by category, including thin/heavy designation where applicable. Chemistry: whether SEM/EDS or another method identified inclusion composition; report phases such as MnS, alumina, calcium aluminate, or silicate only when measured. Size and distribution: count, area fraction, size metric, aspect ratio, clustering, and location. Extreme value: maximum observed size, √area definition, confidence method, and sampled volume or area. Interpretation: state explicitly that the result is method-dependent and do not convert it to another standard without a validated correlation study.
That format keeps an observed rating separate from chemistry, size distribution, and extreme-value risk—the distinctions needed to compare data without manufacturing equivalence.
References
- [1] ASTM E45: Standard Practice for Determining the Inclusion Content of Steel. ASTM International standard, 2025. https://store.astm.org/standards/e45
- [2] ASTM E45 Adjunct Reference Charts for Inclusion Rating. ASTM International adjunct, 2025. https://store.astm.org/adje004502a.html