



What a Steel Tensile Test Actually Measures
A steel tensile test is a controlled experiment in which a metallic specimen is pulled along one defined axis until it yields, strains, necks, and usually fractures. The machine records force and displacement; the reported stress–strain curve is calculated from those measurements and from dimensions taken before and after testing. It is not a direct ranking of steel grades independent of the test setup.

The specimen, loading axis, and room-temperature test
| Comparison factor | Flat specimen | Round specimen |
|---|---|---|
| Cross-section | Width and thickness | Initial diameter |
| Initial area calculation | A0 = w0t0 | A0 = πd0²/4 |
| Typical use in the article | ASTM flat tensile specimens | Round tensile specimens |
| Key reporting requirement | Width, thickness, gauge length | Diameter, gauge length |
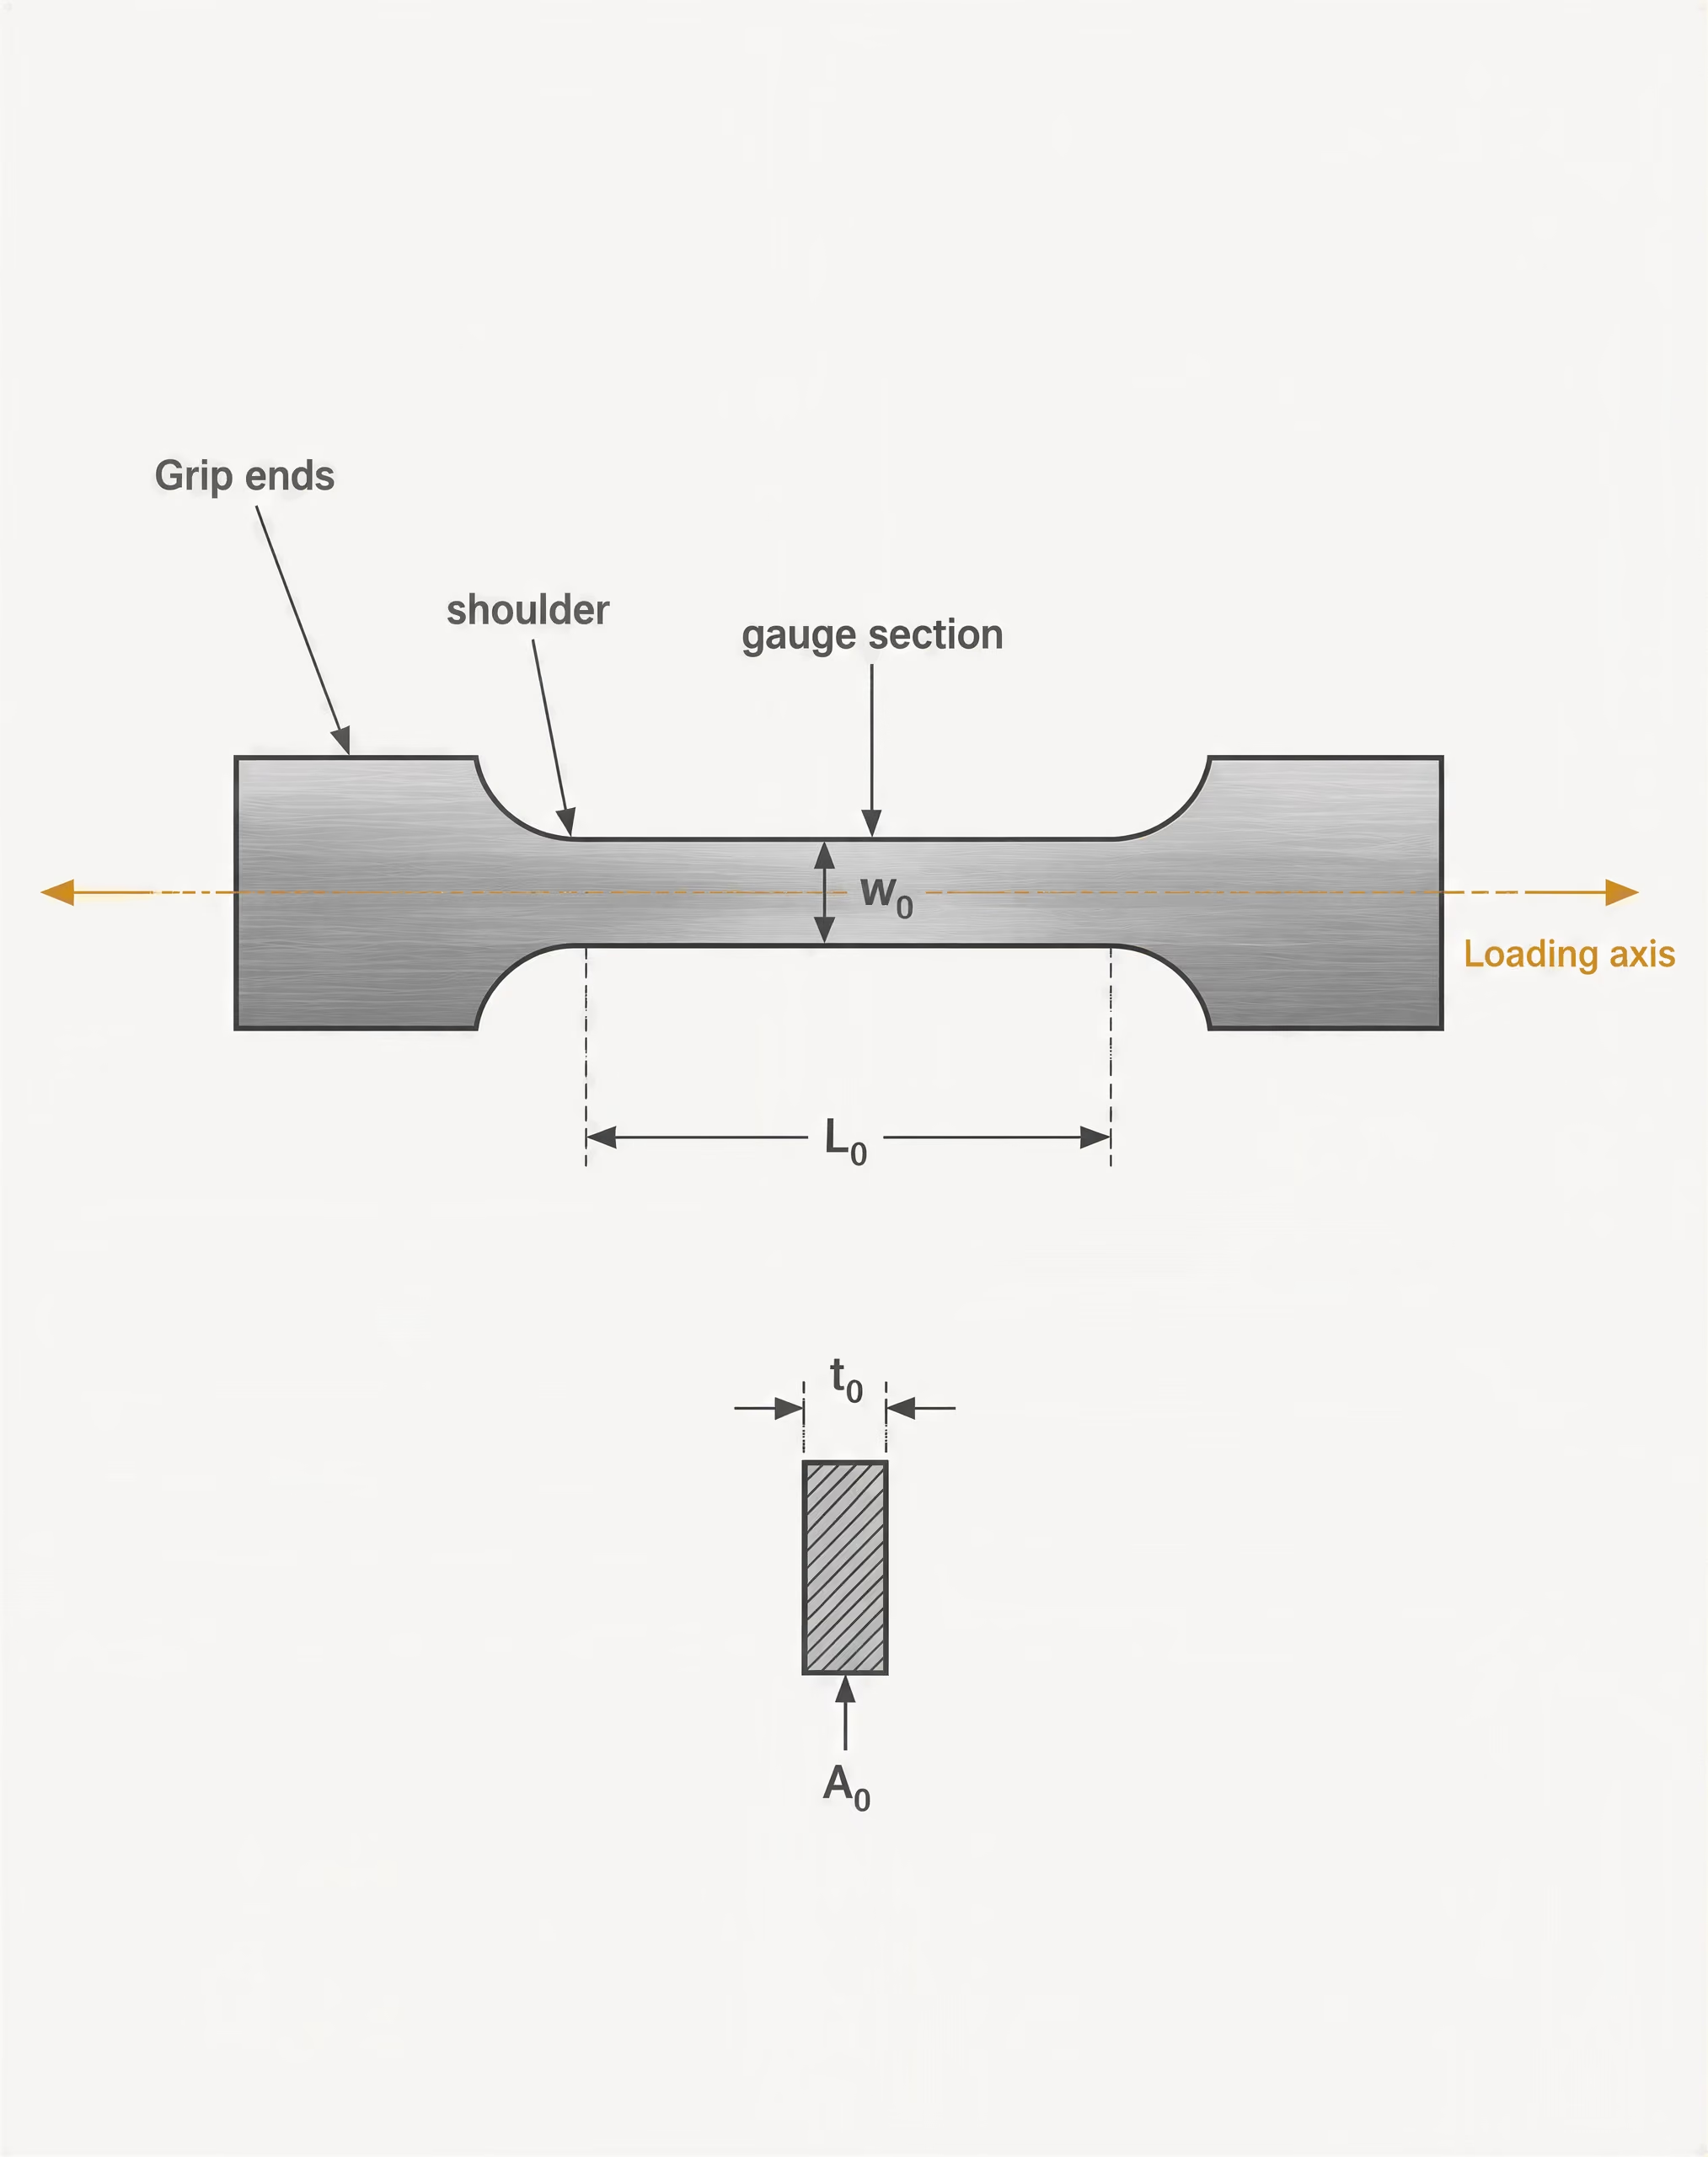
Gauge section The reduced portion of a tensile specimen between the grip ends where deformation and fracture are intended to occur.
The specimen has a reduced section, called the gauge section, between wider ends that fit the testing-machine grips. Its initial cross-sectional area, , and initial gauge length, , must be measured before loading. Specimens may be round or flat, and their dimensions, shoulder shape, grip arrangement, and gauge length are controlled by the applicable standard. A flat specimen cut parallel to the rolling direction does not necessarily produce the same elongation as one cut transverse to that direction, because rolling can create directional differences in microstructure and mechanical response.
The loading axis should pass through the specimen’s intended centerline. Misalignment introduces bending, so one side of the gauge section can experience greater stress than the other. The machine then measures a response that reflects both tension and unintended bending. Grip slippage, a poorly machined shoulder, surface damage, or an incorrect gauge-length mark can also alter the result.
ASTM E8/E8M-21 covers tension testing of metallic materials at room temperature. It includes procedures for determining yield strength, yield-point elongation, tensile strength, elongation, and reduction of area. ISO 6892-1:2019 likewise specifies a room-temperature tensile-test method for metallic materials and defines mechanical properties obtainable from that test. “Room temperature” is therefore part of the test description, not an assumption that can be omitted. A result from a heated specimen or a high-temperature furnace test belongs to a different test condition.
The specimen is loaded monotonically, but the rate matters. The testing machine may control crosshead speed, strain rate, or another rate-related parameter depending on the standard and procedure. NIST data for ASTM A1008 steel include average strain rates of , , and . Those are separated by four orders of magnitude. At higher rates, the measured flow stress can change, and the apparent yield and tensile strengths may shift.
Mechanical properties reported from the test
Engineering stress is calculated as force divided by the specimen’s initial cross-sectional area:
Engineering strain is the change in gauge length divided by its initial value:
Michigan Technological University and Georgia Tech describe these conventions using the same initial-area and initial-gauge-length basis. Consequently, engineering stress does not continuously update the area as the specimen narrows.
Yield-point elongation Plastic extension occurring over a measurable strain interval during which engineering stress remains nearly constant or follows a characteristic yield-point pattern.
The early straight portion of the curve indicates elastic proportional behavior. The DOE Fundamentals Handbook identifies the proportional limit, yield strength, ultimate strength, and fracture point on a typical engineering curve for structural steel. Yield strength may be identified by a distinct yield point or by a specified offset method, commonly a 0.2% proof or offset strain when no sharp yield point appears. Some steels show a yield-point elongation: the specimen extends plastically over a measurable strain interval while the stress remains nearly constant or changes in a characteristic way. ASTM E8/E8M-21 explicitly includes yield-point elongation among the quantities determined by the test.
Tensile strength, also called ultimate tensile strength in many reports, is the maximum engineering stress. It occurs before or around the onset of localized necking. After necking begins, the actual area in the neck continues to decrease, while engineering stress still uses ; the plotted curve can therefore fall even as the local true stress rises. MIT’s 2004 laboratory material distinguishes tensile strength taken from an engineering stress–strain curve from true tensile strength, which accounts for cross-sectional reduction.
Elongation is the permanent increase in the specified gauge length after fracture, expressed as a percentage. Its value depends strongly on gauge length: a short gauge length can contain more localized necking and often gives a different percentage than a longer one. Reduction of area is calculated from the initial area and the smallest final area at the fracture region. It describes localized contraction and is not interchangeable with elongation.
A Syracuse University experiment on carbon-steel 1018 used ASTM flat tensile specimens to determine yield stress, ultimate stress, and rupture stress. That example shows why even a familiar designation such as 1018 must be accompanied by specimen and procedure details.
Why a result is inseparable from its test method
Information required with a reported value
- Material Grade, product condition, heat or lot where available, and product form.
- Geometry Specimen shape, dimensions, orientation, initial area, and gauge length.
- Test condition Temperature, strain rate or machine-speed requirement, and applicable standard.
- Measurement Extensometer, crosshead displacement, strain gauge, or optical measurement method.
- Property definition Yield-point, offset proof stress, engineering stress, true stress, elongation, and reduction-of-area conventions.
A reported value such as “steel yield strength: 350 MPa” is incomplete. The reader needs the grade and product condition, specimen geometry, loading direction, initial area, gauge length, temperature, strain rate or machine-speed requirement, extensometer or displacement measurement, yield-strength definition, and applicable standard.
Measurement technique can change the curve. NIST’s ASTM A1008 work used digital image correlation to determine displacement and strain at the stated strain rates, rather than relying only on crosshead travel. Crosshead displacement includes machine and grip compliance; it is not automatically the same as deformation within the gauge section. The National Bureau of Standards also reported that proof stresses in stainless steels and nonferrous metals can be affected by prior plastic deformation, rest intervals, internal stress, and work hardening.
At still higher rates, the distinction becomes sharper. A NIST structural-steel report presents high-strain-rate curves for perimeter-column steel with a specified yield strength of 50 ksi. Those curves cannot be compared directly with a slow, room-temperature laboratory curve as though only the grade mattered. The test result is a measurement of steel plus a defined specimen, method, and condition. Remove those definitions, and the number loses its engineering meaning.
How Engineering Stress and Engineering Strain Are Calculated
A tensile machine records force and displacement, but a stress–strain curve requires those measurements to be reduced using defined specimen dimensions. The commonly plotted engineering quantities refer to the specimen before loading, not to its continuously changing shape. That choice makes results straightforward to calculate and compare, provided the specimen geometry, gauge length, test standard, and measurement method are reported.
Engineering stress: F divided by initial area
Engineering stress is calculated from the applied tensile force divided by the specimen’s original cross-sectional area:
| Quantity | Engineering definition | Required starting measurement |
|---|---|---|
| Stress | σe = F/A0 | Initial cross-sectional area A0 |
| Strain | εe = (L − L0)/L0 | Initial gauge length L0 |
| Flat-specimen area | A0 = w0t0 | Initial width and thickness |
| Round-specimen area | A0 = πd0²/4 | Initial diameter |
Here, is engineering stress, is the tensile force, and is the cross-sectional area measured before the test begins. For a rectangular flat specimen,
where is the original specimen width and is its original thickness. For a round specimen,
where is the initial diameter.
Force is normally recorded in newtons (N), while area may be recorded in square millimetres (mm²). The resulting stress is then N/mm², numerically equal to megapascals (MPa), because . If force is expressed in kilonewtons and area in square millimetres, the force must be converted to newtons before calculating MPa. Stress may also be reported in pascals or pounds per square inch (psi), but the unit conversion must be applied consistently.
The use of is deliberate. As a steel specimen is pulled, its cross-sectional area usually decreases through elastic contraction and then through plastic deformation. After localized necking begins, the reduction becomes concentrated in a smaller region. Engineering stress does not recalculate the denominator at each instant; it continues to divide the measured force by the area that existed before loading. This convention preserves a common reference state for every point on the curve.
The result is not the same as true stress. True stress uses the instantaneous area, usually written as , where is the current local area. Consequently, the engineering curve can fall after its maximum force even while the local stress in a necked region continues to rise. The Massachusetts Institute of Technology’s 2004 laboratory material distinguishes tensile strength obtained from an engineering stress–strain curve from true tensile strength, which accounts for cross-sectional reduction.
Engineering strain: extension divided by initial gauge length
Engineering strain is the change in gauge length divided by the original gauge length:
Georgia Institute of Technology gives the equivalent notation . In these expressions, or is the original gauge length, and or is the measured gauge length during the test. Their difference, , is the extension.
Strain has no physical unit because it is a length divided by a length. It is commonly written as a decimal or multiplied by 100 and reported as a percentage. An extension of 0.25 mm from an original gauge length of 50.00 mm gives
or 0.5% engineering strain.
The original gauge length remains in the denominator even after the specimen has elongated because engineering strain is a normalized change relative to the starting geometry. This makes the reported value dependent on the defined gauge length, not merely on the machine crosshead movement. A 2 mm extension means 4% strain over a 50 mm gauge length but only 2% over a 100 mm gauge length. Elongation results therefore cannot be compared responsibly when gauge-length definitions differ.
Michigan Technological University states engineering strain as displacement divided by the initial gauge length, while its engineering-stress definition uses load divided by the initial cross-sectional area. These definitions are simple, but they are reproducible only when , , and the way displacement was measured are known.
Units, specimen dimensions, and data reduction
Data reduction begins before the first force reading. The operator records the specimen type, width, thickness or diameter, and gauge length, then calculates from the specified dimensions. The tensile machine supplies force as a function of time or displacement. An extensometer, strain gauge, or optical system supplies the gauge-length change. Each recorded pair is reduced using and , producing the engineering stress–strain curve.
The displacement measurement matters. Crosshead travel includes deformation in the grips, machine frame, and other components, whereas an extensometer measures a defined gauge section. Digital image correlation can measure displacement and local strain fields optically. NIST testing of ASTM A1008 steel examined average strain rates of , , and , with digital image correlation used for displacement and strain measurement. The resulting curve is therefore tied to both the loading rate and the measurement method.[1] Standard Specification for Tension Testing of Metallic Materials. ASTM International. ASTM International standard, 2021.[2] Metallic materials — Tensile testing — Part 1: Method of test at room temperature. International Organization for Standardization. ISO standard, 2019.[3] Properties of Metals. U.S. Department of Energy. DOE Fundamentals Handbook reference.
ASTM E8/E8M-21 covers room-temperature tension testing of metallic materials and addresses yield strength, yield-point elongation, tensile strength, elongation, and reduction of area. ISO 6892-1:2019 likewise specifies room-temperature tensile testing of metallic materials and the mechanical properties obtained from it. These standards define more than equations: they control specimen geometry, alignment, gauge length, loading rate, and reporting procedures. The U.S. Department of Energy’s typical structural-steel curve labels proportional limit, yield strength, ultimate strength, and fracture point, but each label depends on this preceding measurement and reduction process. A curve is only as reproducible as the dimensions and methods behind its axes.
Reading the Engineering Stress–Strain Curve
A tensile curve is a record of how a defined specimen responds to increasing load. It is not a universal ranking of steel grades. The reported result depends on the specimen’s shape, initial cross-sectional area, gauge length, loading rate, extensometer or displacement method, test standard, and the convention used to calculate stress and strain.
For an engineering stress–strain curve, engineering stress is
where is the applied load and is the specimen’s initial cross-sectional area. Engineering strain is
where is the initial gauge length and is the measured gauge length during loading. These definitions are given in teaching references from Michigan Technological University and the Georgia Institute of Technology. Because the original area and length remain in the denominators, the curve does not directly show the changing local stress and strain after the specimen begins to contract.
ASTM E8/E8M-21 covers room-temperature tension testing of metallic materials and the determination of yield strength, yield-point elongation, tensile strength, elongation, and reduction of area. ISO 6892-1:2019 specifies a room-temperature tensile-test method and defines mechanical properties obtainable from it. The curve must therefore be read alongside the test record, not separated from it.
Elastic response and proportional limit
At the origin, both load and deformation are zero. During the first portion of the curve, stress rises approximately in proportion to strain. Remove the load in this region and the specimen returns to its original dimensions, apart from small experimental errors. This is elastic deformation: the atomic bonds are displaced, but the material has not accumulated a permanent change in shape.
The slope of this initial straight portion is Young’s modulus, :
For a steel tested under ordinary conditions, this slope is commonly near 200 GPa, although the measured value can vary with alignment, extensometer accuracy, temperature, and the selected portion of the data. It should not be confused with yield strength. Modulus describes stiffness; yield strength describes the stress associated with the onset or specified amount of plastic deformation.
The DOE Fundamentals Handbook labels the end of the strictly linear portion the proportional limit. Beyond this point, the curve may remain partly elastic but is no longer exactly proportional. A specimen unloaded just above the proportional limit may recover most of its strain while retaining a small permanent extension. Once plastic deformation begins, the total strain can be viewed as the sum of elastic strain and plastic strain:
That distinction matters when interpreting elongation. The strain visible on the test machine is total strain; only the elastic component disappears on unloading.

Yield strength and yield-point elongation
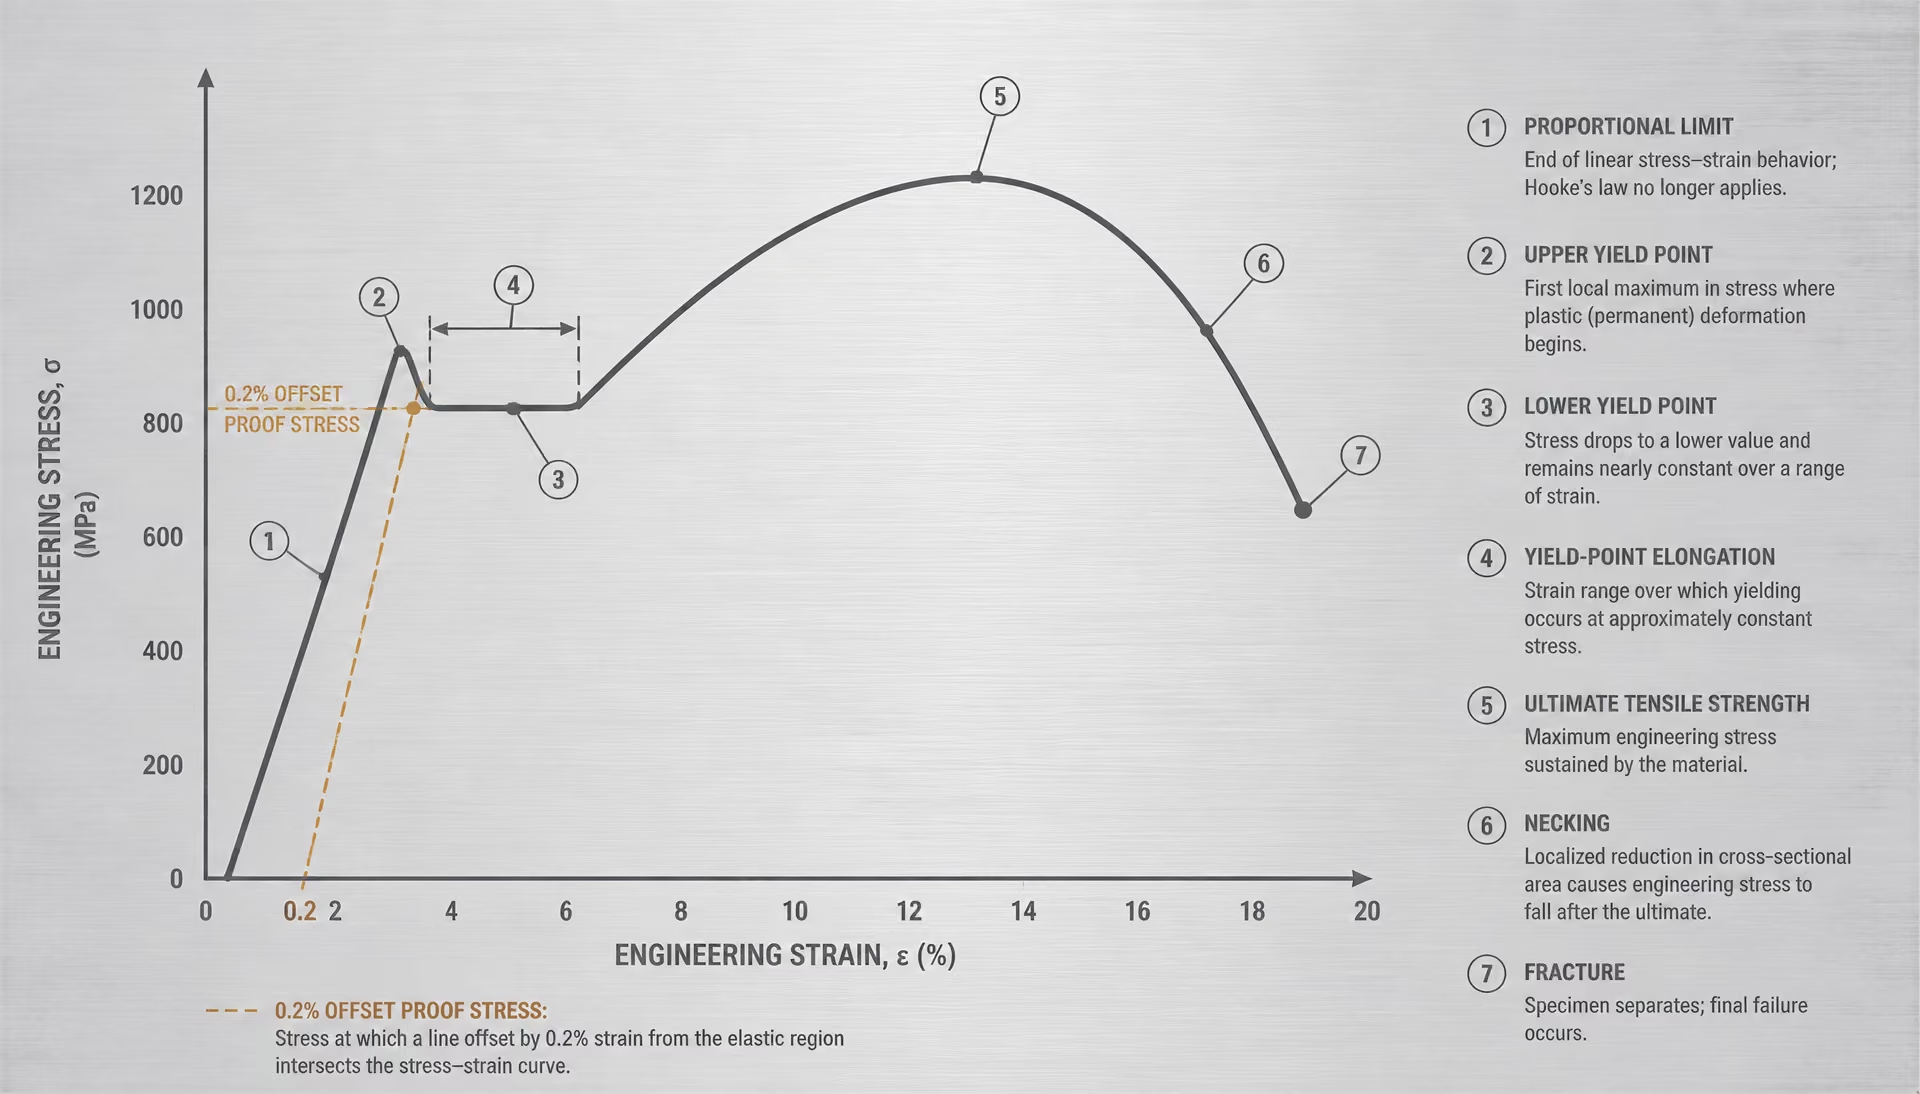
Yielding marks the transition to substantial plastic flow. In a steel with a distinct yield point, the curve may rise to an upper yield point, drop to a lower yield point, and then continue through a relatively flat region. The associated extension is called yield-point elongation. The specimen keeps lengthening while engineering stress changes little, and Lüders bands may spread through the gauge length.
This behavior is commonly associated with some low-carbon steels, including certain sheet and structural products, but it must not be presumed for every steel grade or every test record. A continuously yielding steel may show no sharp upper or lower yield point. Cold working, annealing history, interstitial carbon and nitrogen, aging, specimen geometry, and strain rate can alter or remove the yield-point feature.
When no distinct yield point is measurable, a standard may specify an offset method. The familiar 0.2% proof stress is obtained by drawing a line parallel to the initial elastic slope, offset by a strain of 0.002; its intersection with the curve defines the reported value. “Yield strength” and “0.2% proof stress” should not be treated as interchangeable labels unless the applicable standard and report make that correspondence clear. A National Bureau of Standards report on proof stresses in stainless steels and nonferrous metals documents the effects of prior plastic deformation, rest intervals, internal stress, and work hardening on such measurements.
After yielding, plastic strain accumulates. Unloading at any point produces an elastic recovery, but the specimen remains longer and, after sufficient loading, narrower than it was initially. Reloading can follow a shifted path because of work hardening.
Ultimate tensile strength, necking, and fracture
Following yield-point elongation, or continuous yielding where no plateau exists, the curve generally rises again as strain hardening increases the stress required for further plastic deformation. The highest engineering stress is the ultimate tensile strength (UTS), called ultimate strength in the DOE Fundamentals Handbook. It is calculated using the original area , even though the specimen has already elongated and its cross-section has changed.
At the UTS, localized deformation usually begins. A neck forms in the gauge section, concentrating strain into a smaller region. The actual area in the neck decreases rapidly, so the local true stress can continue to rise even while the engineering curve falls. The descending branch therefore does not mean that the material’s local resisting stress has simply vanished; it reflects the use of the initial area in the engineering-stress calculation.
MIT’s 2004 Civil Engineering Materials Laboratory notes distinguish tensile strength taken from an engineering curve from true tensile strength, which accounts for cross-sectional reduction. This distinction is especially important when comparing ductile steels with different gauge dimensions or reduction-of-area measurements.
The final point is fracture, identified by the DOE handbook after the necking region. Reported elongation and reduction of area are strongly affected by gauge length, specimen geometry, fracture location, and how the broken pieces are fitted back together. Syracuse University’s carbon-steel 1018 experiment, for example, used ASTM flat tensile specimens to determine yield stress, ultimate stress, and rupture stress; those values describe that defined test configuration, not an abstract grade-only property.
Strain rate and measurement method also change the curve. NIST reported ASTM A1008 steel tests at average strain rates of , , and , using digital image correlation for displacement and strain measurement. NIST also published high-strain-rate curves for perimeter-column steel with a specified yield strength of 50 ksi. Curves from those conditions should not be compared directly with a slow, extensometer-based room-temperature test without checking the standard and definitions first.
Yield Strength, Proof Stress, and the Meaning of 'Yield'
“Yield” does not name one universal feature of every steel stress–strain curve. It describes the transition from predominantly recoverable deformation to deformation that remains after unloading, but the reported value depends on how that transition appears and which rule a test standard requires. ASTM E8/E8M-21 covers room-temperature tension testing of metals and the determination of yield strength, yield-point elongation, tensile strength, elongation, and reduction of area. ISO 6892-1:2019 specifies a comparable room-temperature tensile-test method, but the definitions and reporting requirements must still be read from the governing standard rather than inferred from a familiar graph.
The usual engineering quantities already impose a convention. Engineering stress is , where is load and is the specimen’s initial cross-sectional area; engineering strain is , based on the initial gauge length . Michigan Technological University and Georgia Tech describe these definitions. A reported yield strength therefore belongs to a specimen, geometry, gauge-length definition, loading rate, measurement system, and specified interpretation—not to an abstract curve detached from the test.
Yield-point behavior versus a defined yield strength
Some low-carbon steels show a visible yield-point phenomenon. The curve reaches an upper yield point, drops, and then continues through a lower, relatively flat region of plastic strain. Lüders bands may move along the gauge length during this extension. In such a response, the material appears to “yield” through a recognizable event, so the upper or lower yield strength, yield-point elongation, and related quantities can be reported according to the applicable method.
Other steels do not show a sharp load drop. Stainless steels, many higher-strength grades, and steels tested under different conditions may pass gradually from elastic to plastic deformation. There is no defensible single point to select merely by looking for a bend. The proportional limit, which marks the end of strict proportionality between stress and strain, is also not automatically the yield strength. The U.S. Department of Energy’s Fundamentals Handbook places proportional limit, yield strength, ultimate strength, and fracture point on a typical structural-steel engineering curve, but those labels represent distinct properties.
The distinction matters because a curve can look smooth while still producing a formally defined yield value. ASTM E8/E8M-21 permits reporting based on yield-point behavior where that behavior is present and uses specified procedures where it is absent. ISO 6892-1:2019 likewise defines mechanical properties obtainable by the test, but its method and selected parameter control the result. A plot alone cannot establish which definition was used.
Proof stress and offset constructions
How the 0.2% proof stress is constructed
- 1. Establish the elastic slope Determine the initial slope of the stress–strain curve.
- 2. Set the offset Move a parallel line to a strain of 0.002, equivalent to 0.2%.
- 3. Locate the intersection The intersection of the offset line and the loading curve defines the proof stress.
- 4. Report the method State the standard, symbol, offset, slope determination, and acceptance procedure.
Proof stress provides a reproducible substitute when no clear yield point exists. The test records the loading curve, then identifies the stress that produces a specified permanent strain after unloading. A common construction is the 0.2% offset method: a line parallel to the initial elastic slope is drawn from a strain of 0.002, and its intersection with the curve gives the 0.2% proof stress, often written in ISO-style notation. The exact symbol, offset, slope determination, and acceptance procedure depend on the standard and material specification.
This is a construction, not a sudden physical event at exactly 0.2% strain. A 0.2% proof stress and a lower yield point answer different questions. The first asks what stress corresponds to a defined residual-strain criterion; the second identifies a feature of the material’s observed load response. Calling both simply “yield strength” can conceal that difference.
The National Bureau of Standards report on proof stresses in stainless steels and nonferrous metals shows why proof results require careful interpretation. Prior plastic deformation can alter the subsequent loading curve, and a specimen allowed to rest before reloading can exhibit a different proof stress from one tested continuously. Internal stress also affects the apparent onset of permanent deformation: tensile and compressive residual stresses can make one direction begin yielding sooner than the other. The reported proof stress is consequently sensitive to specimen history, not just alloy composition.
Measurement choices add another layer. NIST’s ASTM A1008 investigations used average strain rates of , , and , with digital image correlation for displacement and strain. Those are materially different tests, even when the nominal grade is unchanged. A crosshead displacement reading can include machine and grip compliance, whereas a gauge-mounted extensometer or digital image correlation system measures a different quantity.
Work hardening, rest intervals, and internal stress
After initial plastic flow, steel commonly work-hardens: further plastic strain requires increasing stress because dislocation interactions raise resistance to deformation. The curve therefore rises after a yield plateau or after a proof-stress crossing. That rise is not another yield point. It is the changing flow stress of material whose microstructure and internal stress state have already been altered.
Unload a work-hardened specimen and part of its strain recovers, while plastic strain remains. Reloading may follow a shifted elastic path and can produce a higher apparent proof stress. A rest interval can permit recovery processes or changes associated with strain ageing, so the subsequent response need not match immediate reloading. The National Bureau of Standards proof-stress report treats these effects as central experimental variables, not minor disturbances.
This is why “steel A has a higher yield strength than steel B” is meaningful only when the two values share a test standard, temperature, strain rate, specimen geometry, gauge definition, and yield criterion. The NIST structural-steel report, for example, presents high-strain-rate curves for perimeter-column steel specified at 50 ksi yield strength; that designation does not make the value interchangeable with a slowly tested 0.2% proof stress. Yield is a reported definition applied to a measured response. Without both parts, the number is incomplete.
Engineering Curves Versus True Stress–Strain Curves
A tensile-test graph does not show a single, self-evident material property. Its shape depends partly on how force, extension, and specimen dimensions are converted into stress and strain. ASTM E8/E8M-21 covers room-temperature tension testing of metallic materials and the determination of yield strength, yield-point elongation, tensile strength, elongation, and reduction of area. ISO 6892-1:2019 specifies a comparable room-temperature tensile-test method for metallic materials and defines the mechanical properties obtained from it. Neither standard removes the need to state which stress–strain convention was used.
Engineering stress is calculated from the applied force divided by the specimen’s original cross-sectional area:
Engineering strain uses the original gauge length:
These definitions are given in teaching references from Michigan Technological University and Georgia Tech, where Georgia Tech writes engineering stress as and engineering strain as . The specimen may become substantially thinner and longer during the test, but the engineering calculation continues to use and . That choice makes results easy to compare, provided the specimen geometry, gauge length, standard, and test procedure are also reported.
Why engineering stress can fall after necking begins
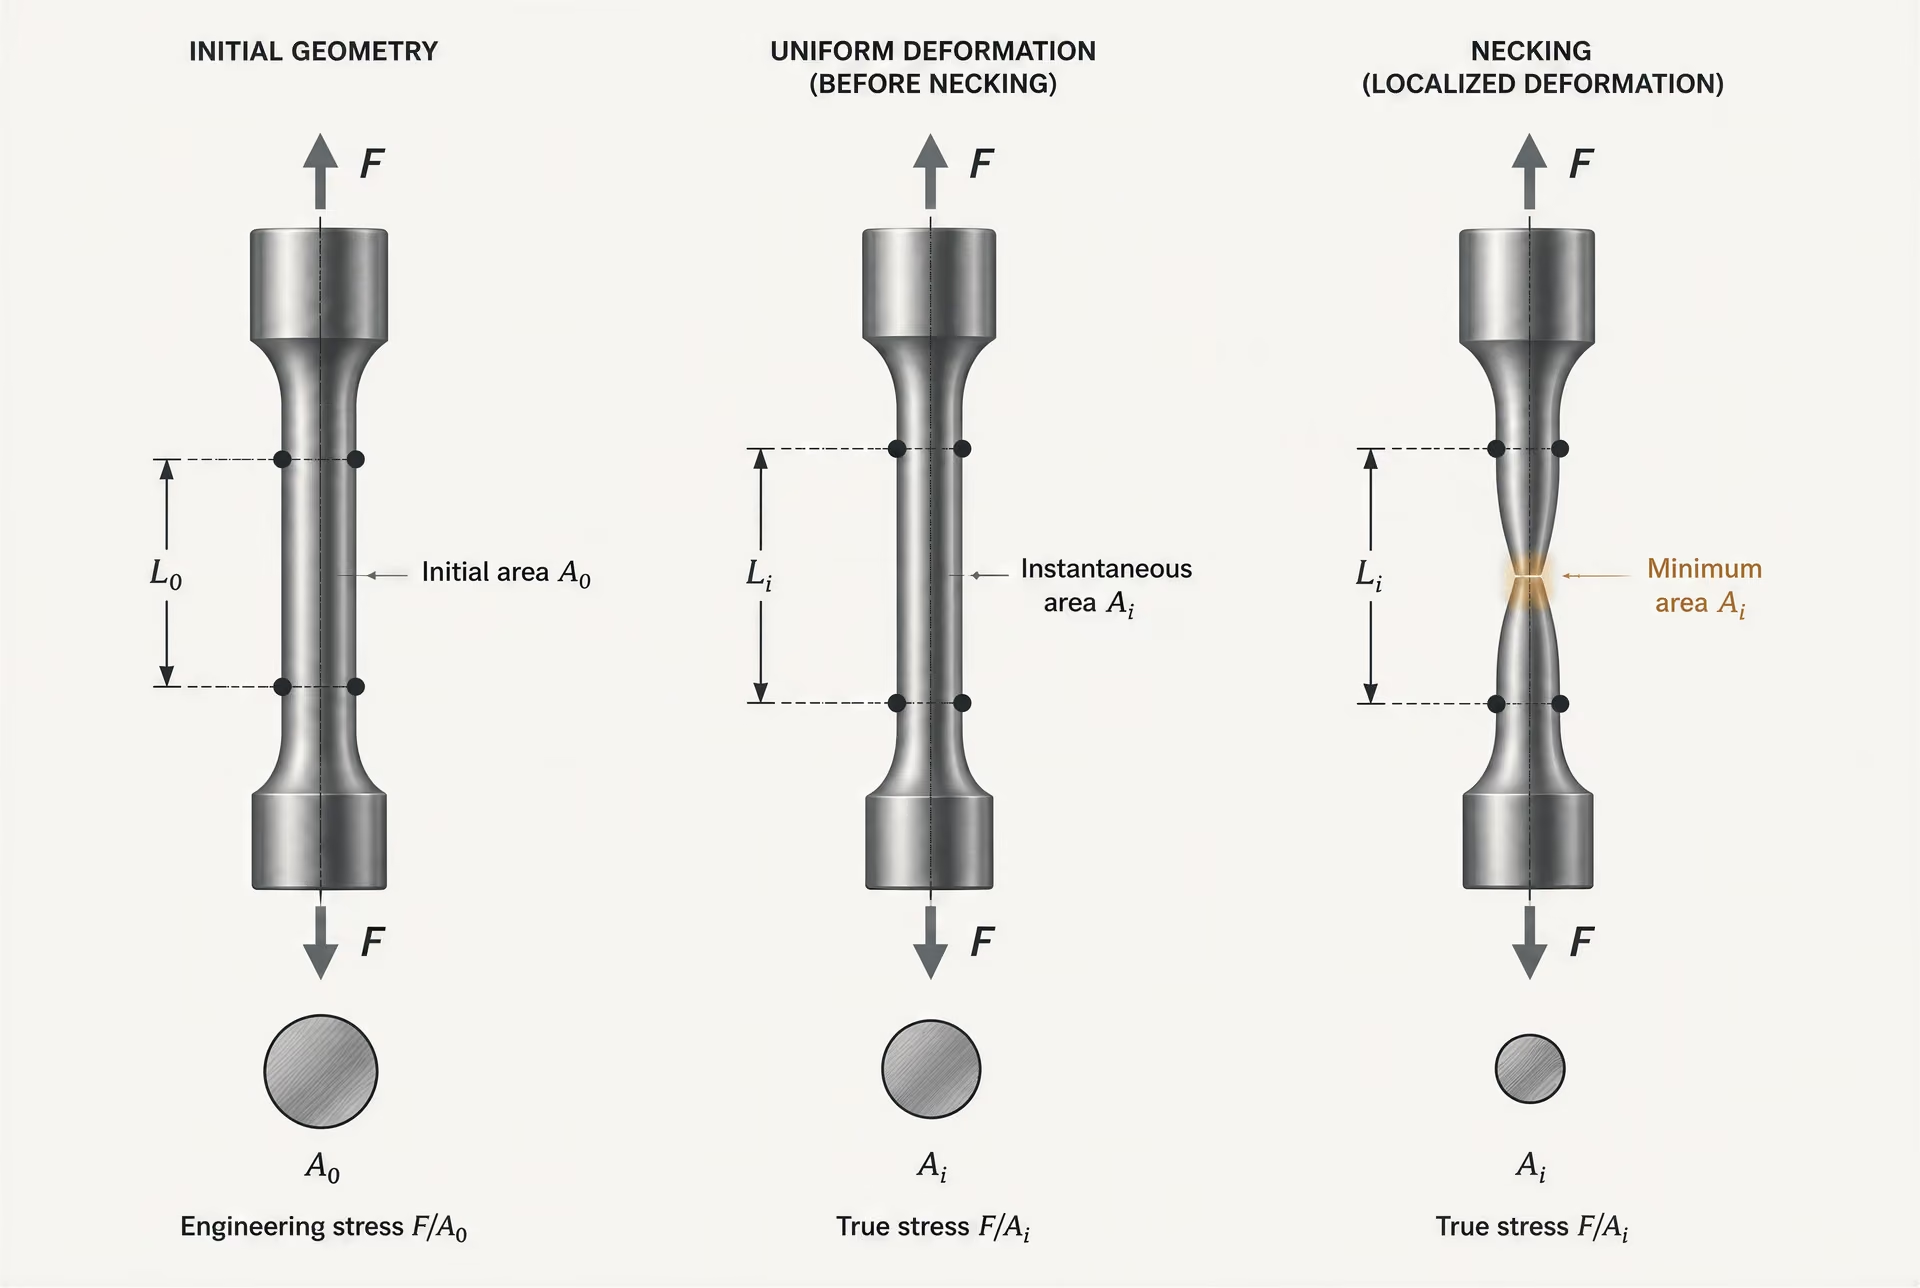
Before necking, deformation is approximately uniform along the gauge length. The entire reduced section carries the load, and plastic work hardening can raise the force required for further extension. On an engineering curve, this produces a rising stress after yielding until the load reaches its maximum. Dividing that maximum load by gives the engineering ultimate tensile strength, often called the tensile strength or ultimate strength.
Necking changes the deformation pattern. A local region begins to contract faster than the rest of the gauge length, creating a smaller cross-sectional area at the neck. After this point, the specimen no longer deforms uniformly. Work hardening still raises the local flow stress, but the shrinking area can reduce the total load faster than hardening increases the stress needed to deform the material. Since the testing machine records load, and engineering stress is simply load divided by the unchanged , the plotted engineering stress falls.
That decline does not mean that deformation has stopped or that the material has suddenly lost all resistance to local plastic flow. It means that the global load carried by the specimen has fallen. Local material inside the neck may still be experiencing increasing stress and strain. The U.S. Department of Energy Fundamentals Handbook identifies the proportional limit, yield strength, ultimate strength, and fracture point on a typical engineering stress–strain curve for structural steel; the descending branch between ultimate strength and fracture is therefore a feature of the chosen representation, not a direct map of uniform material behavior everywhere in the specimen.
The distinction matters when comparing grades or tests. A steel with a higher engineering ultimate tensile strength is not automatically sustaining a higher local stress at every stage of post-necking deformation. The result also depends on the original area, specimen shape, gauge length, loading rate, alignment, and the location at which strain is measured.

Instantaneous area and true stress
| Convention | Stress definition | Strain definition | Main limitation |
|---|---|---|---|
| Engineering | σeng = F/A0 | εeng = (L − L0)/L0 | Uses original area and gauge length |
| True | σtrue = F/Ai | εtrue = ln(L/L0) | Requires current geometry and local deformation data |
| Uniform conversion | σtrue = σeng(1 + εeng) | εtrue = ln(1 + εeng) | Most defensible before or through uniform deformation; unreliable after necking |
True stress uses the area carrying the load at that instant:
where is the instantaneous cross-sectional area. True strain is commonly defined by integrating incremental extension over the current length:
For uniform deformation, engineering and true quantities can be related by:
and
These conversions are useful only while the deformation is sufficiently uniform and the required assumptions are valid. They are not a general correction for every point after necking.[4] Civil Engineering Materials Laboratory: Laboratory 2. Massachusetts Institute of Technology. MIT OpenCourseWare laboratory material, 2004.
MIT’s 2004 Civil Engineering Materials Laboratory reference explicitly distinguishes tensile strength taken from an engineering stress–strain curve from true tensile strength, which accounts for cross-sectional reduction. The difference can be large near fracture because the local neck area may be far smaller than . If a force of 20 kN acts on an original area of , the engineering stress is 200 MPa. If the actual neck area at that instant is , the nominal local true stress based on that area is 400 MPa. The two numbers describe the same force but different area definitions.
Measuring is not trivial. An extensometer may measure average elongation over a gauge length, whereas digital image correlation can resolve local displacement and strain fields. In its work on ASTM A1008 steel, NIST reported tests at average strain rates of , , and , using digital image correlation for displacement and strain measurement. Thus, the apparent curve reflects both material response and the selected measurement method and strain rate.
Uniform deformation, necking, and post-necking interpretation
A conventional conversion from engineering to true stress–strain data is most defensible through uniform deformation and up to the onset of necking. The maximum engineering load marks the usual onset of diffuse necking under tensile loading, although local behavior and material structure can complicate that interpretation. Before this point, one area and one gauge-length measurement can reasonably represent much of the active specimen.
After necking begins, the deformation field becomes strongly localized. The cross-section varies along the neck, the surface develops curvature, and the stress state is no longer purely uniaxial. Material near the neck can experience transverse stresses as well as axial stress. Consequently, multiplying engineering stress by after the maximum load does not recover a reliable local true stress curve.
Post-necking conversion requires appropriate local geometry and deformation data: for example, the changing minimum neck diameter or area, local strain measurements, and, where needed, a correction for neck curvature and the resulting triaxial stress state. A fracture-area measurement can support reduction-of-area calculations, but it does not reconstruct the entire post-necking history. Blind use of uniform-deformation equations can therefore assign physically misleading values to the descending branch.
Reports should state whether curves are engineering or true, how area and strain were measured, and where necking invalidates uniform assumptions. This precision is especially important when comparing ordinary room-temperature results with high-rate data; a NIST structural-steel report, for example, presents high-strain-rate curves for perimeter-column steel with a specified yield strength of 50 ksi. The curve’s label is only the beginning. Its definitions and test conditions determine what the plotted numbers mean.
How Strain Rate Changes the Reported Steel Response
Strain rate is the speed at which a tensile specimen is deformed, normally expressed in reciprocal seconds (s⁻¹). It belongs beside the steel grade, specimen geometry, temperature, and stress–strain convention in any test description. A curve measured at is not automatically interchangeable with one measured at , even when both specimens came from the same heat of steel.
The reason is physical as well as procedural. Plastic deformation requires dislocation movement, and that movement interacts with the time available for obstacles to be overcome, local stress concentrations to develop, and deformation to spread through the gauge length. The reported curve can therefore change in its yield region, its post-yield slope, its ultimate tensile strength, and its apparent ductility. The size of each change must be established for the material and test conditions; it should not be treated as a universal percentage for all steels.
The NIST ASTM A1008 strain-rate series
NIST tested ASTM A1008 steel at average strain rates of 10^-5, 10^-3, and 10^-1 s^-1. Strong evidence
A National Institute of Standards and Technology study makes the comparison concrete using ASTM A1008 steel. The tests were conducted at average strain rates of , , and . These rates span four orders of magnitude, although the test labels contain three discrete conditions rather than a continuous material law. The resulting data show why a curve caption that omits strain rate is incomplete.
The slowest condition represents deformation accumulated over a comparatively long time, while imposes deformation much more rapidly. The change is not merely a horizontal shift in the graph. The onset of yielding and the subsequent flow response can move, and the shape of the curve can change as plastic strain becomes more localized. A reported yield strength from one rate may consequently differ from a value obtained at another rate, even if the same engineering-stress calculation is used.
NIST also used digital image correlation (DIC) to measure displacement and strain. That detail matters. A crosshead displacement signal includes machine compliance and may include deformation outside the intended gauge section; DIC can measure local surface displacement and reveal strain concentration. Two laboratories can therefore report different-looking strain curves because they measured different physical quantities, not because the steel behaved differently.
The usual engineering definitions remain important. Engineering stress is load divided by the specimen’s initial cross-sectional area, , and engineering strain is change in gauge length divided by the initial gauge length, , as described by Georgia Tech and Michigan Technological University. Those definitions do not remove rate dependence. They only establish how the measured load and displacement are converted into plotted coordinates.
Rate sensitivity in yield and flow behavior
Yield is especially sensitive to how a test is run and interpreted. ASTM E8/E8M-21 covers room-temperature tension testing and the determination of yield strength, yield-point elongation, tensile strength, elongation, and reduction of area. A yield value may be taken from a distinct yield point, a yield plateau, or an offset method, depending on the material response and reporting procedure. If strain rate changes the transition from elastic to plastic deformation, the selected yield metric can change even before the later flow curve is considered.
After yielding, strain rate can affect the stress required to sustain plastic flow. In a faster test, the specimen may require higher stress at a given plastic strain than in a slower test. That statement describes the type of response examined in the NIST ASTM A1008 series, not a fixed rule for every steel grade, temperature, or rate interval. The effect may also vary across the curve: a modest change near yield does not predict the change in uniform flow, necking, or fracture strain.
Measurement location adds another source of apparent rate sensitivity. If strain is averaged over a long gauge length, a local neck may be diluted in the reported strain. If DIC tracks a smaller region, localization appears earlier and more strongly. Engineering stress also uses the original area, so it does not show the instantaneous area loss during necking. MIT distinguishes this engineering tensile strength from true tensile strength, which accounts for cross-sectional reduction. Rate, strain definition, and area convention must therefore be read together.
Quasi-static tests versus high-strain-rate data
Most ordinary room-temperature tensile tests are quasi-static. ASTM E8/E8M-21 and ISO 6892-1:2019 define room-temperature methods for metallic materials, but a standard method does not make every result rate-independent. The test speed, strain-rate control method, gauge length, extensometer or DIC system, and selected property definition still affect the reported response.
High-strain-rate structural testing is a different comparison. A NIST structural-steel report presents high-strain-rate tensile stress–strain curves for perimeter-column steel with a specified yield strength of 50 ksi. Those curves address loading conditions far removed from a routine laboratory tensile test. Their purpose is to describe steel response under rapid deformation relevant to structural-event analysis, not to replace a room-temperature qualification curve.
A quasi-static curve should not be overlaid on that high-rate dataset and read as a simple strength ranking. The specimens, loading rates, instrumentation, and possibly curve-processing procedures may differ. Even when both plots use engineering stress and engineering strain, matching those axes does not match the experiment.
The practical rule is strict: compare curves only when strain rates are matched, or state the rates clearly and discuss the difference as part of the result. A tensile value without its rate is a partial measurement.
Measuring Strain: Crosshead Displacement, Extensometry, and Digital Image Correlation
A tensile machine does not measure strain directly unless a strain-measuring device is installed or an optical method is used. Its primary measurement is force, while the crosshead records how far the machine’s moving member travels. That distance can be converted into an apparent strain, but it is not automatically the extension of the steel gauge section.
Gauge-length strain and machine displacement
Engineering strain is defined from a specified gauge length:
where is the initial gauge length and is the current distance between the gauge marks. Engineering stress uses the initial cross-sectional area:
These definitions are given in teaching references from Michigan Technological University and Georgia Tech, where engineering stress is written as and engineering strain as . The specified gauge length matters. A longer gauge length averages deformation over more material and usually produces a different reported elongation than a shorter gauge length, particularly after necking begins.
Crosshead displacement includes more than specimen extension. Some of the movement comes from elastic deformation of the load frame, grips, threaded fixtures, load cell, and other machine components. This system compliance can make the calculated strain too large if the crosshead reading is divided directly by the specimen gauge length. Grip seating and slip add another source of apparent extension. Even small movement at the jaws can noticeably affect a short specimen or the initial low-strain part of a curve.
Alignment also changes the result. Bending caused by eccentric loading can make one side of a specimen extend more than the other, while friction or uneven gripping can redistribute stress near the shoulders. A machine may therefore produce a smooth force–displacement record even when the gauge section is not deforming uniformly. Extensometers reduce these problems by measuring the separation of two points on the specimen itself. Their gauge length, attachment method, accuracy class, and removal point must still be controlled.
ASTM E8/E8M-21 covers room-temperature tension testing of metallic materials and addresses yield strength, yield-point elongation, tensile strength, elongation, and reduction of area. ISO 6892-1:2019 specifies a room-temperature tensile method for metallic materials and defines the properties obtainable from it. Neither standard turns crosshead travel into a universal strain value: the reported property remains tied to the specimen geometry, gauge-length definition, test setup, and measurement procedure.
The distinction becomes critical after the ultimate tensile strength. Engineering stress continues to use , even though the specimen’s section has contracted. MIT’s 2004 materials laboratory notes distinguish this engineering tensile strength from true tensile strength, which accounts for the changing cross-sectional area. Crosshead displacement also becomes a poor description of local deformation once a neck forms, because extension concentrates in a small region rather than spreading uniformly across the gauge length.

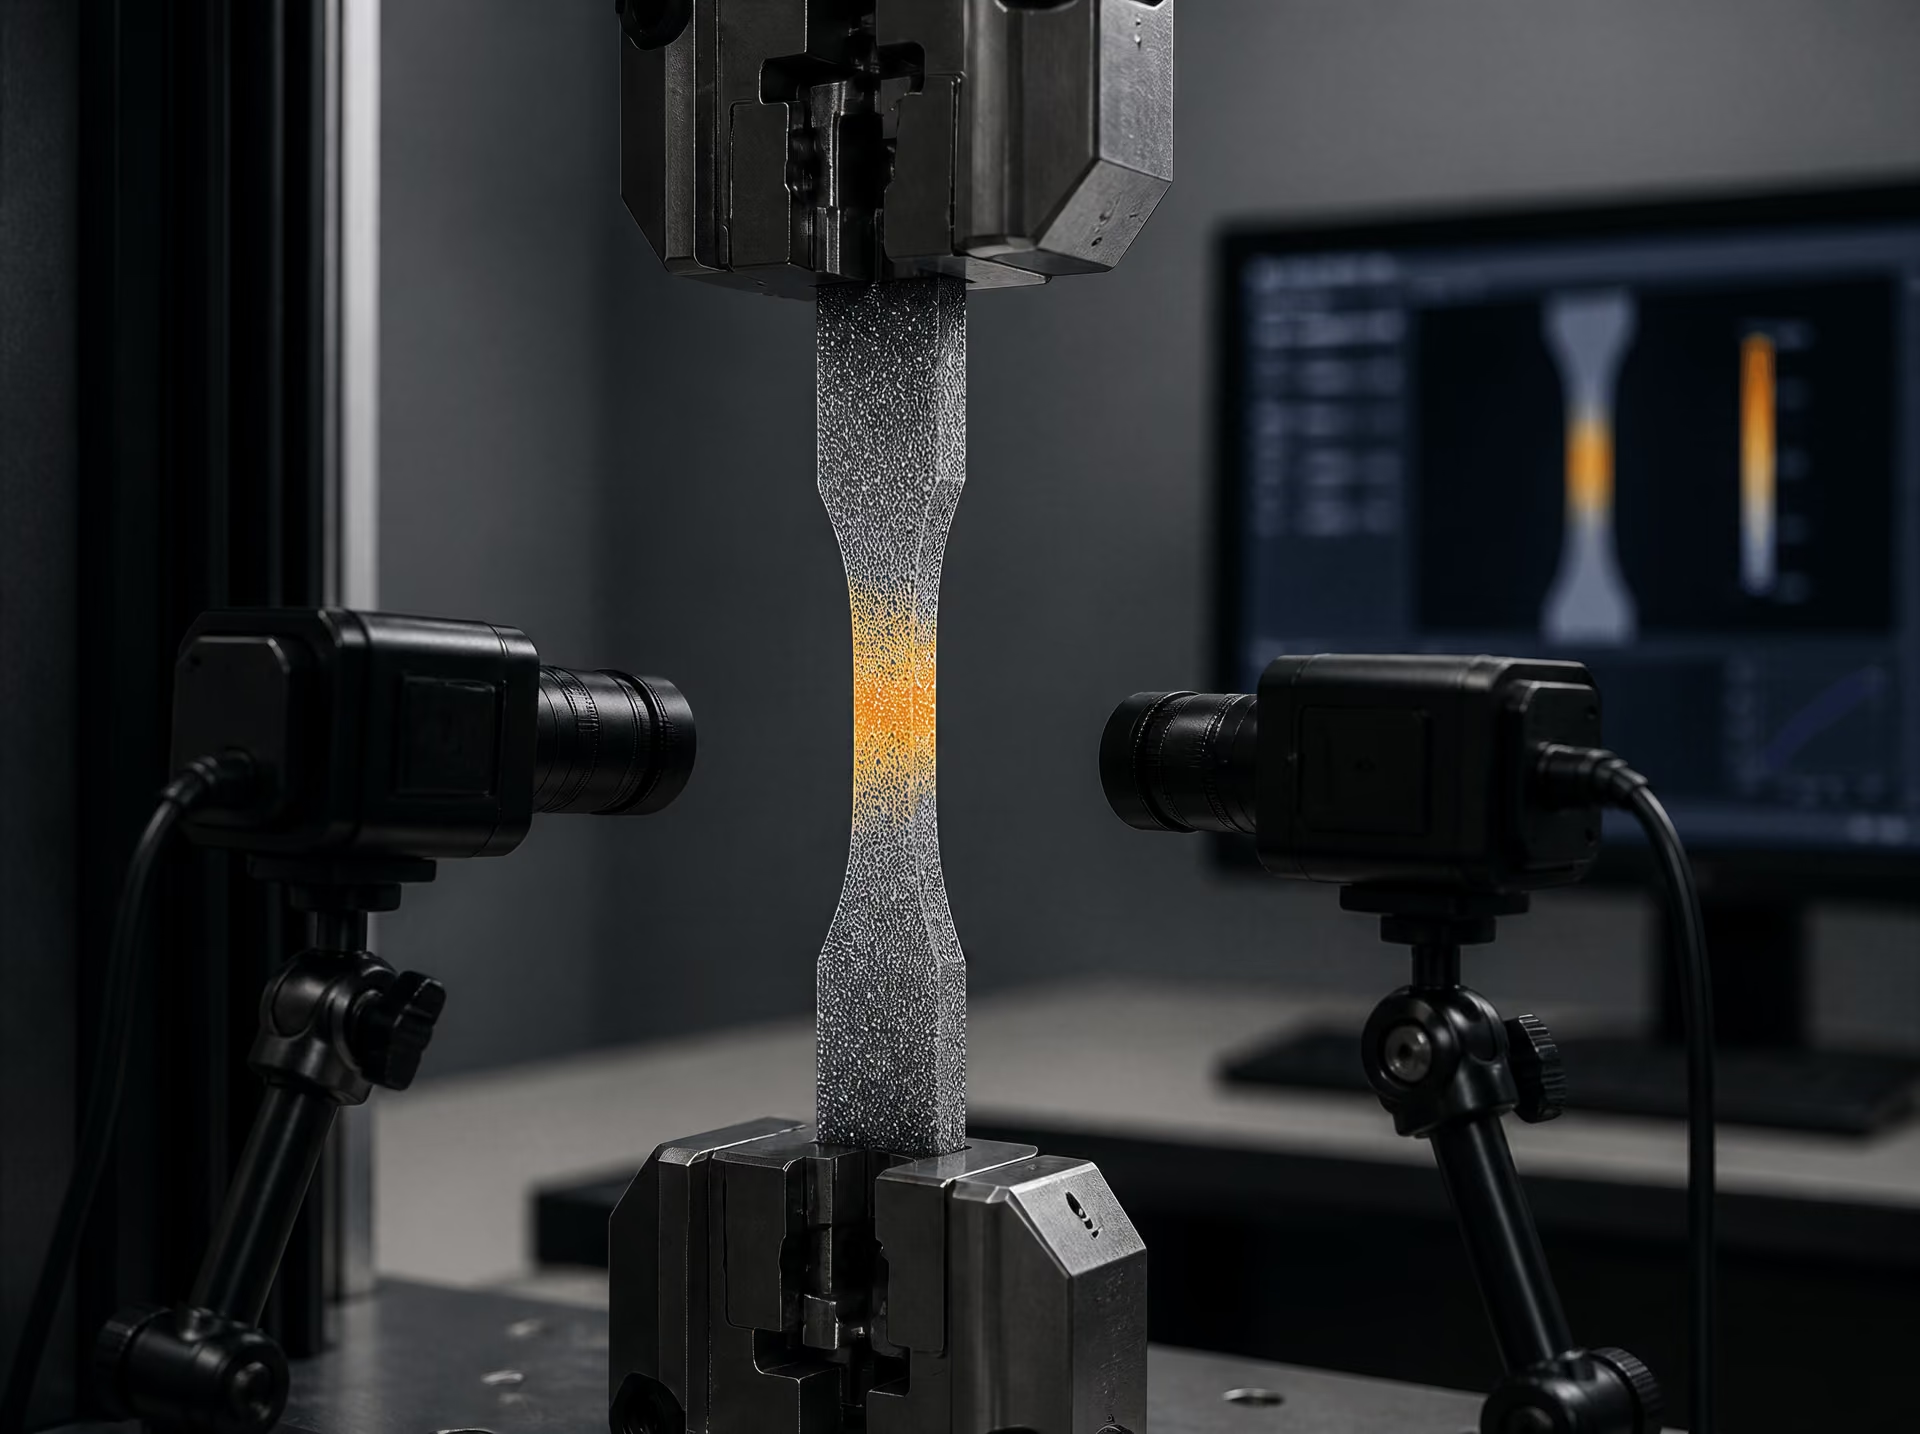
Digital image correlation in the NIST study
In its investigation of ASTM A1008 steel, the National Institute of Standards and Technology used digital image correlation (DIC) for displacement and strain measurement. DIC tracks the movement of a surface pattern recorded in successive images. Software compares small image regions, often called subsets, and calculates their displacement between frames; spatial derivatives of those displacements provide strain fields.
This method differs from a single extensometer reading. An extensometer returns the change in distance between defined points, whereas DIC can calculate displacement at many points across the visible specimen surface. The NIST work examined average strain rates of , , and . Because both strain rate and measurement technique affect the recorded response, the resulting curves should not be treated as a material ranking independent of test conditions.
DIC does not replace the tensile machine’s force measurement. Force still comes from the load cell, and stress calculation still requires an area definition. Instead, DIC supplies a spatially resolved deformation measurement that can be paired with force to identify where the specimen is extending, yielding, or concentrating strain. It is a method used in particular investigations, including the NIST ASTM A1008 study, not a requirement that every ASTM tensile test use optical imaging.
Local strain fields near necking and fracture
Before yielding, strain may be nearly uniform along a well-aligned gauge section. Plastic deformation can remain broadly distributed for a time, especially in a specimen with a stable geometry and suitable surface condition. Later, deformation becomes nonuniform. A neck develops, the local cross-sectional area decreases, and the local strain rises faster than the average gauge-length strain.
A conventional extensometer reports an average over its gauge length. That average can conceal a narrow band in which most of the plastic extension occurs. DIC exposes the change directly: maps of axial strain show the initiation of localization, its movement or growth, and the steep concentration around the neck. Near fracture, the field can vary sharply over distances much smaller than the original gauge length. The final elongation measured after fitting the broken halves together is therefore not interchangeable with the local strain at the fracture surface.
This distinction also explains why a curve can fall after its engineering ultimate strength while the material near the neck continues to harden. The load decreases because the reduction in area outpaces the increase in local flow stress. A true-stress interpretation requires the changing area, while a full-field optical measurement helps show where that area reduction and strain concentration occur. The U.S. Department of Energy’s typical structural-steel curve labels proportional limit, yield strength, ultimate strength, and fracture point, but those landmarks acquire meaning only when the underlying displacement and area measurements are defined.
Specimen Geometry, Standards, and Sources of Test Scatter
A tensile curve is partly a record of the specimen and test setup, not only of the steel grade. Two laboratories can test nominally identical 1018 carbon steel and report different yield, ultimate, or rupture stresses if they use different cross-sectional measurements, gauge lengths, strain rates, or methods for detecting deformation. The Syracuse University carbon-steel 1018 experiment demonstrates this point by using ASTM flat tensile specimens to determine yield stress, ultimate stress, and rupture stress. Those values are meaningful only with the specimen dimensions and calculation conventions beside them.
ASTM E8/E8M-21 covers room-temperature tension testing of metallic materials and the determination of yield strength, yield-point elongation, tensile strength, elongation, and reduction of area. ISO 6892-1:2019 specifies a room-temperature tensile-test method and defines the mechanical properties obtainable from it. The standards are related, but a result identified only as “ASTM tensile strength” or “ISO elongation” is incomplete unless the specimen type, dimensions, test rate, and reporting method are also given.
ASTM flat specimens and gauge dimensions
An ASTM flat specimen has a wider body, a reduced gauge section, and enlarged ends for gripping. The reduced section is intended to contain the fracture, while the transition radii limit stress concentration between the gauge length and the shoulders. Standard and subsize configurations have different widths, thicknesses, gauge lengths, and end dimensions. A commonly encountered ASTM flat geometry uses a 50 mm gauge length and a 12.5 mm gauge width, but that dimension must not be assumed for every specimen. The Syracuse experiment’s stated ASTM flat geometry should be retained with its results rather than replaced by a generic “dog-bone specimen” description.
Gauge length is not the same as the total length of the metal strip. It is the marked or extensometer-defined initial length over which engineering strain is calculated. Engineering strain is
where is the initial gauge length. A longer gauge length generally spreads the measured deformation over more material and can produce a lower reported percentage elongation when the same necked region dominates the final deformation. Consequently, “18% elongation” has no clear meaning without the gauge-length basis.
The specimen’s thickness and width also affect the result. A small error in either dimension changes the calculated initial area and therefore changes every engineering stress value. Machining marks, burrs, edge notches, overheating, residual cold work, and corrosion can initiate fracture prematurely. A specimen cut transverse to the rolling direction may not match one cut longitudinally because rolling changes texture and the distribution of inclusions and defects.
Area measurement, alignment, and gripping
Engineering stress uses the original cross-sectional area:
This is the convention described by Michigan Technological University and Georgia Tech, where is measured before loading. The initial area should be determined at the gauge section, using calibrated instruments and recorded thickness and width values rather than nominal drawing dimensions. If the specimen is tapered, warped, or locally undersize, measuring at only one position can conceal the controlling section. Multiple measurements along the gauge length provide a check.
Alignment is equally important. The specimen’s centerline should coincide with the loading axis. Angular misalignment or unequal gripping introduces bending, so one edge carries more stress than the other. The resulting curve may show premature yielding or fracture even though the average machine load appears reasonable. Grips must hold the enlarged ends without slipping, crushing, or marking the reduced section. Serrated grips can damage a thin flat specimen; insufficient clamping can produce displacement that the extensometer interprets as strain.
The test record should identify the extensometer or displacement method, its gauge length, and its removal point if applicable. NIST testing of ASTM A1008 steel used digital image correlation and examined average strain rates of , , and . The change in rate and the change in measurement method are part of the reported experiment, not laboratory background details. A 50 ksi specified-yield structural steel tested at high strain rate, as documented in a NIST structural-steel report, cannot be compared directly with a slow laboratory curve without stating that difference.
Elongation and reduction of area after fracture
Elongation is commonly calculated after fracture by fitting the broken pieces together and measuring the final distance between gauge marks:
This is total elongation over the specified gauge length. It includes uniform extension before necking and localized extension within the neck. The local region near the fracture may extend dramatically, while portions of the gauge length extend very little. A short gauge length therefore captures more of the necked deformation and can report a higher percentage than a longer gauge length on the same broken specimen.
Reduction of area measures the neck’s cross-sectional contraction:
where is the minimum area at the fracture. It is not another name for elongation. A ductile 1018 specimen can show substantial reduction of area even when its measured gauge-length elongation differs from another report.
The Syracuse experiment’s rupture stress should likewise be identified by its calculation basis, usually fracture load divided by the original area if it is an engineering value. A true fracture stress instead uses the reduced area at the neck. MIT distinguishes tensile strength from an engineering curve from true tensile strength, which accounts for cross-sectional reduction. Every test record should therefore state gauge length, , final area where used, fracture location, strain measurement method, and whether stress and strain are engineering or true quantities.
How to Report and Compare Steel Tensile-Test Results
A tensile curve is only as comparable as the information attached to it. A plot showing stress against strain can conceal differences in specimen shape, gauge length, testing speed, extensometer placement, and stress convention. Those differences may change the apparent yield point, the height of the tensile-strength peak, and the reported elongation without any change in the steel itself.
The minimum information accompanying a curve
Every curve should identify the steel designation exactly as supplied or specified, such as ASTM A1008, ASTM A36, SAE J403 1018, or EN 1.4301. The product form also matters: sheet, plate, bar, wire, tube, or a machined specimen taken from a welded product will not necessarily show the same response. Record heat or lot identification where available, together with thickness or diameter, surface condition, and any heat treatment.
State the specimen orientation relative to rolling, forging, extrusion, or welding direction. “Longitudinal” and “transverse” are not interchangeable labels. Include the specimen geometry: flat or round section, width, thickness or diameter, reduced-section dimensions, shoulder and radius details, and the initial gauge length . The elongation value is incomplete without its gauge length. A reported 25% elongation on a 50 mm gauge length cannot be compared directly with 25% measured over a different length.
Name the applicable test standard and edition. ASTM E8/E8M-21 covers room-temperature tension testing of metallic materials and the determination of yield strength, yield-point elongation, tensile strength, elongation, and reduction of area. ISO 6892-1:2019 specifies a room-temperature tensile-test method for metallic materials and defines mechanical properties obtainable from that test. These standards address similar measurements, but their specimen requirements, control methods, calculation rules, and reporting conventions must still be checked rather than treated as identical.
Temperature belongs beside the curve, not in a separate footnote. Report the test temperature and whether it was controlled or merely measured. Give the strain rate, crosshead speed, stress rate, or control mode, including the point at which the machine changed from force control to strain control. NIST testing of ASTM A1008 steel examined average strain rates of , , and , while also using digital image correlation for displacement and strain. Rate and measurement method were experimental variables.
Describe how strain was obtained: extensometer, crosshead displacement, digital image correlation, or a calculated value. Crosshead travel includes machine and grip deformation; it is not automatically gauge strain. State the extensometer gauge length, resolution, removal point, and whether local necking was captured.
Label the axes as engineering or true quantities. Engineering stress is , where is load and is the initial area; engineering strain is , as described by Michigan Technological University and Georgia Tech. True stress uses the instantaneous area, and true strain accumulates incremental length changes. MIT distinguishes the tensile strength taken from an engineering curve from true tensile strength, which accounts for cross-sectional reduction.
The report should define the yield or proof-stress convention: upper or lower yield strength, 0.2% offset proof stress, another offset, proportional limit, or a value obtained by a specified algorithm. Give tensile strength, uniform elongation if measured, total elongation and its gauge length, reduction of area, and fracture observations. Record neck location, shear lips, cup-and-cone appearance, splitting, delamination, and whether fracture occurred inside the gauge section.
Comparing grades without mixing definitions
Do not rank grades by placing curves from different procedures on one graph and reading the highest line as the strongest steel. A curve from a round bar and one from sheet may reflect different orientations and constraint conditions. A short gauge length can produce a different total elongation from a long one. A high strain rate can raise the measured flow stress; the NIST ASTM A1008 results at , , and demonstrate why rate must accompany the result. NIST high-rate curves for perimeter-column steel with a specified yield strength of 50 ksi answer a different engineering question from a room-temperature, quasi-static test.
Area conventions can reverse apparent conclusions after necking. Engineering stress continues to divide load by , so it normally falls after the maximum load. True stress uses the shrinking section and can continue rising through part of necking. Calling the engineering peak “true tensile strength” confuses two different quantities.
Standards also define how yield, proof stress, elongation, and reduction of area are measured. The U.S. Department of Energy identifies proportional limit, yield strength, ultimate strength, and fracture point on a typical engineering curve, but those named points do not specify one universal calculation procedure. A grade comparison is defensible only when the specimen form, direction, temperature, rate, definitions, and standard are aligned, or when the differences are explicitly corrected and qualified.
A disciplined interpretation workflow
Start with the raw force-displacement file, not the published image. Check sampling rate, zero loads, grip seating, extensometer removal, machine compliance, and any dropped or smoothed data. Confirm that force units and displacement units have not been converted twice.
Next verify dimensional inputs. Re-measure or inspect the recorded width, thickness or diameter, initial area, gauge length, and final minimum area. Small area errors affect every engineering-stress value; gauge-length errors affect strain and elongation.
Then reproduce the curve from the raw data using the stated engineering or true definitions. Mark the proportional limit, yield or proof stress, maximum load, uniform elongation, fracture point, and reduction of area using the declared method. Compare those points with the report, not merely with the plotted line.
Finally inspect uncertainty and failure location. Include repeat-test scatter, dimensional uncertainty, extensometer accuracy, temperature variation, and rate variation. Reject a metallurgical explanation until testing artefacts, specimen orientation, and neck or fracture observations have been checked. Only then should differences be assigned to composition, processing, microstructure, or work hardening.
References
- [1] Standard Specification for Tension Testing of Metallic Materials. ASTM International standard, 2021. https://store.astm.org/e0008_e0008m-21.html
- [2] Metallic materials — Tensile testing — Part 1: Method of test at room temperature. ISO standard, 2019. https://www.iso.org/standard/78322.html
- [3] Properties of Metals. DOE Fundamentals Handbook reference. https://engineeringlibrary.org/reference/properties-of-metals-doe-handbook
- [4] Civil Engineering Materials Laboratory: Laboratory 2. MIT OpenCourseWare laboratory material, 2004. https://ocw.mit.edu/courses/1-103-civil-engineering-materials-laboratory-spring-2004/e9253657127a6630f10b61b392b1d2d9_lab_2.pdf