

What Quenching Media and Cooling Severity Mean
Quenching medium versus cooling severity
A quenching medium is the fluid, gas, or other heat-transfer medium that removes heat from austenitized steel. Common media include water, aqueous brine, aqueous polymer solutions, quench oils, molten salts, and forced gas. The medium is identified by its composition or principal physical form.
Cooling severity is different. It describes how intensely and how quickly that medium extracts heat from the workpiece over time. Severity therefore includes both the magnitude of heat removal and its changing character during the quench. A medium can be chemically identified as “water,” yet its cooling severity changes when its temperature, agitation, dissolved salts, contamination, or contact with the steel changes.
Key cooling terms
- Cooling rate
- Temperature change of the probe or steel per unit time, commonly expressed in °C/s.
- Heat flux
- Rate of heat transfer per unit surface area, usually expressed in W/m².
- Cooling curve
- Probe temperature, or a related calculated quantity, plotted against time or temperature.
- Cooling severity
- The intensity and changing character of heat extraction over the quench.
Several measurements describe different parts of this process. Cooling rate is the temperature change of the probe or steel per unit time, commonly expressed in °C/s. It may be reported at a specified temperature, such as 600 °C or 300 °C, because the rate is not constant throughout the quench. Heat flux is the rate of heat transfer per unit surface area, usually expressed in W/m². It describes the thermal load crossing the steel–quenchant interface rather than simply the temperature fall of the steel. A cooling curve records probe temperature, or a related calculated quantity, against time and sometimes against temperature. It reveals when cooling is slow or fast and helps identify changes in heat-transfer conditions.
These terms should not be substituted for one another. A high cooling rate at one temperature does not prove that the quenchant has the highest heat flux throughout the quench. Likewise, two cooling curves may have similar maximum cooling rates but different timing, which can produce different transformations in steel.

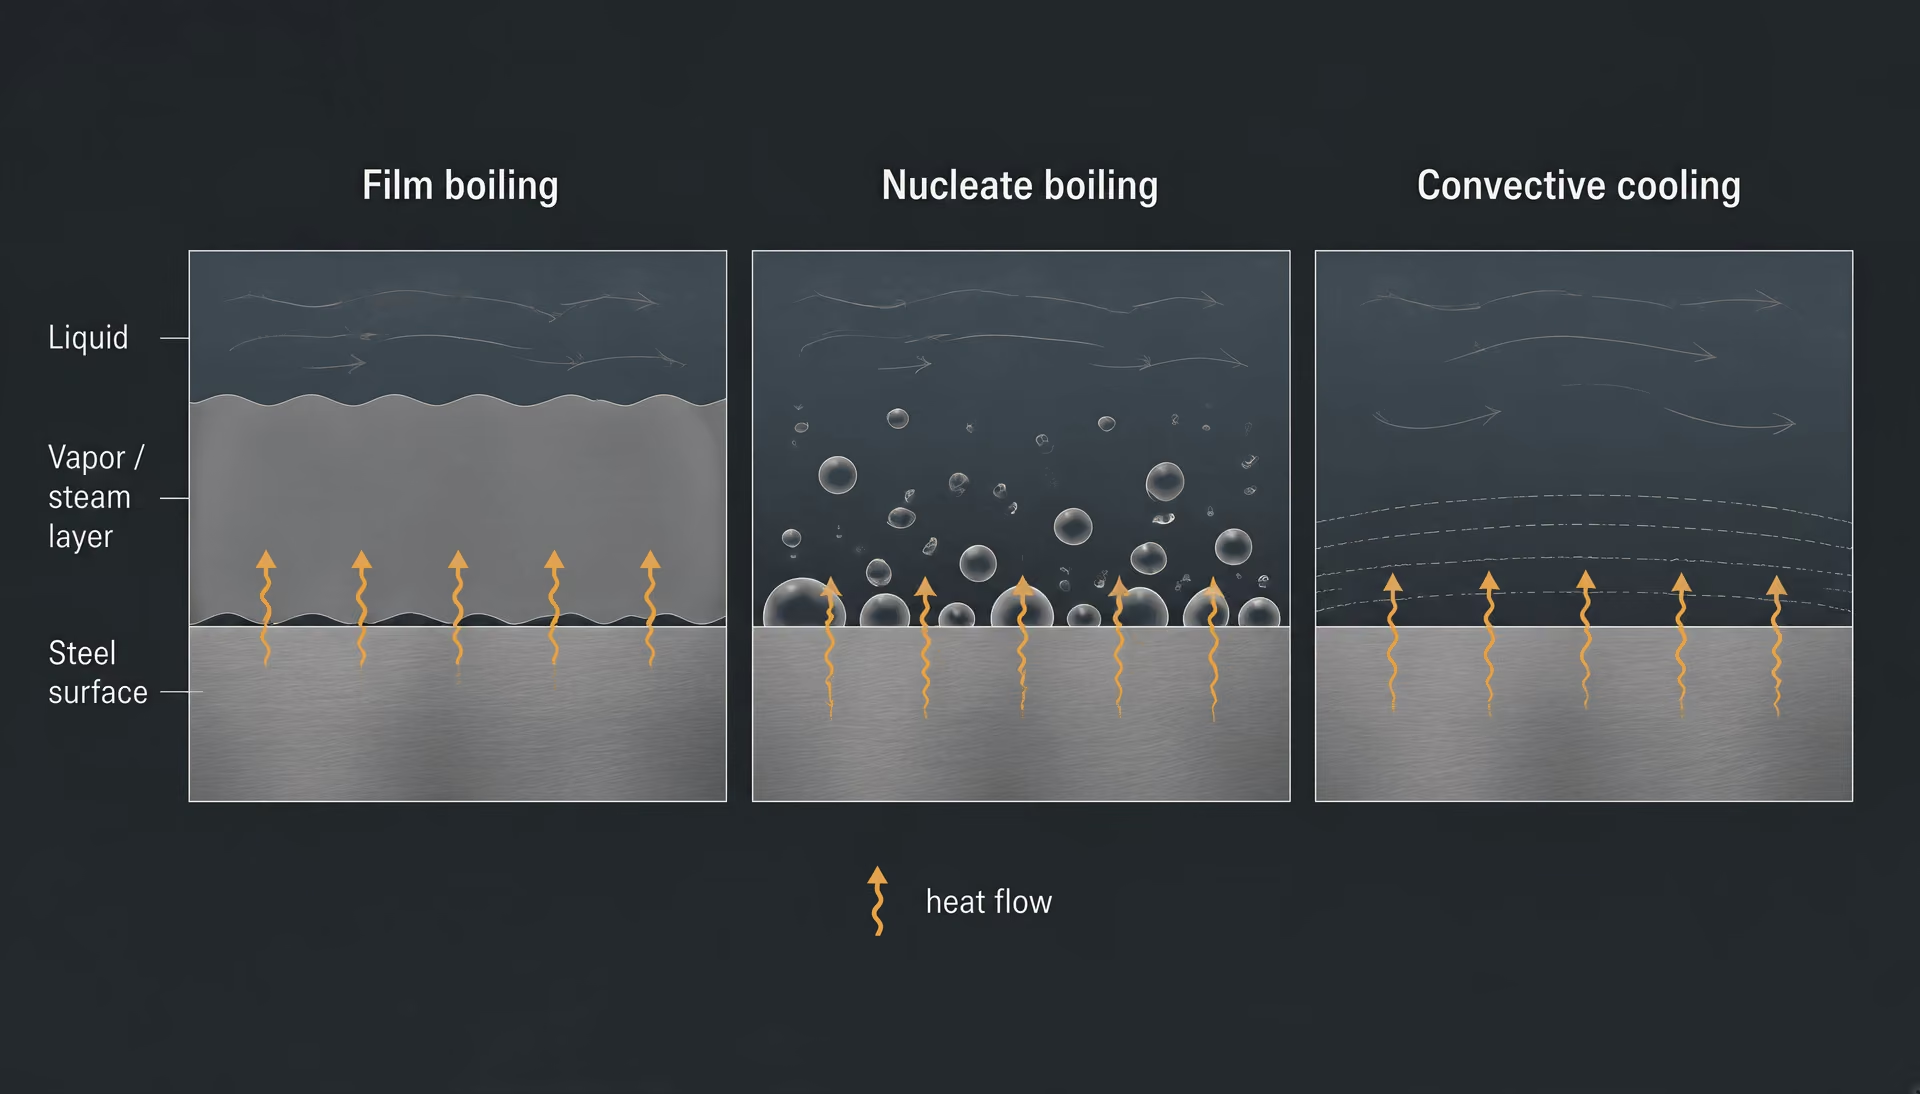
The first stage after immersion is often film boiling. A continuous vapor blanket separates the hot steel from the liquid, limiting direct contact and producing relatively slow heat transfer. As the surface cools, the vapor film collapses and nucleate boiling begins. Liquid contacts the surface intermittently through rapidly forming and departing vapor bubbles, and heat transfer becomes much faster. At lower surface temperatures, boiling ends and convective cooling controls the remaining heat removal. ASTM International’s review Heat Transfer during Quenching and Assessment of Quench Severity—A Review emphasizes that cooling rate changes through these distinct stages. The cooling curve is therefore a record of changing heat-transfer mechanisms, not a single property of the liquid.

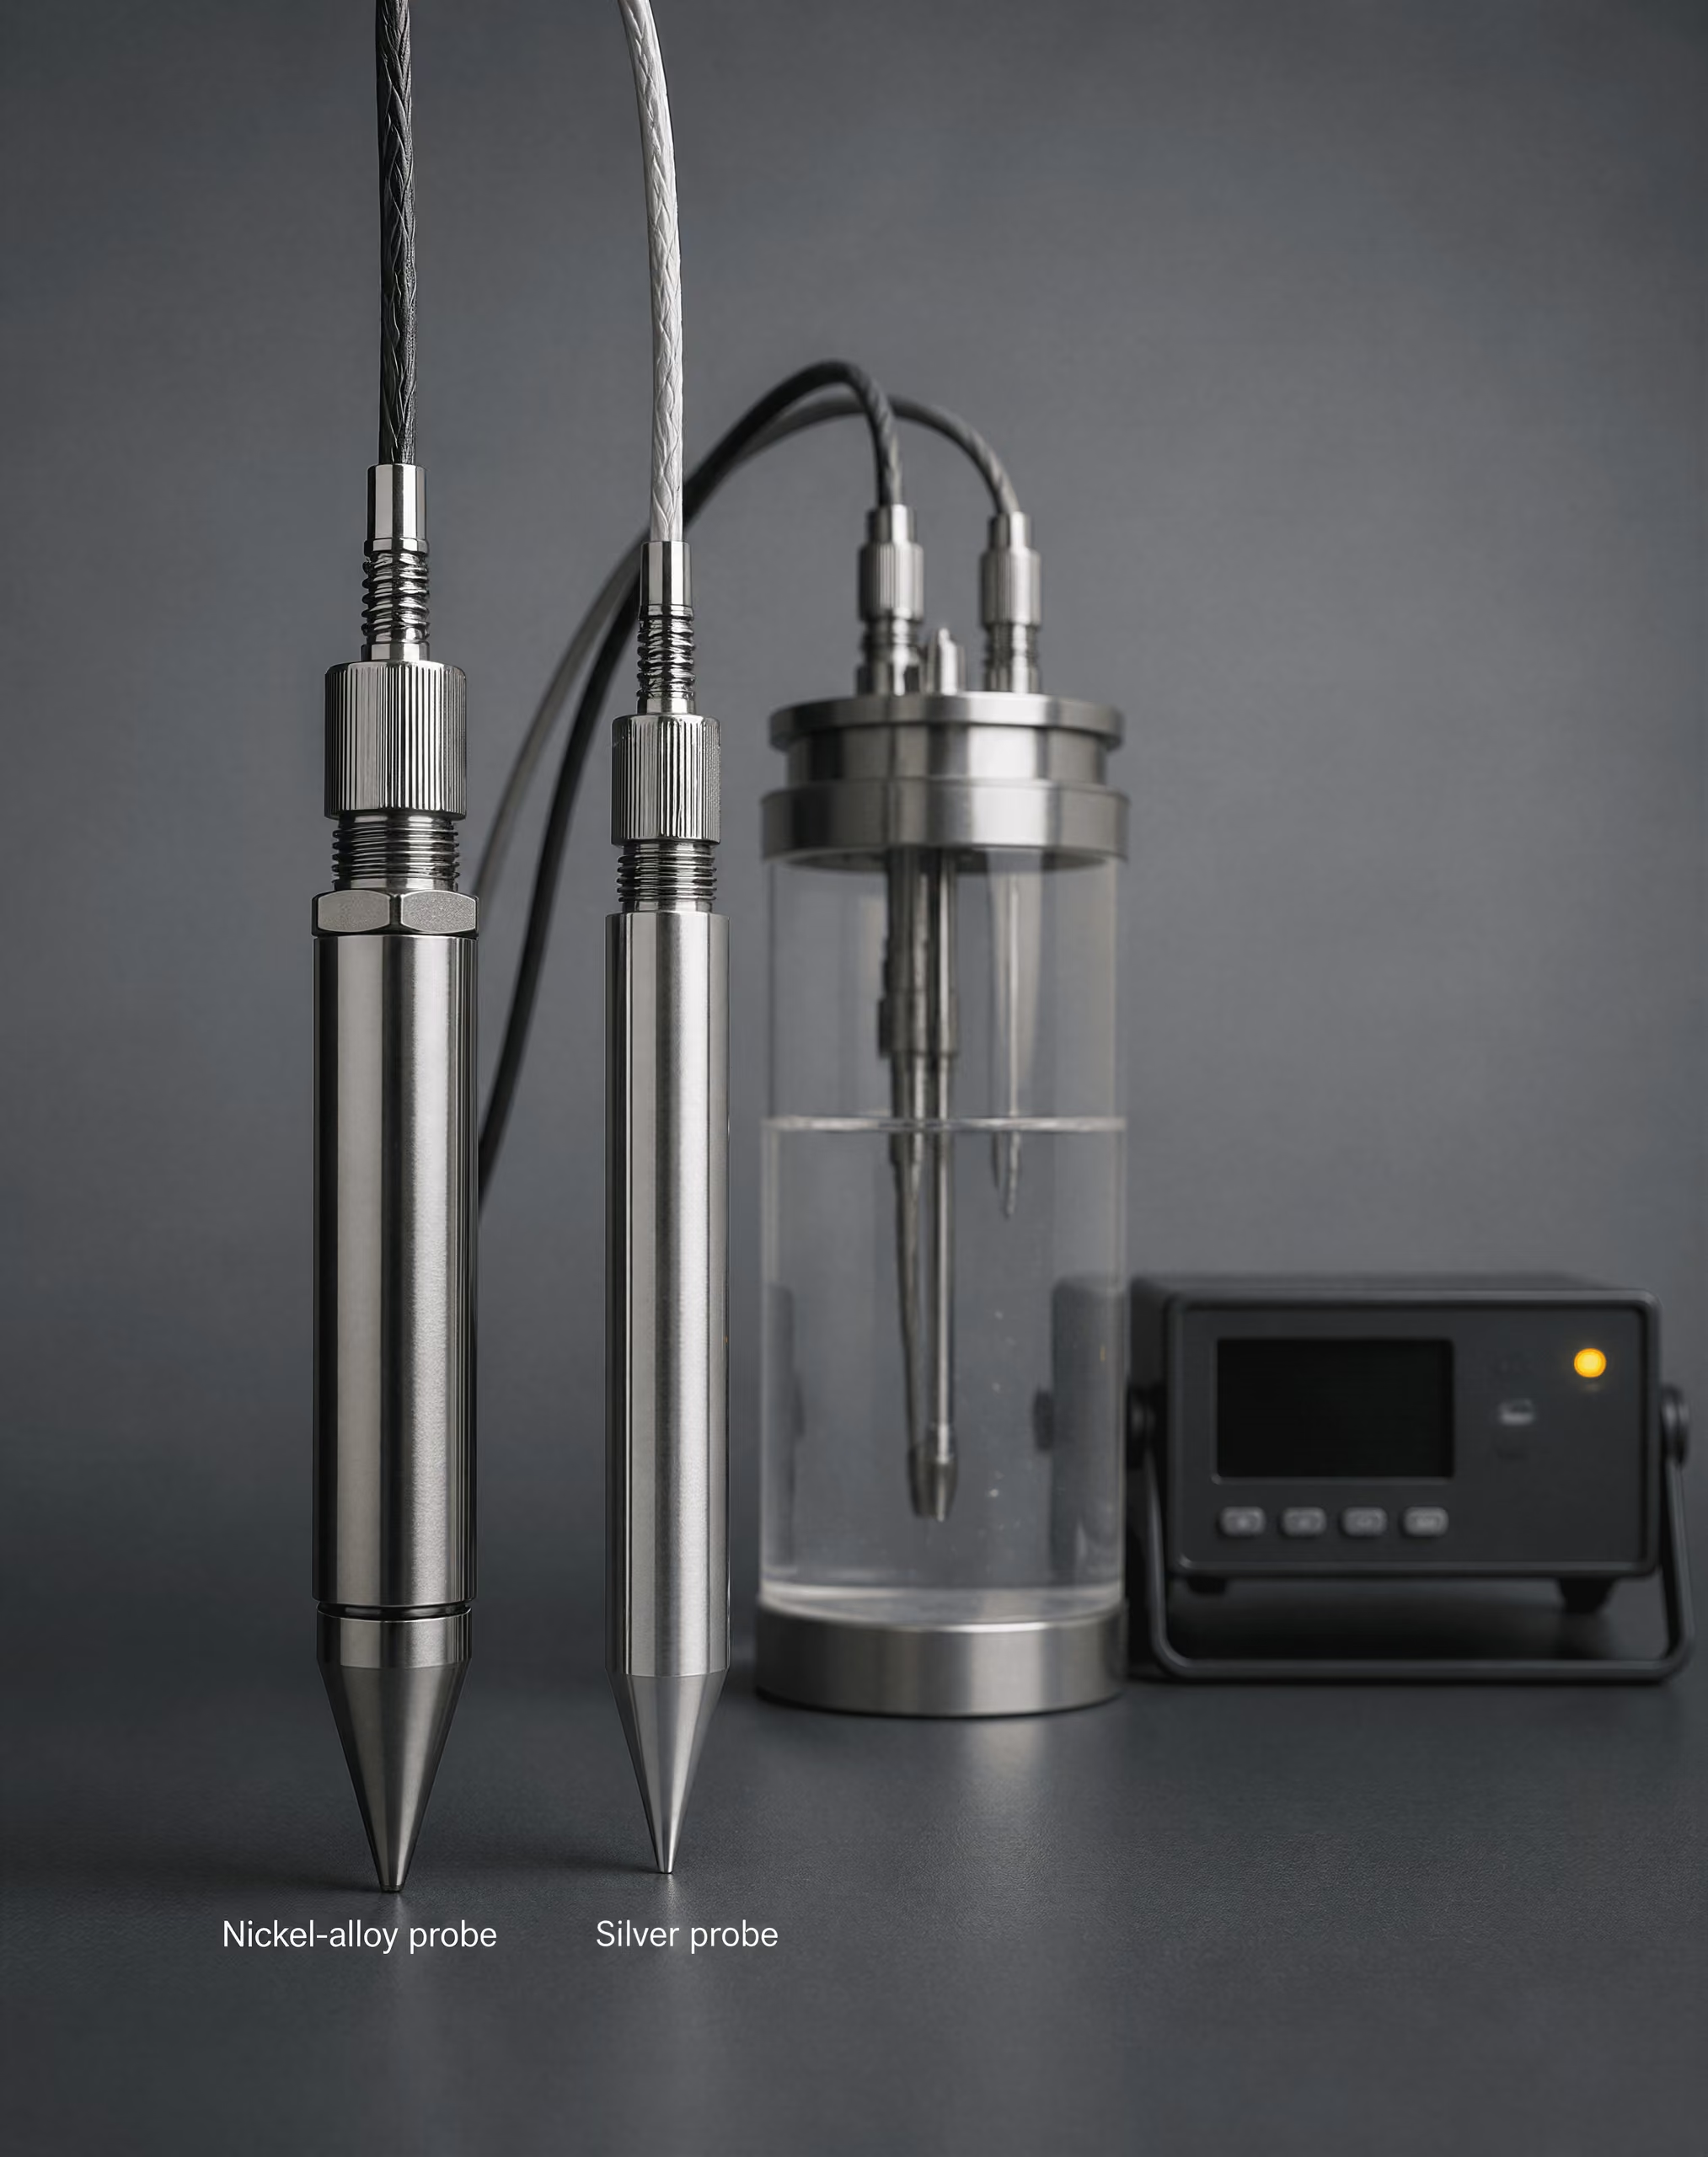
| Method | Probe | Quenchant or condition | Agitation |
|---|---|---|---|
| ISO 9950:1995 | Nickel-alloy probe | Industrial quenching oils | Standardized non-agitated |
| ASTM D6200 | Specified by the method | Quench oils | Method-defined |
| ASTM D6482 | Specified by the method | Aqueous polymer quenchants | Agitated |
| ASTM D6549 | Specified by the method | Quenchants | Agitated |
| ASTM D8562-24 | Silver probe | Aqueous polymer quenchants for steel alloys | Non-agitated |
Probe methods make this distinction practical. ISO 9950:1995 specifies a nickel-alloy probe test for determining the cooling characteristics of industrial quenching oils under standardized, non-agitated conditions. ASTM D8562-24 specifies a non-agitated silver-probe cooling-rate test for aqueous polymer quenchants used with steel alloys. The probe material, dimensions, surface finish, recording system, bath temperature, and agitation condition all form part of the result. A value obtained by one method cannot automatically be treated as equivalent to a value obtained by another.
ASTM Subcommittee D02.L0.06 identifies ASTM D6200 for quench oils, ASTM D6482 for agitated aqueous polymer quenchants, ASTM D6549 for agitated quenchants, and ASTM D8562 for aqueous polymer quenchants tested with a silver probe. These standards support comparison under stated conditions. They do not turn “oil,” “water,” or “polymer” into a universal severity number.
Why severity is a process variable
Cooling severity depends on the complete quenching process rather than on quenchant composition alone. Strong evidence
Cooling severity belongs to the complete quenching process, not to the quenchant label alone. Bath temperature is one immediate variable. Heating water or oil changes viscosity, vapor formation, density, and convection; it can also alter the temperature range over which film boiling persists. Polymer solutions are especially sensitive to concentration and temperature because the polymer affects the vapor blanket and the liquid’s resistance to flow.

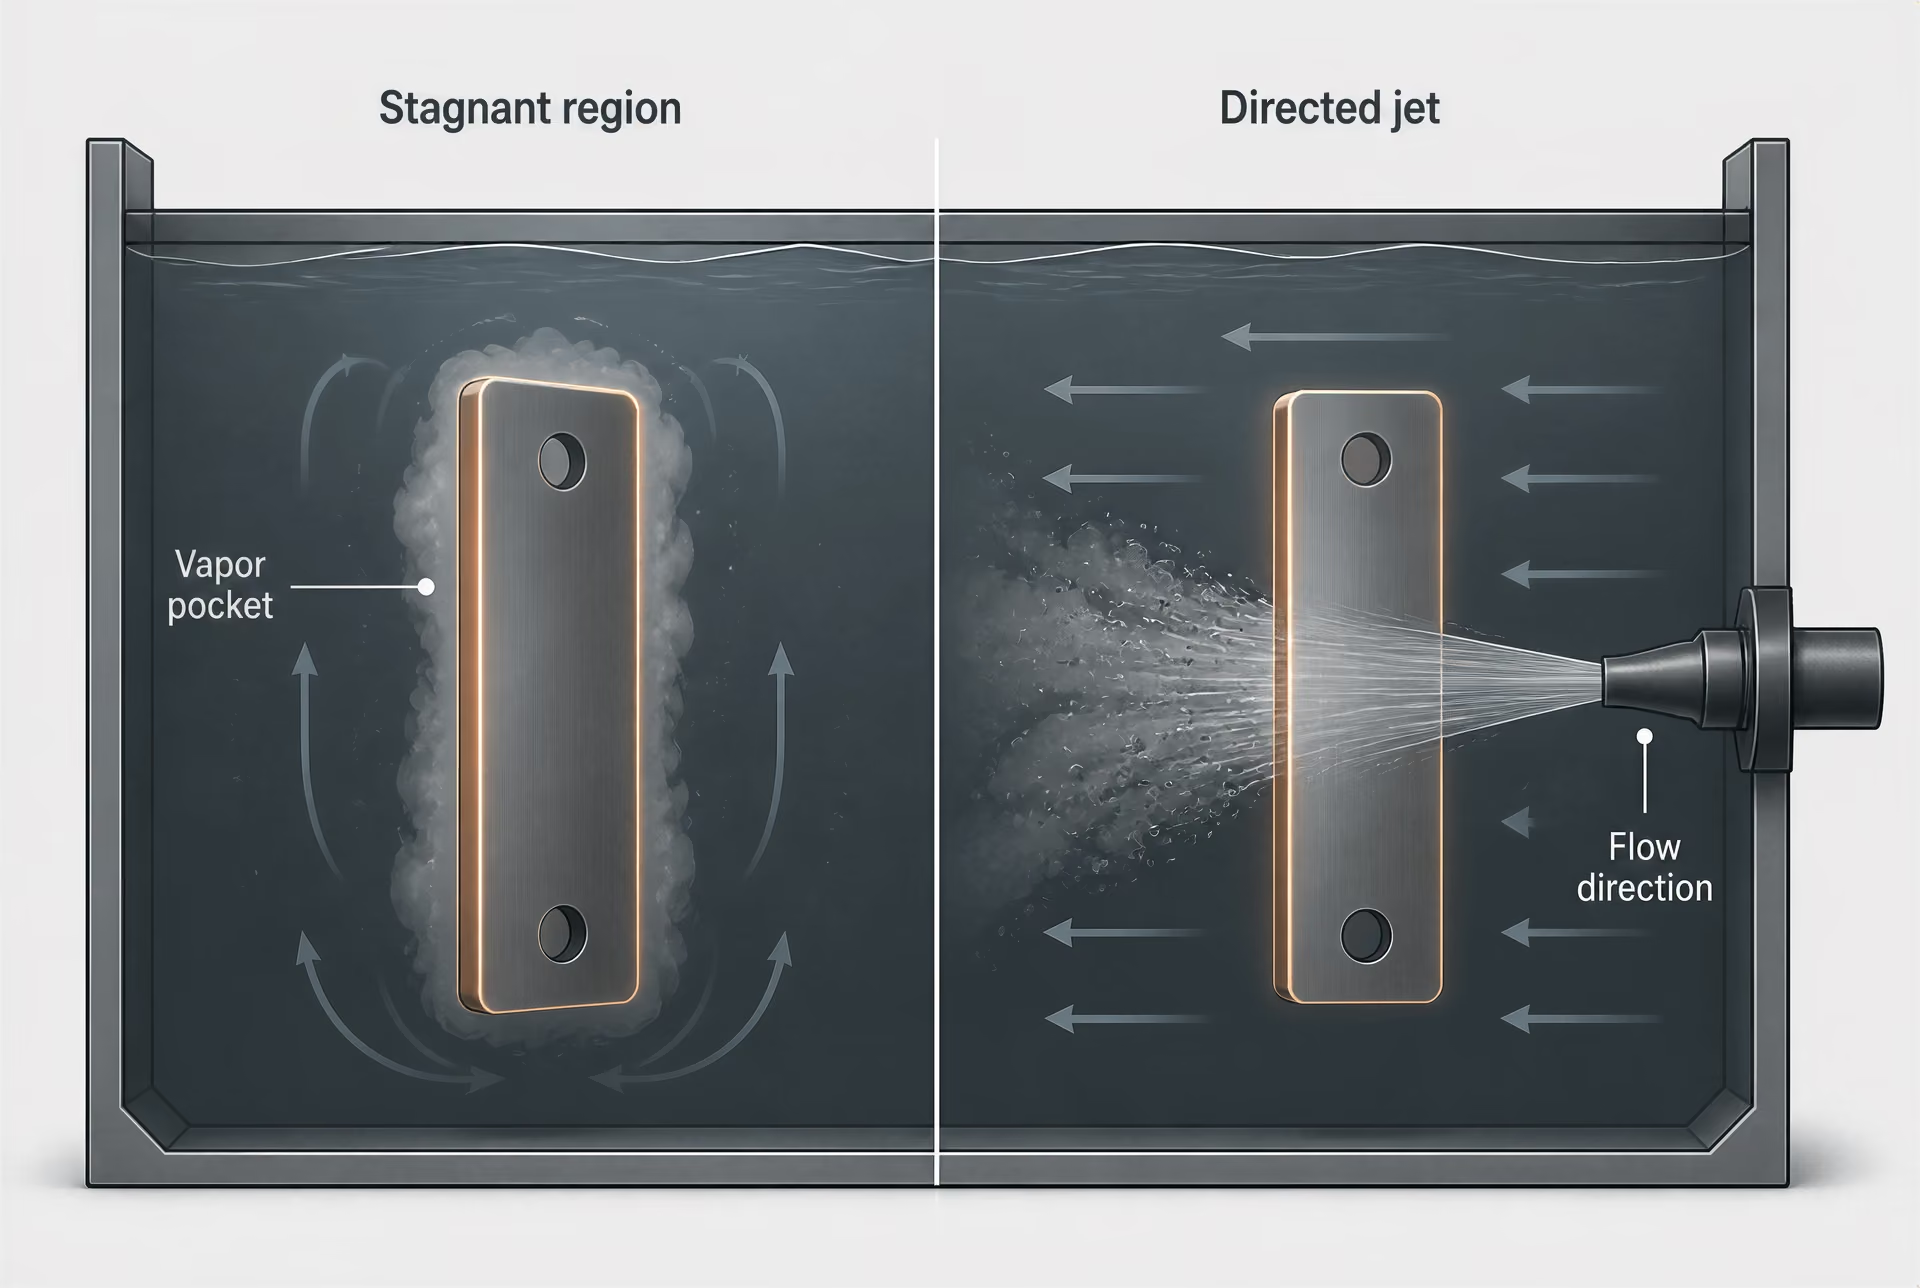
Agitation or flow arrangement can change the result even when the bath composition remains constant. Pump circulation, propeller agitation, workpiece movement, spray pressure, nozzle spacing, and jet direction all alter the boundary layer and remove hot liquid or vapor from the steel surface. A stagnant region beside a large forging may cool far more slowly than a surface directly exposed to a moving jet in the same tank. The peer-reviewed study Role of Quenching Method on Cooling Rate and Microstructure of Steels: Variations in Coolant and Its Flow Arrangement reports that steel microstructure is governed by surface heat-removal rate and local cooling rate, both of which are controlled by coolant type and flow arrangement.
Geometry matters for the same reason. Edges and thin sections expose more surface area relative to their volume and usually cool faster than the center of a thick section. Holes, recesses, keyways, and closely packed parts can trap vapor or restrict liquid movement. A probe suspended in open liquid does not reproduce every local condition on a complex gear, die, shaft, or plate. The measured curve is evidence about the test arrangement, not a guarantee that every point in a load experienced that curve.
Surface condition also changes wetting. Scale, oxidation, machining marks, carburized layers, residual cleaner, oil carryover, and surface deposits can delay liquid contact or stabilize a vapor film. In aqueous quenchants, contamination may alter surface tension and bubble behavior. In oils, oxidation products and sludge can change viscosity, wetting, and circulation. Concentration errors in brine or polymer solutions have similar consequences. The nominal recipe may remain unchanged on paper while the actual interface behaves differently.

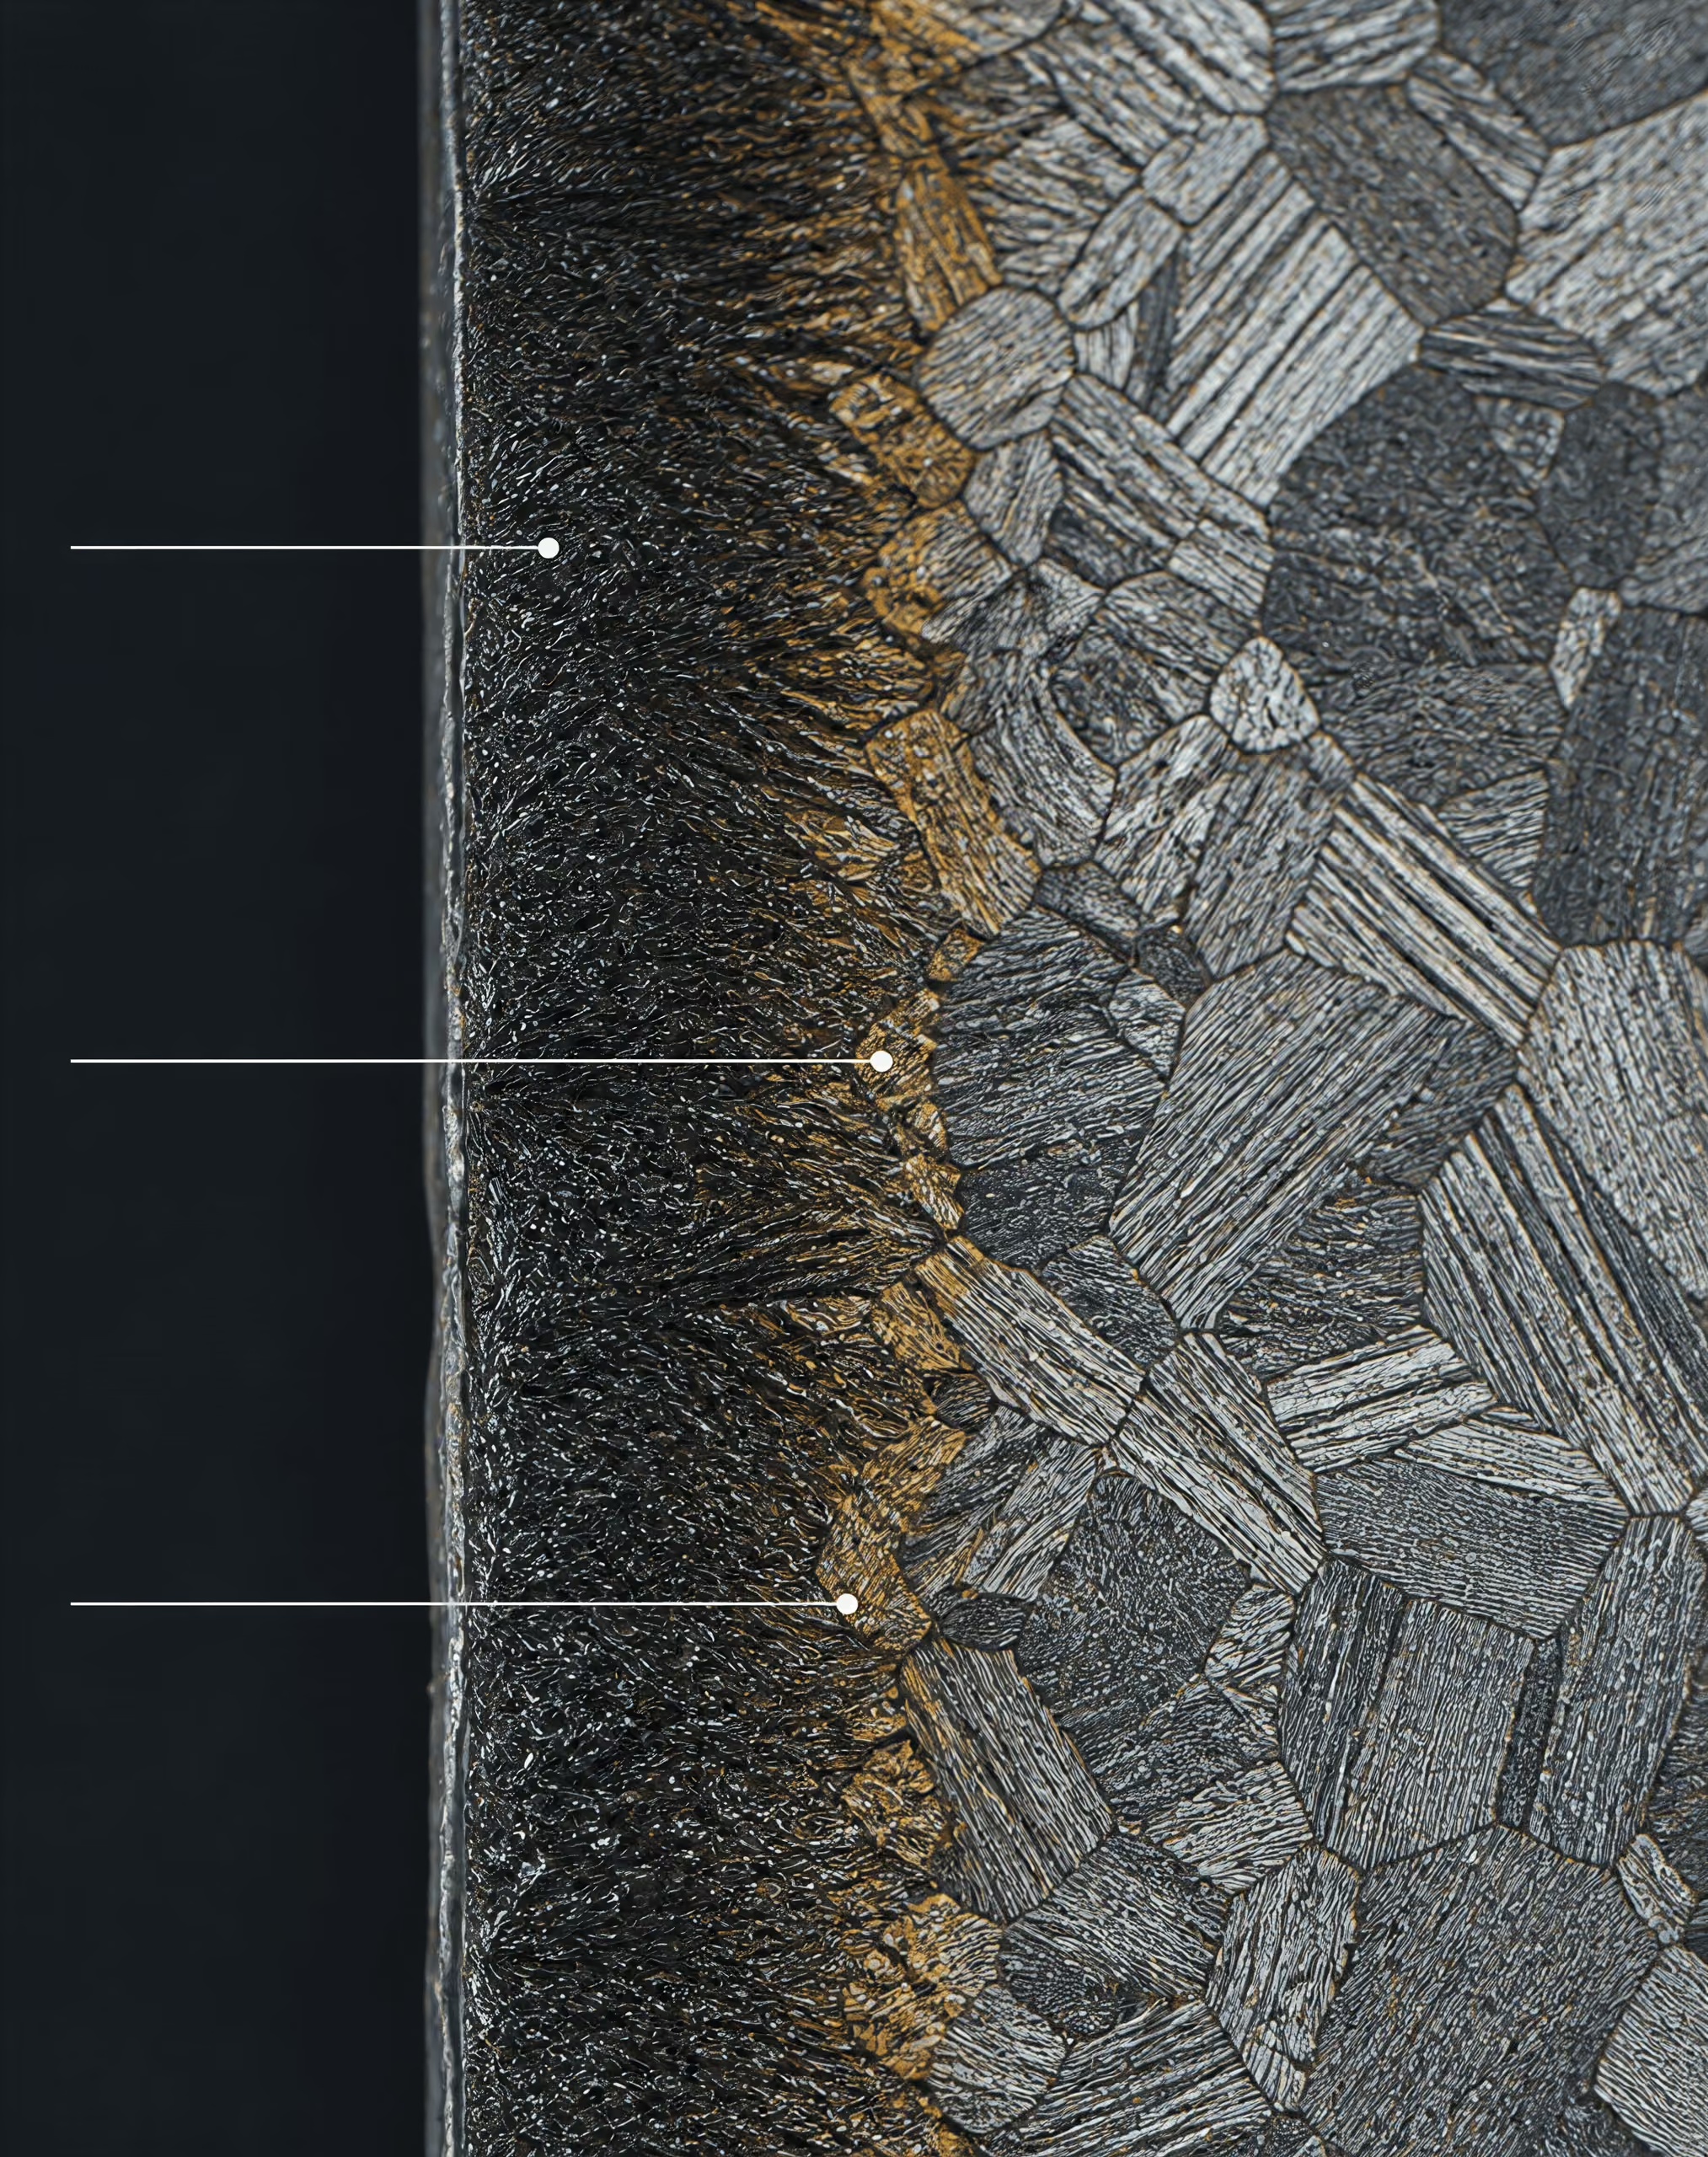
This process dependence connects directly to steel transformation. Austenite must cool through the pearlite and bainite portions of the time–temperature–transformation behavior before it reaches the martensite-start temperature. If local cooling is too slow, ferrite, pearlite, or bainite may form where martensite was intended. If cooling is very severe, the part may develop excessive thermal gradients, distortion, or quench cracking. The relevant question is not simply whether water is “severe” but whether the local cooling history gives the required microstructure without unacceptable stress.
Grossmann H-value An effective quenching-intensity parameter used with steel hardenability and section size in Grossmann analysis; it is not the same as a cooling rate or a cooling-curve ordinate.
Grossmann analysis supplies another useful but separate description. Its H-value, or Grossmann quench severity factor, represents quenching intensity in an idealized heat-transfer analysis and is used with steel hardenability and section size to estimate the resulting hardness distribution. It is not the same as a cooling rate, heat flux, or cooling-curve ordinate. An H-value is an inferred process parameter within the Grossmann framework, whereas a probe cooling curve is a measured temperature history under a specified test.
Reference values illustrate the scale without making it absolute. NPTEL’s 2024 materials assign non-agitated water an arbitrary relative severity rating of 1.0. Typical Grossmann values are approximately 0.25–0.30 for still oil, 0.9–1.0 for still water, and about 2 for still caustic soda or brine. Broader reference ranges give 2.0–5.0 for brine, 0.90–2.0 for room-temperature distilled water, 0.2–1.2 for aqueous polymer solutions, and 0.25–0.80 for conventional or fast quench oils. These are typical ranges, not immutable material constants. A vigorously agitated oil can exceed the severity of still oil, while warm or poorly circulated water can behave less severely than a laboratory reference suggests.
The limits of simple oil-water-brine rankings
The familiar ranking—oil, then water, then brine—can be useful as a first classroom approximation, but it is not a reliable production specification. Brine often suppresses vapor-film persistence and gives faster initial wetting than plain water, so it can produce a higher severity under comparable test conditions. Yet salt concentration, bath temperature, agitation, contamination, and part geometry determine how much that advantage matters. “Water” covers still, circulated, sprayed, warm, cold, distilled, and contaminated conditions. “Oil” covers different viscosities, formulations, temperatures, and degrees of oxidation.
Even the stage being compared changes the ranking. One quenchant may produce a high peak cooling rate during nucleate boiling but a long film-boiling stage. Another may wet the surface sooner and remove heat more consistently, producing a different transformation outcome despite a lower maximum rate. A single H-value also compresses a changing heat-transfer history into one parameter, so it cannot replace examination of the cooling curve when distortion, cracking, or local microstructure is important.[4] Effect of Thermal Conductivity and Viscosity on Cooling Performance of Liquid Quench Media. Study authors. Peer-reviewed study, 2024.
ASTM cooling-curve methods and ISO 9950 are therefore comparison tools bounded by their stated procedures. ASTM D8562-24, for example, reports the behavior of an aqueous polymer quenchant with a silver probe in a non-agitated test for steel-alloy applications; it does not establish a universal ranking against every oil or brine tested by another probe method. The study Effect of Thermal Conductivity and Viscosity on Cooling Performance of Liquid Quench Media likewise relates measured cooling performance and Grossmann H-values to physical properties using the ISO/DIS 9950 probe method, showing why viscosity and thermal conductivity matter without reducing severity to either property alone.
What to report with a severity result
- Medium Name the quenchant and its formulation.
- Condition State temperature, concentration, contamination, and aging condition.
- Flow Identify agitation, circulation, jet direction, or workpiece movement.
- Test Report the probe material, standard, and test arrangement.
- Temperature interval Specify the cooling-rate interval or complete curve being discussed.
The defensible description is thus specific: name the medium, state its temperature and concentration, identify the agitation or flow arrangement, report the probe and standard, and specify the cooling-rate interval or curve being discussed. “Water is more severe than oil” may be directionally true in a particular standardized comparison. It is not a fixed law of quenching.
How Steel Cools During Quenching
When austenitized steel enters a liquid quenchant, its surface does not cool at one steady rate. Heat transfer changes as the surface temperature falls, and the controlling mechanism can change within fractions of a second. ASM International’s ASM Handbook, Volume 4F, Quenchants and Quenching Technology divides the process into three principal stages: vapor-film cooling, nucleate boiling, and convective cooling. The ASTM review Heat Transfer during Quenching and Assessment of Quench Severity—A Review likewise treats cooling rate as a temperature-dependent result of changing heat-transfer mechanisms and wetting kinetics.
This sequence matters because the temperature history at the steel surface controls the transformation products that form inside the part. The Role of Quenching Method on Cooling Rate and Microstructure of Steels study, published in 2022, connects steel microstructure to surface heat-removal rate and local cooling rate, both of which depend on coolant type and flow arrangement. A quenchant therefore does not possess one constant cooling rate across the entire temperature range.
| Stage | Surface condition | Dominant heat-transfer behavior | Typical relative rate |
|---|---|---|---|
| Vapor-film cooling | Continuous or semi-continuous vapor layer | Heat crosses the insulating vapor film | Comparatively slow |
| Nucleate boiling | Liquid contacts the surface between bubbles | Bubble formation, growth, and departure remove heat | Often fastest |
| Convective cooling | Sustained boiling has ended | Conduction through the boundary layer and liquid convection | Slower than nucleate boiling |
Vapor-film or film-boiling stage
At immersion, the steel surface may be far hotter than the quenchant’s boiling temperature. A carbon steel heated into the austenitizing range can enter water, oil, or an aqueous polymer solution with a surface temperature well above 700 °C. Liquid touching that surface vaporizes rapidly. If vapor generation is sufficiently intense, the bubbles join into a continuous or semi-continuous vapor layer around the steel.
This layer is often called a vapor blanket or vapor film. It separates most of the liquid from the metal, reducing direct liquid-solid contact. Vapor has much lower thermal conductivity and density than the liquid, so heat crosses the film less effectively than it would through direct liquid contact. The steel surface can consequently remain very hot while the surrounding quenchant is already boiling.
Film boiling does not mean that heat transfer stops. Energy still moves through the vapor by conduction, radiation, and movement of vapor, but the rate is comparatively limited and can vary across the surface. Geometry, orientation, surface condition, scale, roughness, and trapped gas affect whether the vapor film is continuous. A vertical plate, a cylindrical bar, and a small silver probe can produce different vapor behavior in the same liquid.
The film is also unstable. As the surface temperature decreases, vapor generation weakens. Liquid can then intrude into thin areas of the film. When those areas collapse, fresh liquid contacts the hot metal and evaporates violently. This transition is not a simple switch occurring at exactly one temperature everywhere on a component. It moves across the surface as local wetting conditions change.
Agitation or directed flow can disturb and remove the vapor film, but the result depends on how the fluid reaches the part. A pump, jet, rotating workpiece, or circulation system may break the film in one location while leaving a stagnant region elsewhere. The Role of Quenching Method on Cooling Rate and Microstructure of Steels study emphasizes this local effect: two systems using the same coolant can produce different cooling rates when their flow arrangements differ.
Nucleate-boiling stage
After vapor-film collapse begins, liquid reaches the steel surface at many separate sites. The surface remains hot enough to generate vapor bubbles, but the liquid now makes direct contact with the metal between bubbles. This is the nucleate-boiling stage.
Heat transfer becomes much faster because liquid repeatedly wets the surface, absorbs latent heat, and departs as vapor. Bubbles form at active nucleation sites, grow, detach, and are replaced by cooler liquid. Agitation increases the replacement rate and can also remove bubbles before they merge into a persistent vapor layer. The highest cooling rates commonly occur during this stage, although the exact peak depends on the quenchant, probe, temperature, and fluid motion.
The phrase “water cools faster than oil” is therefore incomplete. Water may show very rapid nucleate boiling under one set of conditions, while an oil with a different viscosity, temperature, or circulation pattern may produce a different cooling curve. Brine can alter wetting by reducing the persistence of vapor bubbles at the steel surface, often increasing cooling severity during the boiling portion of the curve. Aqueous polymers can form a more viscous or polymer-rich boundary layer, changing both bubble behavior and liquid replacement.
Wetting kinetics The rate and manner in which liquid replaces vapor and establishes contact with a hot steel surface during quenching.
Wetting kinetics are central. The ASTM review identifies wetting and heat-transfer mechanisms as reasons that cooling rate varies through the quenching stages. A liquid that wets the surface quickly may end film boiling sooner than another liquid at the same bulk temperature. Concentration, contamination, dissolved gas, surface oxide, and quenchant temperature all affect that behavior. The same nominal quenchant can thus produce different cooling curves after its concentration or operating temperature changes.
[5] ISO 9950:1995. International Organization for Standardization. International Standard, 1995.
Cooling-curve tests measure this changing response rather than assigning a universal property to the liquid. ASTM D8562-24 specifies a non-agitated silver-probe test for aqueous polymer quenchants used with steel alloys. ISO 9950:1995 specifies a nickel-alloy probe test for determining and ranking the cooling characteristics of industrial quenching oils under standardized non-agitated conditions. ASTM Subcommittee D02.L0.06 also identifies ASTM D6200 for quench oils, ASTM D6482 for agitated aqueous polymer quenchants, and ASTM D6549 for agitated quenchants. Results from these methods are comparable only within the stated method and conditions.
Convective cooling stage
When the steel surface falls below the temperature needed for sustained boiling, vapor bubbles largely disappear. Heat then leaves the steel by convection into the liquid, with conduction through the boundary layer at the metal-fluid interface. This is the final convective stage.
Cooling is slower here because the large heat-transfer contribution from evaporation and bubble movement has ended. The rate depends strongly on liquid properties: thermal conductivity, viscosity, density, specific heat, and flow velocity. The study Effect of Thermal Conductivity and Viscosity on Cooling Performance of Liquid Quench Media relates cooling performance and Grossmann H-values to these properties using the ISO/DIS 9950 probe method. Higher viscosity can thicken the boundary layer and restrict fluid replacement, while greater circulation can thin that layer and raise heat transfer.
Part temperature also matters. The steel core may remain much hotter than the surface, so internal conduction continues to feed heat toward the surface during convection. Section thickness, shape, corners, holes, and contact with fixtures produce local differences. A quenchant temperature rise around a large load can further reduce the driving force for heat transfer.
Measured cooling severity must be separated from quenchant type and from Grossmann H-value. NPTEL’s conventional scale assigns non-agitated water an arbitrary severity rating of 1.0. Typical Grossmann H-values are approximately 0.25–0.30 for still oil, 0.9–1.0 for still water, and about 2 for still caustic soda or brine. Other reference ranges give 2.0–5.0 for brine, 0.90–2.0 for room-temperature distilled water, 0.2–1.2 for aqueous polymer solutions, and 0.25–0.80 for conventional or fast quench oils. These are typical reference ranges, not immutable material constants.
An H-value summarizes quenching intensity for Grossmann analysis; it does not replace a cooling curve. Probe material, probe size, agitation, fluid temperature, wetting behavior, and the measured temperature interval all affect the reported result. A useful comparison must state those conditions. Without them, saying that water, oil, or brine has a fixed position in a severity ranking hides the actual heat-transfer process that determines steel cooling.
Water, Brine, Caustic Solutions, and Aqueous Polymer Quenchants
Water and the reference severity scale
Water is often treated as the reference quenchant because its cooling behavior is familiar and its relative severity has long been used in introductory heat-treatment calculations. NPTEL assigns still, non-agitated water an arbitrary quench-severity rating of 1.0. The word arbitrary matters: this number is a reference point, not a material constant and not a promise that every water tank will cool steel at the same rate.
A heated steel surface first produces a vapor film when it enters water. This film temporarily separates the metal from the liquid and limits heat flow. As the surface cools, the film collapses, nucleate boiling transfers heat rapidly, and later convection removes heat after boiling has ended. The duration and intensity of each stage depend on surface temperature, geometry, orientation, agitation, water temperature, dissolved gases, contamination, and the way liquid reaches the part. Cooling rate therefore changes continuously during the quench rather than remaining at one fixed value.
The conventional ranking—brine more severe than water, water more severe than oil—can be useful as a first approximation, but it should not be mistaken for a universal ordering of measured cooling curves. A large, moving water flow can remove heat differently from a still tank. A recessed section may experience a vapor blanket even while an exposed surface is strongly cooled. The peer-reviewed study Role of Quenching Method on Cooling Rate and Microstructure of Steels: Variations in Coolant and Its Flow Arrangement reported that steel microstructure is governed by surface heat-removal rate and local cooling rate, both of which are controlled by coolant type and flow arrangement. The same nominal quenchant can therefore produce different martensite, bainite, or pearlite distributions when the flow arrangement changes.
Grossmann analysis expresses quenching intensity with the H-value, which is separate from a simple water-reference rating and separate again from a cooling-curve result obtained with a probe. Supplied engineering references give typical values of approximately 0.25–0.30 for still oil, 0.9–1.0 for still water, and 2 for still caustic soda or brine. A broader reference gives 0.90–2.0 for room-temperature distilled water. These figures describe commonly cited ranges under stated assumptions; they are not immutable properties of “water.” Temperature, circulation, tank design, workpiece loading, and wetting can move the measured result outside a familiar textbook value.
Testing standards make the limitation clearer. ISO 9950:1995 specifies a nickel-alloy probe method for determining and ranking the cooling characteristics of industrial quenching oils under standardized non-agitated conditions. ASTM International identifies ASTM D6200 for quench oils, ASTM D6482 for agitated aqueous polymer quenchants, ASTM D6549 for agitated quenchants, and ASTM D8562 for aqueous polymer quenchants tested with a silver probe. The result belongs to the probe, temperature, agitation, and procedure used. It does not create a permanent ranking that applies to every steel component.
| Medium | Reference severity information | Important variables |
|---|---|---|
| Water | Arbitrary relative rating of 1.0 for non-agitated water | Temperature, dissolved gases, contamination, agitation, geometry |
| Brine | Typical Grossmann range 2.0–5.0; narrower still value about 2 | Salt identity, concentration, temperature, wetting, agitation |
| Caustic solution | Typical still caustic soda value about 2 | Formulation, concentration, wetting, vapor-film stability |
| Aqueous polymer | Typical Grossmann range 0.2–1.2 | Polymer type, concentration, temperature, degradation, flow |
Brine and caustic-solution effects
Brine is water containing dissolved salt, commonly an inorganic chloride, although the exact salt and concentration must be stated before its cooling behavior can be assessed. Dissolved ions change the liquid’s boiling behavior, electrical and thermal properties, and interaction with the hot steel surface. In many quenching applications, brine breaks up or destabilizes the persistent vapor film that can form around a hot part. More of the surface then reaches direct liquid contact sooner, shortening the film-boiling stage and increasing heat extraction during the early portion of the quench.
That change explains why brine is conventionally assigned a greater severity than still water. The supplied Grossmann references place typical brine H-values at approximately 2.0–5.0, while the narrower conventional value for still brine is about 2. The range is broad for a reason. Salt identity, concentration, solution temperature, agitation, surface condition, and part geometry all affect wetting and boiling. A brine tank with weak circulation does not necessarily produce the same cooling curve as a vigorously agitated tank of the same nominal composition.
Greater early heat removal can reduce the time available for diffusional transformations in austenitized steel and can promote martensite formation where hardenability permits it. It can also increase thermal gradients, residual stress, distortion, and quench cracking. The resulting risk depends on steel grade, section size, carbon content, prior austenite grain size, and restraint. For example, an alloy steel such as AISI 4140 does not respond to a brine quench in the same way as a plain-carbon grade such as AISI 1045, even when both are quenched from comparable austenitizing temperatures.
Caustic solutions, often based on sodium hydroxide, are also associated with high quench severity. The reference value of approximately 2 for still caustic soda or brine should be read as a typical Grossmann comparison, not as a universal value for every alkaline solution. Caustic additions can alter wetting and vapor-film stability, but the direction and size of the change depend on formulation and operating conditions. Concentration alone does not specify the heat-transfer result.
The three cooling stages remain important in both brine and caustic solutions. A solution may produce a shorter vapor-film period yet show a different nucleate-boiling peak, and its convection stage may be affected by viscosity, density, and tank movement. ASTM’s review Heat Transfer during Quenching and Assessment of Quench Severity—A Review emphasizes that cooling rate varies through these distinct stages and depends on wetting kinetics and heat-transfer mechanisms. A single H-value cannot show every feature of that curve.
Polymer concentration and cooling behavior
Aqueous polymer quenchants replace part of water’s simple boiling response with a liquid whose behavior changes with polymer type, molecular structure, concentration, temperature, and degradation history. The polymer can increase viscosity and modify the liquid film at the steel surface. It may also change wetting, vapor-film persistence, bubble formation, and the transition from boiling to convection. Those effects are coupled: a thicker or more viscous boundary layer may hinder fluid movement, while a changed surface film may alter when direct liquid contact occurs.
This is why polymer solutions cannot be assigned one fixed severity merely from the word “polymer.” The supplied Grossmann range is approximately 0.2–1.2 for aqueous polymer solutions. That span overlaps portions of the customary oil and water ranges. It is a typical reference range, not a universal interval for every polymer, concentration, temperature, or flow arrangement. Increasing concentration may increase viscosity and modify film formation, but the resulting cooling curve cannot be predicted safely from concentration alone without a defined formulation and test.
ASTM D8562-24 specifies a non-agitated silver-probe cooling-rate test for aqueous polymer quenchants used with steel alloys. Its time-temperature data can support comparison or quenchant selection under the specified method. The result is still a test result under non-agitated conditions, not a universal ranking of the solution in every production tank. For agitated systems, ASTM D6482 and ASTM D6549 address different test arrangements, making the distinction between quenchant type and measured severity explicit.
The study Effect of Thermal Conductivity and Viscosity on Cooling Performance of Liquid Quench Media connects measured cooling performance and Grossmann H-values with thermal conductivity and viscosity using the ISO/DIS 9950 probe method. These properties help explain behavior, but neither property alone determines the complete quench curve. Wetting kinetics and flow can dominate the first seconds of cooling, while convection and viscosity become more influential later.
For this reason, concentration control must be paired with temperature control, agitation control, and cooling-curve checks. A polymer bath that has drifted in concentration or suffered thermal degradation may no longer match its original test result. The meaningful specification is not “water,” “brine,” or “polymer” in isolation; it is the quenchant composition together with its temperature, movement, probe method, and measured cooling behavior.
Quench Oils and Their Cooling Characteristics
Quench oil is not a single cooling medium with one standard cooling rate. The word oil identifies the broad chemical class of the bath, not its quenching severity. Two oils can produce different cooling curves because their base stocks, additives, viscosity, oxidation state, temperature, and agitation differ. Even the same bath can give different results when the workpiece enters at another temperature or when pumps, propellers, or circulation nozzles change the flow around its surface.
That distinction matters because steel properties depend on the local cooling history. The study Role of Quenching Method on Cooling Rate and Microstructure of Steels: Variations in Coolant and Its Flow Arrangement (2022) relates steel microstructure to the rate of heat removal at the surface and the local cooling rate within the part. Coolant type is only one control. Flow arrangement is another.
Industrial quench-oil classification
ASM International’s ASM Handbook, Volume 4F, Quenchants and Quenching Technology treats quench oils through their composition, intended operating range, and measured cooling behavior rather than as one fixed point on a universal severity scale. Industrial classifications commonly distinguish conventional or normal-speed oils, accelerated or fast oils, and hot-quenching oils. These groups describe practical formulation and operating differences, but they do not eliminate the need for a cooling-curve test.
Conventional oils are generally mineral-oil-based fluids formulated for ordinary immersion quenching. Accelerated oils contain additives intended to increase heat extraction, often by changing wetting, vapor-film behavior, or the later stages of liquid cooling. Hot oils are operated at elevated bath temperatures to reduce distortion and thermal shock; their higher temperature can also reduce viscosity and change the cooling curve. The category name therefore gives useful process information, but it does not supply a numerical cooling severity.
Oil condition is part of classification in practice. Oxidation, contamination by water or cleaning chemicals, sludge formation, and additive depletion can alter wetting and heat transfer. A new oil and an aged oil from the same nominal product class may not cool a probe in the same way. A bath’s actual temperature and circulation state must be recorded with the fluid description.
ISO 9950:1995 provides a defined method for determining and ranking the cooling characteristics of industrial quenching oils. It uses a nickel-alloy probe under standardized non-agitated conditions. That qualification is essential: the result is a ranking under the ISO test arrangement, not a permanent ranking of every oil in every furnace or tank. ASTM International identifies ASTM D6200 as a quench-oil cooling-curve method, alongside ASTM D6482 for agitated aqueous polymer quenchants and ASTM D6549 for agitated quenchants. The methods answer related questions under different test conditions.
Grossmann analysis supplies another description. Its H-value represents quenching intensity in a heat-transfer model, not a chemical constant of the fluid. Frequently cited reference values are approximately 0.25–0.30 for still oil, 0.9–1.0 for still water, and about 2 for still caustic soda or brine. Broader typical ranges place conventional or fast quench oils at about 0.25–0.80, although reported values can extend across roughly 0.2–1.2 depending on the oil and operating condition. For comparison, typical ranges are about 2.0–5.0 for brine, 0.90–2.0 for room-temperature distilled water, and 0.2–1.2 for aqueous polymer solutions.
These figures should not be read as immutable material constants. NPTEL assigns non-agitated water an arbitrary relative severity rating of 1.0, illustrating that such scales are comparative conventions. An H-value obtained for one bath, probe method, agitation state, and temperature should not be transferred uncritically to another arrangement.
Still and agitated oil behavior
Immersion in still oil produces several heat-transfer stages. Immediately after the hot steel enters the bath, the surrounding oil may vaporize and form a vapor blanket. This film separates the surface from liquid oil and limits heat transfer. The film eventually collapses as the surface cools or as fluid motion disrupts it. Nucleate boiling or vigorous local vapor generation may then occur, followed by single-phase liquid cooling after the surface temperature falls below the boiling range relevant to the bath.
The cooling rate changes substantially from one stage to another. ASTM’s review Heat Transfer during Quenching and Assessment of Quench Severity—A Review emphasizes that a single average cooling rate cannot represent these separate mechanisms. The temperature at which the vapor film collapses, the duration of boiling, and the rate of later liquid cooling all affect the steel’s thermal path.
Agitation changes each of those events. Moving oil removes hot fluid from the workpiece, supplies cooler liquid to the surface, and can break up or thin a vapor blanket. It also reduces the boundary layer through which heat must pass. The resulting cooling curve may show a higher maximum cooling rate and a shorter vapor stage than the same oil tested without motion. But “agitated” is not one condition. Tank circulation, workpiece movement, impeller flow, pump jets, and a directed spray create different velocity fields. A large part may shield another part, and corners, holes, and narrow gaps may receive less flow than exposed faces.
Flow direction is especially important in distortion control. If one side of a ring or gear receives stronger circulation, that side can cool and contract earlier. The local difference in heat extraction can produce shape change even when the bath’s average temperature is uniform. For this reason, a cooling curve from a laboratory probe cannot by itself predict every location in a complex steel component.
The probe method also limits comparison. ISO 9950:1995 is deliberately non-agitated and uses a nickel-alloy probe. ASTM D8562-24, by contrast, specifies a non-agitated silver-probe cooling-rate test for aqueous polymer quenchants used with steel alloys. The probe material, geometry, thermocouple position, agitation, bath volume, and data-reduction procedure all affect the reported result. A value from one method is not automatically interchangeable with a value from another.
Viscosity, thermal conductivity, and heat transfer
Viscosity affects how readily oil moves around the steel and how thick a fluid boundary layer develops at the surface. Higher viscosity generally raises resistance to motion, so natural convection is weaker and forced flow requires more pumping energy. It can also leave a thicker, slower-moving layer next to the workpiece. As bath temperature rises, viscosity usually falls, which helps circulation and can alter the transition from vapor-film cooling to liquid convection. This is one reason a hot oil may behave very differently from the same oil at room temperature.
Thermal conductivity determines how readily heat passes through the oil layer once the fluid is in contact with the surface. Higher conductivity supports faster conduction away from the steel, but conductivity alone does not determine cooling severity. A highly conductive fluid that barely moves can remove heat less effectively than a less conductive fluid with strong circulation. Density, heat capacity, viscosity, wetting, vapor formation, and flow velocity act together.
The study Effect of Thermal Conductivity and Viscosity on Cooling Performance of Liquid Quench Media connects measured cooling performance and Grossmann H-values with thermal conductivity and viscosity using the ISO/DIS 9950 probe method. Its significance is not that one property can rank all oils. Rather, it shows why physical-property data help explain cooling curves: viscosity influences fluid motion and boundary-layer transport, while thermal conductivity influences heat conduction through the fluid. The measured H-value remains a result of the complete heat-transfer system.
Wetting adds another limitation to property-only predictions. An oil with favorable viscosity and conductivity may still form a persistent vapor layer on a poorly wetted surface. Additives can change surface tension and wetting kinetics, while contamination can change them again. The same nominal viscosity measured in a laboratory cup therefore does not guarantee the same quench performance after oxidation, dilution, or prolonged service.
Oil selection and process control should consequently specify the bath temperature, circulation arrangement, probe method, and acceptance curve alongside the oil classification. Cooling-time intervals, maximum cooling rate, and characteristic temperatures are more informative than the label “oil.” Measured behavior is the transferable evidence; the fluid name is only the starting description.
Agitation, Flow Arrangement, and Part Geometry
Quenching severity is not a permanent ranking assigned to a liquid. It is a measured response produced by a quenchant under particular thermal and fluid-flow conditions. The same oil, water solution, or brine can remove heat at different rates when the liquid is still, stirred, pumped through a tank, sprayed through a nozzle, or directed at only one face of a component. Part shape adds another variable: a flat silver probe, a forged shaft, and a perforated plate do not expose the coolant to the same flow field.
ASM International’s ASM Handbook, Volume 4F, Quenchants and Quenching Technology separates quenchant type, cooling behavior, and quench severity for this reason. Grossmann analysis expresses quenching intensity as an H-value, but H is not a material constant. Typical reference values are about 0.25–0.30 for still oil, 0.9–1.0 for still water, and approximately 2 for still caustic soda or brine. Broader tabulations give 2.0–5.0 for brine, 0.90–2.0 for room-temperature distilled water, 0.2–1.2 for aqueous polymer solutions, and 0.25–0.80 for conventional or fast quench oils. These ranges describe particular conditions and correlations, not immutable rankings. Agitation, temperature, concentration, contamination, wetting, and geometry can move the measured result substantially.
Agitated versus non-agitated tests
A non-agitated probe test gives a controlled reference, not a universal answer for a production load. ISO 9950:1995 uses a nickel-alloy probe to determine the cooling characteristics of industrial quenching oils under standardized non-agitated conditions. ASTM D8562-24 specifies a non-agitated silver-probe cooling-rate test for aqueous polymer quenchants used with steel alloys. In both cases, the probe, bath, orientation, temperature history, and procedure define the result. A reported cooling curve can therefore support comparison between samples tested by the same method, while still failing to predict every location on a moving, crowded workpiece.
The distinction matters because agitation alters the liquid boundary layer and the stability of vapor next to the hot surface. During immersion quenching, heat transfer passes through recognizable stages: an initial vapor-film stage, a nucleate-boiling stage, and a convective stage after the surface temperature falls below the range that sustains vigorous boiling. The ASTM review Heat Transfer during Quenching and Assessment of Quench Severity—A Review describes cooling rate as changing through these stages rather than remaining constant. Agitation can shorten or disrupt the vapor-film stage, increase liquid replacement at the surface, and raise the local heat-transfer coefficient. It can also make cooling less uniform if the flow reaches one face more directly than another.
ASTM International’s Subcommittee D02.L0.06 identifies different procedures for different conditions. Its listed methods include ASTM D6200 for quench oils, ASTM D6482 for agitated aqueous polymer quenchants, ASTM D6549 for agitated quenchants, and ASTM D8562 for aqueous polymer quenchants tested with a silver probe. The word “agitated” in a method designation is not a minor procedural detail. It changes the hydrodynamic environment being measured. Comparing a non-agitated D8562 result with an agitated polymer test, then treating the two values as a single fixed scale, confuses test configuration with quenchant identity.
A still bath may show a long vapor stage and a lower peak cooling rate, whereas pumping or mechanical stirring may collapse vapor pockets and increase cooling during nucleate boiling. Excessive agitation does not simply make every location cool at the same faster rate. Vortices, recirculation zones, and dead zones can produce local differences. A probe’s peak cooling rate may rise while another surface on a component remains partly shielded from the moving liquid.
The study Effect of Thermal Conductivity and Viscosity on Cooling Performance of Liquid Quench Media, using the ISO/DIS 9950 probe method, relates measured cooling performance and Grossmann H-values to thermal conductivity and viscosity. Those properties help explain trends, but they do not replace a specified flow condition. Wetting kinetics and boiling behavior remain decisive, particularly during the high-temperature portion of the cooling curve.
Jet, immersion, and directional flow
Immersion and jet quenching impose different boundary conditions. In immersion, the component enters a surrounding liquid and develops a flow field from buoyancy, vapor movement, part motion, and any imposed circulation. In jet quenching, a nozzle supplies liquid with a defined velocity and direction. The jet may strike a broad face, enter a bore, pass across a slot, or impinge on a selected zone. Surface heat removal then depends on impact location, jet diameter, spacing, angle, pressure, and the ability of spent liquid and vapor to escape.
The peer-reviewed 2022 study Role of Quenching Method on Cooling Rate and Microstructure of Steels: Variations in Coolant and Its Flow Arrangement directly establishes that steel microstructure is governed by surface heat-removal rate and local cooling rate, controlled by coolant type and flow arrangement. This finding rejects the convenient assumption that a quenchant has one cooling rate for the entire part. Two regions made from the same steel and cooled in the same tank can follow different thermal paths if one region faces a strong stream and the other lies in a recirculation shadow.
Directional flow can also create thermal asymmetry. A jet striking one side of a plate may produce a steep temperature gradient through the thickness and a different gradient along the surface. A rotating shaft can reduce that asymmetry by moving every circumference through the flow, although rotation introduces its own changing boundary layer. Cross-flow through a rack of parts may be effective at the exposed surfaces but weak between closely spaced components. Flow arrangement therefore belongs in the process record alongside bath temperature and quenchant concentration.
The practical metallurgical consequence is direct. If one region cools rapidly enough to suppress diffusional transformation while another passes more slowly through the transformation range, the resulting fractions of martensite, bainite, pearlite, or ferrite can differ. Hardness, residual stress, distortion, and cracking risk follow those local differences. A cooling curve from one probe position cannot prove uniform cooling throughout a complex load.
Shadowing, vapor entrapment, and section thickness
Geometry controls access to the liquid. A hole may trap vapor during immersion, especially when its axis and the escape path oppose the flow. A recess can retain a hot gas or vapor layer after the surrounding flat surface has already entered nucleate boiling. Corners alter boundary-layer development and may experience concentrated flow, while adjacent enclosed regions receive little replacement liquid. These effects are commonly described as shadowing or vapor entrapment, but they are heat-transfer problems rather than merely visual defects in circulation.
The orientation of a part can determine whether vapor drains or remains attached. A downward-facing pocket may hold a stable vapor layer; rotating the component or changing the jet direction may expose that same surface to liquid much sooner. A through-hole may cool differently from a blind hole because vapor and liquid have different escape routes. Closely packed parts can shadow one another, reducing local flow and changing the apparent severity experienced by interior pieces even when the tank’s pump rate is unchanged.
Section thickness adds thermal storage. A thin flange can approach the quenchant temperature quickly, while the core of a thick boss remains hot and continues supplying heat to its surface. The surface may therefore pass through film boiling, nucleate boiling, and convection while the center is still near the austenitizing temperature. In a thick section, local cooling rate is not only a function of the external heat-transfer coefficient; it also reflects conduction from the interior. Corners, holes, and transitions between thin and thick sections intensify these differences.
For that reason, a standardized probe result should be treated as a controlled indicator of relative performance under its stated method. It should not be converted automatically into a universal oil-versus-water ranking or applied unchanged to every geometry. The relevant question is not simply whether a medium is called oil, water, polymer, or brine. It is how the specified coolant, flow arrangement, wetting behavior, part orientation, and section geometry remove heat at the location that controls the steel’s transformation.
Grossmann H-Value and the Meaning of Quench Severity
The H-value as a heat-transfer representation
The Grossmann method gives quenching intensity a numerical form through the H-value. It does not assign an intrinsic rank to water, oil, or brine. Instead, it represents the effectiveness with which a particular quenching operation removes heat from a steel surface and transfers it into the quenchant.
In the classical treatment, the H-value is related to the surface heat-transfer coefficient, , and the thermal conductivity of the steel, , commonly expressed as:
The value is often reported in inverse length units, such as , depending on the chart or reference system being used. A higher H-value indicates a stronger boundary condition: heat leaves the steel surface more rapidly relative to the steel's ability to conduct heat internally. A lower value represents a less severe thermal boundary.
That distinction matters because quenching is not controlled by surface heat transfer alone. The surface cools first, while the center of a bar or plate remains hot. Heat must travel from the interior toward the surface before it can enter the quenchant. Grossmann analysis combines the quenchant-side H-value with the steel's hardenability and the section geometry to estimate how much of the section can transform to martensite.
Grossmann's method commonly uses the ideal critical diameter, , as the steel-side measure of hardenability. The ideal critical diameter describes the size of a round bar that would develop a specified transformation response under an infinitely severe quench, where the surface is treated as reaching the quenchant temperature without an appreciable interfacial resistance. The actual critical diameter depends on both and H. The same steel can therefore produce very different hardness profiles when quenched in still oil, agitated oil, water, or brine.
A large H-value does not automatically mean that every point in a component cools rapidly enough to form martensite. It means that the surface boundary removes heat effectively. A thick section may still cool slowly at its center because of the distance that heat must travel. A thin section of a moderately hardenable steel may fully harden in a lower-severity quenchant, while a heavy section of the same grade may retain ferrite, pearlite, or bainite at its core.
The method is therefore a bridge between hardenability data and process conditions. It helps interpret steel response rather than replacing a cooling curve, a hardness traverse, or a production validation test.
The number also should not be confused with the cooling rate at one temperature. Quenching passes through several heat-transfer stages. During the initial vapor-film stage, a stable vapor blanket can insulate the surface and limit heat flow. Nucleate boiling begins when the film collapses; liquid contacts the hot steel intermittently and heat extraction can become very rapid. At lower temperatures, boiling subsides and convection controls the remaining cooling. ASTM International's 2024 review, Heat Transfer during Quenching and Assessment of Quench Severity—A Review, emphasizes that cooling rate changes through these distinct stages. A single H-value compresses this changing behavior into an engineering representation.
Typical reference ranges
Frequently cited Grossmann reference values place still oil at approximately 0.25–0.30, still water at 0.9–1.0, and still caustic soda or brine at about 2. These figures are useful for showing the conventional order of magnitude, but they are not fixed ratings assigned permanently to chemical categories.
Broader reference ranges show why a single number for each quenchant family can mislead. Typical H-values are reported as approximately 2.0–5.0 for brine, 0.90–2.0 for room-temperature distilled water, 0.2–1.2 for aqueous polymer solutions, and 0.25–0.80 for conventional or fast quench oils. The overlap is significant. A fast quench oil can approach the lower end of an aqueous system under one condition, while a polymer solution can produce a severity close to that of water or oil depending on concentration, temperature, and agitation.
NPTEL's 2024 treatment assigns non-agitated water an arbitrary relative severity rating of 1.0. “Arbitrary” is important: the number provides a reference scale, not a fundamental unit of quenching intensity. It allows other conditions to be compared with a defined baseline. It does not mean that all non-agitated water baths produce exactly the same cooling curve or the same steel microstructure.
Brine can show higher apparent severity than water because dissolved salts alter wetting and disrupt vapor-film formation. Still, salt concentration, bath temperature, contamination, workpiece surface condition, and movement through the bath affect the result. Caustic soda solutions may also produce strong cooling because their wetting behavior differs from that of plain water. The chemical label alone cannot determine the H-value.
Oil introduces another set of variables. Viscosity, thermal conductivity, additive chemistry, oxidation, contamination, and bath temperature affect the vapor, boiling, and convection stages. An oil classified as a fast quench oil in one test may give a markedly different result after prolonged service or under a different flow arrangement. Aqueous polymer solutions are even more sensitive to concentration, polymer type, degradation, and solution movement. Their cooling curves can change substantially as the polymer deposit at the steel surface changes.
Why H-value is not a universal material constant
An H-value belongs to a defined test or process condition, not to the quenchant name by itself. It depends on agitation or flow, probe geometry, probe material, surface condition, bath temperature, load size, orientation, and the method used to calculate or report the result. The measured value can also depend on which portion of the cooling curve is emphasized.
This is why cooling-curve standards must be identified alongside their results. ISO 9950:1995 specifies a nickel-alloy probe method for determining the cooling characteristics of industrial quenching oils under standardized non-agitated conditions. ASTM D8562-24 specifies a non-agitated silver-probe cooling-rate test for aqueous polymer quenchants used with steel alloys. ASTM Subcommittee D02.L0.06 lists ASTM D6200 for quench oils, ASTM D6482 for agitated aqueous polymer quenchants, ASTM D6549 for agitated quenchants, and ASTM D8562 for aqueous polymer quenchants tested with a silver probe.
Those methods can support comparison, but their values should not be copied between unlike systems without qualification. A silver probe in a non-agitated polymer bath does not reproduce a steel forging moving through an agitated production tank. A nickel-alloy probe intended for oil comparison does not provide a direct H-value for a brine operation. Probe thermal properties, dimensions, surface finish, and temperature history influence the measured cooling curve.
The difference between measured cooling severity and Grossmann H-value must remain clear. A cooling-curve test records temperature against time at a probe location. Grossmann analysis uses an effective heat-transfer representation to connect the quenching boundary with steel hardenability and section response. A cooling curve may be converted into an estimated severity for a particular analytical purpose, but the conversion contains assumptions.
The 2022 peer-reviewed study Role of Quenching Method on Cooling Rate and Microstructure of Steels: Variations in Coolant and Its Flow Arrangement makes the process consequence direct: steel microstructure depends on surface heat-removal rate and local cooling rate, both of which are controlled by coolant type and flow arrangement. The study Effect of Thermal Conductivity and Viscosity on Cooling Performance of Liquid Quench Media likewise relates measured cooling performance and Grossmann H-values to liquid thermal conductivity and viscosity using the ISO/DIS 9950 probe method.
Consequently, H-values are most useful when reported with the conditions that produced them. “Oil, H = 0.3” is incomplete. A technically meaningful statement identifies the oil, bath temperature, agitation state, probe or workpiece method, and calculation basis. Without that information, the figure is only a rough reference. Grossmann analysis remains valuable precisely when treated as a model of a particular quenching boundary—not as a universal material constant or a permanent ranking of media.
Cooling-Curve Testing and Probe Methods
Time-temperature data and cooling curves
A cooling-curve test records the temperature of a heated probe as it cools in a quenchant. The result is a time-temperature dataset, usually plotted with time on the horizontal axis and probe temperature on the vertical axis. The curve shows how rapidly heat leaves the probe at each temperature, while its derivative, , gives the instantaneous cooling rate. A steep section means rapid temperature loss; a shallow section means slower heat transfer.
The slope is not constant because quenching does not involve one heat-transfer mechanism from start to finish. When a hot probe enters a liquid, a vapor blanket may form around its surface. This film-boiling stage separates the probe from the liquid and often produces a comparatively low or moderate cooling rate. As the vapor film collapses, liquid contacts the surface intermittently or continuously. Nucleate boiling can then remove heat very rapidly, producing the steepest part of the curve. At lower temperatures, boiling subsides and convection becomes the main mechanism, so the curve usually flattens again.
The exact transitions depend on the quenchant, probe surface, temperature, agitation, contamination, and wetting behavior. A quenchant that breaks the vapor film quickly can cool a probe rapidly even if its thermal conductivity is not exceptional. Conversely, poor wetting can preserve an insulating vapor layer and delay heat extraction. ASTM International’s review, Heat Transfer during Quenching and Assessment of Quench Severity—A Review, emphasizes that cooling rate changes through distinct quenching stages rather than remaining a fixed property of the liquid.
Cooling-curve analysis therefore provides more information than a single label such as “oil,” “water,” or “brine.” A test may report the time required to cool through selected temperatures, the maximum cooling rate, the temperature at which that maximum occurs, or the cooling rate at specified temperatures. Those values can be compared when the same probe geometry, initial temperature, vessel, agitation, data-acquisition system, and reporting procedure are used.
The temperature interval matters metallurgically. For a steel part, the cooling rate through the austenite-to-pearlite or austenite-to-bainite transformation range can affect the fraction and distribution of transformation products. Cooling through the martensite-start range affects martensite formation, while excessive surface cooling can increase thermal stress and the risk of distortion or cracking. The probe does not reproduce every feature of a real steel component, but it supplies a controlled measure of heat-transfer behavior.
This is why quenchant type must be separated from measured cooling severity. NPTEL’s conventional relative scale assigns non-agitated water an arbitrary severity rating of 1.0. That number is a reference, not a material constant. Agitation, water temperature, dissolved gas, surface condition, and part geometry can change the measured result. The same distinction applies to Grossmann analysis. Typical reference H-values are about 0.25–0.30 for still oil, 0.9–1.0 for still water, and approximately 2 for still caustic soda or brine. Broader published ranges include 2.0–5.0 for brine, 0.90–2.0 for room-temperature distilled water, 0.2–1.2 for aqueous polymer solutions, and 0.25–0.80 for conventional or fast quench oils. These are practical ranges, not immutable constants for every bath and operating condition.
An H-value also differs from a probe cooling curve. Grossmann’s represents quenching intensity in a heat-flow model used with steel hardenability and section-size calculations. A probe test measures the thermal response of a specified probe under a specified procedure. The two can be related, but one should not be substituted for the other without a defined correlation.
ASTM D6200, D6482, and D6549
ASTM International’s characterization paper, Quenchant Characterization by Cooling Curve Analysis, identifies ASTM D6200, ASTM D6482, and ASTM D6549 as relevant cooling-curve standards. ASTM Subcommittee D02.L0.06 also lists their intended applications: ASTM D6200 addresses quench oils, ASTM D6482 addresses agitated aqueous polymer quenchants, and ASTM D6549 addresses agitated quenchants. ASTM D8562 is listed separately for aqueous polymer quenchants tested with a silver probe.
The standards do not merely classify liquids by chemical name. They prescribe a test arrangement so that the temperature history of a probe can be measured and compared. Probe dimensions and material, liquid volume, bath temperature, agitation or flow arrangement, probe positioning, and temperature-recording requirements all influence the result. A result obtained under ASTM D6200 cannot automatically be treated as equivalent to a result obtained under ASTM D6482 or ASTM D6549, because the probe and operating conditions may differ.
Agitation deserves particular attention. Moving liquid changes the thickness and stability of the vapor layer, renews cooler quenchant at the probe surface, and alters the transition between boiling and convection. In an industrial tank, flow may be produced by pumps, propellers, jets, part movement, or circulation around a rack. “Agitated” is therefore not a complete description of the hydrodynamic condition unless the direction and intensity of flow are also controlled or recorded.
ASTM D8562-24 specifies a non-agitated silver-probe cooling-rate test for aqueous polymer quenchants used with steel alloys. Its result can guide comparison of aqueous polymer formulations or indicate relative cooling severity under that method. It cannot establish a universal ranking against every oil, water bath, or brine system, because the result belongs to the defined silver-probe, non-agitated test condition.
The ASTM framework is useful precisely because it limits the claim being made. If two oils are tested by ASTM D6200 in the same laboratory with acceptable repeatability, their curves can support a relative comparison. If one oil is tested in a still bath and another in a strongly circulated production tank, the numbers do not describe the same heat-transfer condition. A curve also does not directly predict hardness, distortion, residual stress, or cracking without considering steel grade, section thickness, geometry, prior austenite condition, and part loading.
The 2022 peer-reviewed study Role of Quenching Method on Cooling Rate and Microstructure of Steels: Variations in Coolant and Its Flow Arrangement makes this process connection directly: steel microstructure is governed by surface heat-removal rate and local cooling rate, both of which are controlled by coolant type and flow arrangement. A probe result is thus evidence about a heat-transfer test, not a complete specification of the microstructure that every steel part will develop.
ISO 9950:1995 and the nickel-alloy probe
ISO 9950:1995 specifies a nickel-alloy probe method for determining and ranking the cooling characteristics of industrial quenching oils under standardized non-agitated conditions. The probe’s thermal response is recorded as it cools in the oil, and the resulting curve supplies comparative information about cooling behavior at different temperatures. Because the method uses a defined nickel-alloy probe and non-agitated bath, laboratories can compare oil behavior when the prescribed conditions are maintained.
The ranking has a narrow but useful meaning. If oil A produces a faster cooling response than oil B in ISO 9950:1995 testing, oil A has the greater measured cooling characteristic under that method. The result can help identify changes caused by oxidation, contamination, aging, or formulation differences when samples are tested consistently.
It cannot prove that oil A will cool every steel grade faster in every furnace or tank. Production agitation may suppress film boiling, the load may alter local flow, and the workpiece surface may wet differently from the nickel-alloy probe. Bath temperature, concentration of contaminants, probe placement, and part geometry can all change the heat-transfer sequence. Nor does the ranking establish a Grossmann H-value unless a validated relationship has been developed for that quenchant and application.
The study Effect of Thermal Conductivity and Viscosity on Cooling Performance of Liquid Quench Media used the ISO/DIS 9950 probe method to relate measured cooling performance and Grossmann H-values to thermal conductivity and viscosity. Such work shows how probe data may be connected with engineering models, but the connection depends on the test conditions and the assumptions of the model. A conductivity or viscosity value alone does not determine the cooling curve; wetting and boiling behavior can dominate particular temperature intervals.
Cooling-curve testing is therefore most reliable when its scope is stated precisely: probe material, standard, bath temperature, agitation condition, measured temperature range, and reported cooling-rate metric. “Water is more severe than oil” may be a useful first approximation under comparable conditions. It is not a complete test result. The defensible comparison is always between measured curves obtained by specified methods and interpreted with the actual steel, geometry, and quenching arrangement in view.
ASTM D8562-24 for Aqueous Polymer Quenchants
ASTM D8562-24 defines a non-agitated silver-probe cooling-rate test for aqueous polymer quenchants used with steel alloys. Strong evidence
ASTM D8562-24 specifies a non-agitated silver-probe cooling-rate test for aqueous polymer quenchants used with steel alloys. That wording defines the method’s boundary. It does not establish a permanent ranking in which every polymer solution falls between oil and water, and it does not assign one universal cooling severity to an aqueous polymer by composition alone. The result belongs to a specified probe, vessel, quenchant condition, and heat-transfer test.
This distinction matters because “quenchant type” and “measured cooling severity” describe different things. An aqueous polymer solution is identified by its dissolved or dispersed polymer system and concentration; its measured cooling curve also reflects temperature, contamination, wetting behavior, fluid motion, and the probe arrangement. Grossmann quench severity, expressed as the H-value, is a separate engineering representation of quenching intensity. A D8562-24 cooling-rate result should not be treated as an H-value unless an appropriate analysis has been carried out and its assumptions are valid.
Silver-probe test scope
The silver probe gives D8562-24 a defined thermal response. Silver has high thermal conductivity, so the probe is intended to register the heat-transfer behavior imposed by the quenchant at its surface rather than the transformation behavior of a steel specimen. The measured temperature-time record can then be converted into cooling-rate information at specified temperatures or temperature intervals. The test therefore characterizes the quenchant under the method conditions; it does not directly predict the temperature history of every steel part.
That limitation is not a defect. A standardized probe makes controlled comparison possible. If two aqueous polymer quenchants are tested with the same apparatus, preparation, temperature, and reporting procedure, their cooling curves can be compared on a common basis. The comparison may show, for example, that one solution removes heat more rapidly over a selected temperature range, while another produces a different rate during the later portion of cooling. A single maximum cooling-rate value can conceal that difference.
Cooling is not constant from immersion to final equalization. ASTM International’s review, Heat Transfer during Quenching and Assessment of Quench Severity—A Review, describes distinct quenching stages and the associated changes in heat-transfer behavior. A hot vapor layer may first separate the probe from the liquid; that layer can then collapse as wetting begins, producing a faster nucleate-boiling stage. At lower probe temperatures, boiling diminishes and convection becomes more influential. The transition temperatures, duration of each stage, and cooling rates depend on the liquid and its interaction with the surface.
Polymer quenchants make wetting especially important. Polymer films can form at the hot surface, alter vapor-film stability, and change how liquid reaches the probe. Concentration, solution age, residue, water quality, and contamination can affect that film. The same nominal polymer concentration can therefore produce different cooling curves in different operating conditions. The study Role of Quenching Method on Cooling Rate and Microstructure of Steels: Variations in Coolant and Its Flow Arrangement connects steel microstructure with surface heat-removal rate and local cooling rate, both of which are controlled by coolant type and flow arrangement. D8562-24 measures one controlled manifestation of that behavior, not every possible industrial manifestation.
The probe material also prevents casual interchange between standards. ISO 9950:1995 specifies a nickel-alloy probe test for determining and ranking the cooling characteristics of industrial quenching oils under standardized non-agitated conditions. ASTM D6200 addresses quench oils, whereas D8562-24 addresses aqueous polymer quenchants with a silver probe. A numerical cooling rate from the nickel-alloy oil method is not automatically equivalent to a numerical cooling rate from the silver-probe polymer method. Probe construction, thermal response, specimen geometry, instrumentation, and the quenchant family all affect the result.
Non-agitated test conditions
“Non-agitated” is a major part of the D8562-24 designation, not a minor laboratory detail. The test is intended to measure the cooling response without imposed mechanical agitation or controlled fluid flow around the probe. That condition removes one important variable and supports repeatable comparisons between aqueous polymer solutions. It does not mean that the quenchant is motionless in every physical sense: hot fluid rises, vapor moves, and density differences create natural convection. It means that the method does not deliberately reproduce a pump, impeller, spray jet, nozzle, or workpiece movement.
Industrial tanks rarely behave like a completely quiescent laboratory bath. Parts may enter vertically or horizontally, baskets may move, pumps may circulate fluid, and nearby surfaces may redirect flow. A spray system imposes still different boundary conditions. Flow can break up vapor films, renew cooler liquid at the surface, remove polymer-rich boundary layers, and change the balance between boiling and convection. Consequently, a D8562-24 result describes the non-agitated test condition even when the production tank is agitated.
The quenchant temperature must also be controlled and reported because viscosity, dissolved-gas content, wetting, and heat capacity vary with temperature. Polymer concentration and solution condition require the same discipline. A test performed on a fresh solution at one concentration cannot be assumed to represent an operating bath that has accumulated oil, fines, salts, corrosion products, or polymer degradation products. Cleaning and sampling practices can alter results before the probe enters the liquid.
These factors explain why “water is more severe than oil” is too crude for technical decisions. NPTEL’s 2024 treatment assigns non-agitated water an arbitrary relative severity rating of 1.0. Typical Grossmann reference values are approximately 0.25–0.30 for still oil, 0.9–1.0 for still water, and about 2 for still caustic soda or brine. Broader published ranges give 2.0–5.0 for brine, 0.90–2.0 for room-temperature distilled water, 0.2–1.2 for aqueous polymer solutions, and 0.25–0.80 for conventional or fast quench oils. Those are reference ranges, not immutable material constants. Agitation, temperature, wetting, geometry, and the selected calculation method can move a measured result substantially.
The word “agitated” also requires standards-based precision. ASTM Subcommittee D02.L0.06 identifies ASTM D6482 for agitated aqueous polymer quenchants and ASTM D6549 for agitated quenchants, alongside D6200 for quench oils and D8562 for aqueous polymer quenchants tested with a silver probe. D6482 or D6549 may be more representative when the production process relies on circulation or movement. Selecting D8562-24 for an agitated process solely because it is convenient creates a method mismatch.
Using results for comparison and selection
D8562-24 results may guide quenchant selection or comparison of quench severities, provided the comparison begins with method scope. The first question is not “Which curve has the largest number?” It is “Were the curves obtained by the same applicable method, with the same probe, quenchant temperature, concentration, and agitation condition?” Only after that check should the cooling-rate data be compared.
A useful comparison examines the full curve. The rate during the vapor stage indicates how long the surface remains insulated by vapor. The rate during nucleate boiling may control the passage through temperature ranges where excessive cooling can raise distortion or cracking risk. The lower-temperature convective portion affects how the steel approaches the transformation range and final equalization. For a steel grade, the relevant rate is tied to its critical transformation behavior, section size, geometry, and required microstructure—not necessarily to the maximum rate recorded by the silver probe.
The result can support a controlled change from one aqueous polymer concentration to another, a check on bath deterioration, or a comparison between a polymer solution and another quenchant tested by an appropriate method. It can also reveal that two solutions with similar maximum rates cool differently across the rest of the curve. That difference may matter for hardness, distortion, residual stress, or the formation of martensite, bainite, ferrite, or pearlite in a particular steel alloy.
The result does not, by itself, reproduce every production quench condition. It does not automatically account for part mass, corners, holes, load density, rack position, surface scale, agitation pattern, spray impingement, or the changing temperature of a large bath. Nor does a silver-probe curve directly prove that a specified steel grade will meet a hardness or microstructure requirement. Production validation still requires appropriate steel specimens, representative loads, process controls, and metallurgical examination.
Grossmann analysis can provide another comparison framework, but its H-value should not be confused with the ASTM test output. H-values represent quenching intensity in a heat-transfer model and depend on assumptions about boundary conditions and geometry. The study Effect of Thermal Conductivity and Viscosity on Cooling Performance of Liquid Quench Media relates cooling performance and Grossmann H-values to fluid properties using the ISO/DIS 9950 probe method, illustrating that the measured curve and the calculated H-value are connected but not identical. A D8562-24 curve is evidence from a defined silver-probe test. It becomes a process decision only when interpreted with the steel, component, equipment, and intended cooling condition in view.
Cooling Severity, Hardenability, and Steel Microstructure
Cooling severity describes how rapidly a quenchant removes heat under specified conditions; it does not identify the steel microstructure that will result. That distinction matters because martensite, bainite, pearlite, and ferrite form according to the steel’s composition, austenite grain size, austenitizing treatment, section size, and the actual temperature-time path through transformation ranges. A quenchant can produce different outcomes in different grades, and the same grade can respond differently when agitation, load arrangement, or quenchant temperature changes.
The terminology also needs care. A quenchant type—oil, water, polymer solution, brine, or gas—is not itself a measured severity value. Cooling-curve tests report heat removal for a defined probe, temperature, agitation condition, and test procedure. Grossmann analysis expresses quenching intensity with an H-value, but H is a modeling parameter rather than a permanent material constant. NPTEL’s conventional scale assigns non-agitated water an arbitrary relative severity of 1.0. Reference Grossmann values are approximately 0.25–0.30 for still oil, 0.9–1.0 for still water, and about 2 for still caustic soda or brine. Other commonly cited ranges extend from 2.0–5.0 for brine, 0.90–2.0 for room-temperature distilled water, 0.2–1.2 for aqueous polymer solutions, and 0.25–0.80 for conventional or fast quench oils. These figures are useful comparisons, not immutable rankings.
Critical cooling conditions and transformation products
Austenite must avoid or pass through portions of the time-temperature-transformation diagram at rates that suppress unwanted diffusional products. If cooling remains slow enough for carbon to partition, ferrite and pearlite may form in plain-carbon steels; at somewhat higher rates, bainite may develop. If the steel is cooled below its martensite-start temperature before substantial diffusional transformation occurs, the austenite can transform largely to martensite, with the final fraction depending on the martensite-finish temperature and the amount of retained austenite.
There is no single “critical cooling rate” applicable to every steel. AISI 1045, for example, has much lower hardenability than AISI 4140 because chromium and molybdenum delay transformation, allowing a slower interior cooling path to form martensite. AISI 52100, AISI 4140, and AISI 4340 likewise require separate treatment even when they receive the same nominal quench. Hardenability describes the depth to which a steel can develop a hard transformation structure under a given quench; it is not the same as surface hardness and is not a property of the quenchant alone.
Austenitizing condition changes the starting point. Excessive austenitizing temperature or hold time can enlarge austenite grains, alter carbide dissolution, and shift transformation behavior. In contrast, incomplete carbide dissolution can leave carbon and alloying elements unevenly distributed. Section size then determines how quickly heat can reach the surface and how much heat must travel from the core. A small AISI 1045 bar may cool through the martensitic range quickly enough in oil, while a large bar of the same heat-treated grade may retain pearlite or bainite at its center.
The cooling curve is not a straight line. The ASTM review Heat Transfer during Quenching and Assessment of Quench Severity—A Review describes distinct quenching stages: an initial vapor-blanket or film-boiling stage, a rapid nucleate-boiling stage, and a slower convective stage after the workpiece temperature falls below the quenchant’s boiling-related range. Heat-transfer coefficients change sharply between these stages. Wetting kinetics determine when vapor is displaced from the surface, so two quenches conducted at the same nominal bath temperature can produce different local cooling rates.
ASTM D8562-24 specifies a non-agitated silver-probe test for aqueous polymer quenchants used with steel alloys. ISO 9950:1995 specifies a nickel-alloy probe method for determining and ranking industrial quenching oils under standardized non-agitated conditions. ASTM D6200 covers quench oils, ASTM D6482 covers agitated aqueous polymer quenchants, and ASTM D6549 covers agitated quenchants. Their results can compare conditions measured by those methods; they cannot guarantee that a particular steel section will receive the same thermal history.
The 2022 peer-reviewed study Role of Quenching Method on Cooling Rate and Microstructure of Steels: Variations in Coolant and Its Flow Arrangement makes the practical link directly: steel microstructure is governed by surface heat-removal rate and local cooling rate, both of which are controlled by coolant type and flow arrangement. Thus a jet, an immersion bath, and a moving workpiece may produce different martensite distributions even with the same liquid.
Surface-to-core cooling differences
During quenching, the surface encounters the quenchant first. The core does not. Heat flows from the interior toward the surface, producing a temperature gradient that can be steep during nucleate boiling and less steep during the later convective stage. The surface may cross the martensite-start temperature while the core is still in the pearlite or bainite transformation range. This is why a hardened case can surround a softer center without any change in nominal steel grade.
The effect is especially clear in thick bars, plates, gears, and forgings. A thin AISI 4140 component may cool rapidly across its section, whereas a large AISI 4140 shaft can develop a martensitic rim and a bainitic or pearlitic core. Alloy content shifts the transformation curves, but geometry still controls the thermal path. Corners, holes, keyways, and section transitions also alter heat flow. A corner may lose heat through two or three exposed faces, while a re-entrant region remains hotter and may transform differently.
Flow arrangement can make that variation worse or better. Agitation strips away vapor, renews cooler liquid at the surface, and can raise the local heat-transfer coefficient. A directed jet may cool one face far more quickly than a shielded face. In an immersion quench, vapor pockets can persist beneath horizontal surfaces or inside cavities. The 2022 flow-arrangement study therefore cautions against treating “water quench” or “polymer quench” as a sufficient process description. Location-specific flow determines location-specific cooling.
Quenchant temperature, concentration, viscosity, and thermal conductivity also matter. The study Effect of Thermal Conductivity and Viscosity on Cooling Performance of Liquid Quench Media relates measured cooling performance and Grossmann H-values to these properties using the ISO/DIS 9950 probe method, showing why fluid condition affects the measured result. A polymer concentration change can alter viscosity and wetting behavior enough to change film persistence and nucleate-boiling heat removal. Bath contamination and degradation can do the same.
Hardness, distortion, and cracking tradeoffs
Insufficient cooling leaves more austenite available for diffusional transformation. The resulting ferrite-pearlite or bainitic regions are usually softer than martensite, although bainite hardness varies with grade and transformation temperature. A surface may pass a hardness requirement while the core remains under-hardened. For a component whose load is carried through its section, that gradient can be a design failure even when the measured surface value looks acceptable.
Increasing severity can improve hardening depth, but it also increases thermal and transformation stresses. The surface contracts as it cools, while the hotter core restrains that contraction. Later, the core cools and contracts, while the already transformed surface resists it. Martensite formation adds a transformation strain, and that strain is not uniform when carbon content, temperature, or cooling rate varies through the section. Residual stress, dimensional change, and shape distortion follow.
Cracking is the extreme result of this competition. High-carbon steels such as AISI 1095 and bearing steel AISI 52100 are particularly sensitive because martensite formation produces substantial stress and the available ductility during quenching is limited. Sharp corners, abrupt section changes, decarburized layers, grinding marks, and local vapor-film collapse provide additional stress concentrations. A more severe medium may raise surface hardness yet increase the probability of quench cracks or unacceptable distortion.
The practical objective is therefore not the maximum H-value. It is a cooling path that reaches the required transformation structure with controlled gradients. That may involve selecting a steel with greater hardenability, changing the austenitizing cycle, reducing section thickness, adjusting polymer concentration, controlling bath temperature, or changing agitation and fixture orientation. Tempering then reduces part of the as-quenched stress, but it cannot reliably repair cracking or severe nonuniformity created during the quench. Cooling severity must be judged against the steel grade, geometry, process condition, and measured cooling curve together.
How to Compare Quenchants Without Misreading the Data
A quenchant does not possess one permanent cooling-severity number. “Water is more severe than oil” is a useful first approximation only when the comparison states which water, which oil, which test, and which part of the cooling curve is being considered. Bath temperature, concentration, contamination, agitation, probe geometry, surface condition, and wetting behavior can all change the measured result.
The comparison should therefore begin with a test description, not with a ranking. Record the standard and revision, probe material and dimensions, quenchant temperature, concentration or condition, agitation state, flow arrangement, and the temperature interval used to calculate cooling rate. Then compare complete time–temperature curves, or at least the portions of those curves that correspond to the steel transformation being controlled.
Comparing like with like
Cooling-curve results are method-dependent measurements. ISO 9950:1995 specifies a nickel-alloy probe for determining the cooling characteristics of industrial quenching oils under standardized non-agitated conditions. ASTM D8562-24 specifies a non-agitated silver-probe test for aqueous polymer quenchants used with steel alloys. Those tests do not create a universal oil-versus-polymer scale. They describe how the tested liquid cooled a specified probe under specified conditions.
Probe material matters because the probe is not a steel part. Silver, nickel alloy, and other probe materials have different thermal conductivity, heat capacity, surface condition, and oxidation behavior. Their response can alter the shape and timing of the measured curve, particularly during the transition between vapor-film boiling and nucleate boiling. Probe size and thermocouple position matter as well. A small probe can respond rapidly; a larger probe can retain heat and show a different apparent cooling rate even in the same bath.
The applicable ASTM methods illustrate why labels must accompany results. ASTM Subcommittee D02.L0.06 identifies ASTM D6200 for quench oils, ASTM D6482 for agitated aqueous polymer quenchants, ASTM D6549 for agitated quenchants, and ASTM D8562 for aqueous polymer quenchants tested with a silver probe. A result from ASTM D6200 should not be placed beside a result from ASTM D8562 as though the values came from one common scale.
Agitation is often the largest source of a misleading comparison. A stationary probe in still water may develop a persistent vapor blanket. Movement breaks that blanket, renews liquid at the surface, and changes the duration of film boiling. In an industrial tank, the relevant condition may be vertical flow, cross-flow, impingement from jets, rotation of the work, or flow through passages. “Agitated water” is not one condition. Flow velocity, direction, turbulence, and access to recessed surfaces all affect heat removal.
The quenchant itself also requires a precise description. For an aqueous polymer, report polymer chemistry, concentration, bath temperature, refractometer reading or other concentration control, and degradation or contamination state. For oil, report grade or classification, temperature, viscosity where available, oxidation condition, and circulation. Brine concentration and temperature must be stated. The same named medium can produce different curves after concentration drift, aging, or contamination.
Grossmann H-value belongs in this record, but it must not replace it. In the conventional scale described by NPTEL, non-agitated water is assigned an arbitrary relative severity of 1.0. Typical reference values cited for still oil are approximately 0.25–0.30, still water 0.9–1.0, and still caustic soda or brine about 2. Broader reference ranges place brine at 2.0–5.0, room-temperature distilled water at 0.90–2.0, aqueous polymer solutions at 0.2–1.2, and conventional or fast quench oils at 0.25–0.80. These are working ranges, not immutable material constants. An H-value represents a quenching condition and a modeling convention, not the chemical identity of the liquid.
Reading cooling rate at the relevant temperature
The maximum cooling rate is easy to quote and often poorly suited to a steel heat-treatment decision. It may occur during a short interval after the vapor blanket collapses, while the steel is at a temperature above the range where the final microstructure is being selected. A high peak can therefore coexist with inadequate cooling through a critical transformation interval, or with excessive cooling at a temperature where cracking and distortion become likely.
Quenching normally passes through distinct heat-transfer stages: film boiling, nucleate boiling, and liquid convection. The ASTM review Heat Transfer during Quenching and Assessment of Quench Severity explains that cooling rate changes through these stages and is controlled by different heat-transfer mechanisms. The curve is consequently more informative than one maximum value. Examine the time to reach selected temperatures, the rate at those temperatures, the duration of each boiling stage, and whether cooling is smooth or contains abrupt changes.
The relevant interval comes from the steel and the required structure. For a plain-carbon or low-alloy steel, cooling through the pearlite and bainite transformation ranges may determine whether martensite forms. Those ranges vary with composition and prior-austenite grain size, so a generic “maximum cooling rate” cannot answer the question. AISI 1045, for example, cannot be assessed using exactly the same critical cooling requirement as AISI 4140 or AISI 52100. Use the applicable continuous-cooling-transformation or time-temperature-transformation data, then inspect the quenchant curve over the corresponding temperature range.
The martensite-start temperature is also relevant. Cooling below that point begins martensitic transformation, while the rate at lower temperatures affects temperature gradients, transformation stress, and the amount of retained austenite. A quenchant that cools very rapidly from the austenitizing temperature but slows substantially before or during martensite formation may produce a different balance of hardness and distortion from one with a lower peak but steadier cooling.
A practical comparison might report rates at 800, 600, 400, and 200 °C, with the exact temperatures selected for the alloy and process. It should also show the full curve from the austenitizing region to the bath temperature. If only a peak rate is published, its temperature and duration should be stated. Without them, the number has little metallurgical meaning.
Cooling rate alone still does not describe every risk. Surface temperature may differ sharply from core temperature in a thick section, and local geometry can trap vapor or restrict flow. Heat extraction at an edge, hole, shoulder, or contact point may differ from that at a broad exposed face. The peer-reviewed 2022 study Role of Quenching Method on Cooling Rate and Microstructure of Steels: Variations in Coolant and Its Flow Arrangement directly relates steel microstructure to surface heat-removal rate and local cooling rate, showing why coolant type cannot be separated from its flow arrangement.
Separating laboratory ranking from production behavior
A laboratory test can rank liquids under controlled conditions. It cannot, by itself, certify the result for every steel size and component shape. A silver probe tested in non-agitated polymer at 25 °C represents that method and condition. It does not represent a long shaft in a circulating tank at 50 °C, a blind cavity receiving intermittent flow, or a load whose quenchant temperature rises during production.
The distinction is especially important when comparing still and agitated tests. ASTM D6482 and ASTM D6549 address agitated conditions, while ASTM D8562 addresses non-agitated aqueous polymer testing with a silver probe. ISO 9950:1995 likewise specifies standardized non-agitated conditions for industrial quenching oils. A laboratory ranking can reverse when agitation changes vapor removal or when a component presents a different surface area-to-volume ratio.
Production validation should connect the cooling curve to the actual steel and section. Use thermocouples or instrumented loads where practical, examine hardness from surface to core, and inspect microstructure at locations exposed to different flow conditions. Distortion, cracking, soft spots, and load-to-load variation are component-level outcomes; none is fully predicted by a single probe maximum.
ASM International’s ASM Handbook, Volume 4F, Quenchants and Quenching Technology, provides the appropriate organizing distinction among quenchant type, quench severity, cooling stages, and quenching of steel. The study Effect of Thermal Conductivity and Viscosity on Cooling Performance of Liquid Quench Media also relates measured cooling behavior and Grossmann H-values to physical properties using the ISO/DIS 9950 probe method, reinforcing that an H-value is an interpreted process measure rather than a fixed property of “oil” or “water.”
The defensible question is therefore not “Which quenchant ranks highest?” It is “Which quenchant, under which controlled condition, removes heat at the required rate through the relevant temperature interval without imposing unacceptable distortion or cracking?” That question leads to comparable data. A bare ranking does not.
A Standards-Based Workflow for Quench Control
Quench control starts with the steel, not with a ranking of water, oil, polymer, and brine. A quenchant is only one part of the heat-transfer system. The measured result also depends on probe material and geometry, bath temperature, concentration, agitation, flow arrangement, surface condition, and the portion of the cooling curve being examined. A standards-based workflow therefore treats cooling severity as a process variable that must be measured and related to the required properties of a particular component.
Define the steel, geometry, and required outcome
Record the steel designation exactly as specified by the applicable product standard. Examples include AISI 1045, AISI 4140, ASTM A29/A29M grade 4140, EN 10083-3 steel grade 42CrMo4, and SAE J404 grade 52100. The designation is not a minor administrative detail: chemistry, hardenability, prior-austenite grain size, and section size determine how rapidly the center must cool to form the required microstructure.
The initial specification should state the heat-treatment condition and the intended result. Identify the austenitizing temperature, hold time, transfer time to the quench, and whether the target is predominantly martensite, a martensite-and-bainite mixture, or a deliberately softer structure. For AISI 1045, for example, the required quench response differs sharply between a thin shaft intended to reach a high martensitic hardness and a thick plate in which a controlled martensite fraction and limited cracking risk are acceptable. For AISI 4140 or 42CrMo4, the hardenability supplied by alloying permits a different cooling requirement than plain-carbon steel.
Section dimensions must include more than nominal thickness. Record diameter, wall thickness, keyways, holes, sharp corners, bore-to-wall ratios, and changes in section. A 50 mm solid bar, a 50 mm outside-diameter tube, and a 50 mm-thick plate do not present the same heat-flow problem. The surface cools first, while the core continues to release heat; geometry controls the temperature gradients that produce transformation and residual stress.
State allowable distortion and cracking risk before selecting the quenchant. A dimensional tolerance, runout limit, hardness range, and surface-condition requirement make the outcome testable. Specify whether hardness is required at the surface, at a defined depth, or along a traverse from surface to center. For a through-hardened component, include the required effective hardened depth and the acceptance criterion, such as a minimum Rockwell C hardness or a Jominy-derived hardenability comparison.
This definition also prevents misuse of Grossmann H-values. The conventional scale assigns still, non-agitated water an arbitrary severity of 1.0, as described by NPTEL in 2024. Typical reference values are about 0.25–0.30 for still oil, 0.9–1.0 for still water, and approximately 2 for still caustic soda or brine. Other published ranges place brine at 2.0–5.0, room-temperature distilled water at 0.90–2.0, aqueous polymer solutions at 0.2–1.2, and conventional or fast quench oils at 0.25–0.80. These are reference ranges, not fixed material constants. An H-value changes with agitation, temperature, wetting, concentration, and test conditions.
Select a test method within its scope
Choose the test method after defining the process, because no cooling-curve standard represents every industrial quench. ASTM International’s Subcommittee D02.L0.06 identifies ASTM D6200 for quench oils, ASTM D6482 for agitated aqueous polymer quenchants, ASTM D6549 for agitated quenchants, and ASTM D8562 for aqueous polymer quenchants tested with a silver probe. ASTM D8562-24 specifies a non-agitated silver-probe cooling-rate test for aqueous polymer quenchants used with steel alloys. Its output can support comparison under that method; it does not establish a universal ranking against every oil, water system, or production tank.
ISO 9950:1995 specifies a nickel-alloy probe method for determining the cooling characteristics of industrial quenching oils under standardized non-agitated conditions. This scope matters. A result from ISO 9950:1995 describes the oil and the specified test arrangement, not automatically the behavior of that oil around a moving steel load with active circulation. The probe alloy, probe dimensions, thermocouple location, immersion procedure, and data-reduction method affect the recorded curve.
Before testing, document quenchant identity, formulation or oil type, concentration where applicable, contamination limits, bath volume, bath temperature, probe temperature, and cleaning procedure. Record whether the probe is stationary, rotated, moved through the bath, or exposed to a directed jet. Agitation should be reported quantitatively when possible: impeller speed, flow rate, jet velocity, nozzle arrangement, or measured tank circulation. “Agitated” alone is not enough to reproduce a result.
Review the complete time-temperature curve rather than extracting one cooling rate without context. Quenching includes distinct heat-transfer stages. In the early vapor-film stage, a stable vapor layer can restrict heat removal. As wetting begins, nucleate boiling can produce a much higher heat flux. At lower temperatures, boiling ends and convection controls the later cooling. ASTM’s 2024 review, Heat Transfer during Quenching and Assessment of Quench Severity, emphasizes that cooling rate changes across these stages and depends on wetting kinetics and heat-transfer mechanisms.
The peak cooling rate, the temperature at that peak, and the time required to pass critical transformation ranges can have different metallurgical meanings. A quenchant may cool rapidly near the martensite-start temperature but slowly during the pearlite or bainite range, or the reverse. A single ranking conceals that distinction. Cooling-curve analysis under ASTM D6200, D6482, D6549, or ASTM D8562-24 should therefore be selected according to quenchant class and flow condition, with deviations from the stated method recorded.
Correlate test results with the heat-treatment process
A probe curve is evidence about heat transfer, not proof that a component will meet its specification. The next step is a controlled production-representative trial using the actual steel grade, section geometry, loading pattern, furnace-to-tank transfer time, and quench movement. A silver or nickel-alloy probe does not reproduce the thermal mass, surface condition, geometry, or transformation heat of a steel part.
Measure hardness at defined locations. For a bar or shaft, include surface, subsurface, and center readings; for a plate, define the face and mid-thickness locations. Use the relevant hardness standard and record the scale, load, indenter condition, and surface preparation. Where hardenability is central to the decision, compare the result with a Jominy end-quench profile or an established hardenability model for the specified heat, but do not substitute Jominy data for a component trial.
Metallography supplies the necessary second check. Examine representative surface and core sections for martensite, bainite, ferrite, pearlite, retained austenite, decarburization, and quench cracking. A high surface hardness can coexist with an under-hardened core. Conversely, a severe quench can produce adequate hardness while generating unacceptable crack networks or distortion. The 2022 peer-reviewed study Role of Quenching Method on Cooling Rate and Microstructure of Steels: Variations in Coolant and Its Flow Arrangement relates steel microstructure to surface heat-removal rate and local cooling rate, both of which are controlled by coolant type and flow arrangement.
Use the cooling curve to explain the metallurgical result, then adjust one process variable at a time. If hardness is low at the center, investigate transfer delay, load arrangement, bath temperature, concentration, and circulation before simply selecting a nominally more severe quenchant. If distortion is excessive, examine asymmetric flow, vapor entrapment, part orientation, and the cooling-rate gradient around holes and corners. Recheck quenchant concentration, viscosity, thermal conductivity, contamination, and aging because studies using the ISO/DIS 9950 probe method have related cooling performance and Grossmann H-values to these properties.
Standards-based quench-control workflow
- Define Identify the exact steel grade, section geometry, target microstructure, hardness profile, and distortion limits.
- Select Choose an ASTM or ISO test method within its stated scope.
- Measure Record cooling curves while documenting temperature, agitation, flow arrangement, and bath condition.
- Validate Run a representative heat-treatment trial and verify hardness and metallography.
- Retain Keep the evidence with the batch and equipment records.
The operating workflow is therefore: identify the exact steel grade and standard; record section geometry, hardenability, target microstructure, hardness profile, and distortion limits; select an ASTM or ISO method within its stated scope; measure or review cooling curves while documenting temperature, agitation, flow arrangement, and bath condition; run a representative heat-treatment trial; verify hardness and metallography; and retain the evidence with the batch and equipment records. Standards improve comparability and expose uncontrolled variables. They do not remove the need for validation on the actual steel and component.
References
- [1] Heat Transfer during Quenching and Assessment of Quench Severity—A Review. ASTM Special Technical Publication, 2024. https://store.astm.org/stp49142s.html
- [2] Role of Quenching Method on Cooling Rate and Microstructure of Steels: Variations in Coolant and Its Flow Arrangement. Peer-reviewed study, 2022. https://htp.engin.umich.edu/wp-content/uploads/sites/119/2022/02/Jet-and-immersion-quench-boiling.pdf
- [3] NPTEL materials on quench severity. NPTEL course materials, 2024. https://archive.nptel.ac.in/content/storage2/courses/113101003/parts/partVI/module3/1.3.html
- [4] Effect of Thermal Conductivity and Viscosity on Cooling Performance of Liquid Quench Media. Peer-reviewed study, 2024. https://www.sciencedirect.com/topics/engineering/quench-severity
- [5] ISO 9950:1995. International Standard, 1995. https://www.iso.org/es/contents/data/standard/01/78/17848.html